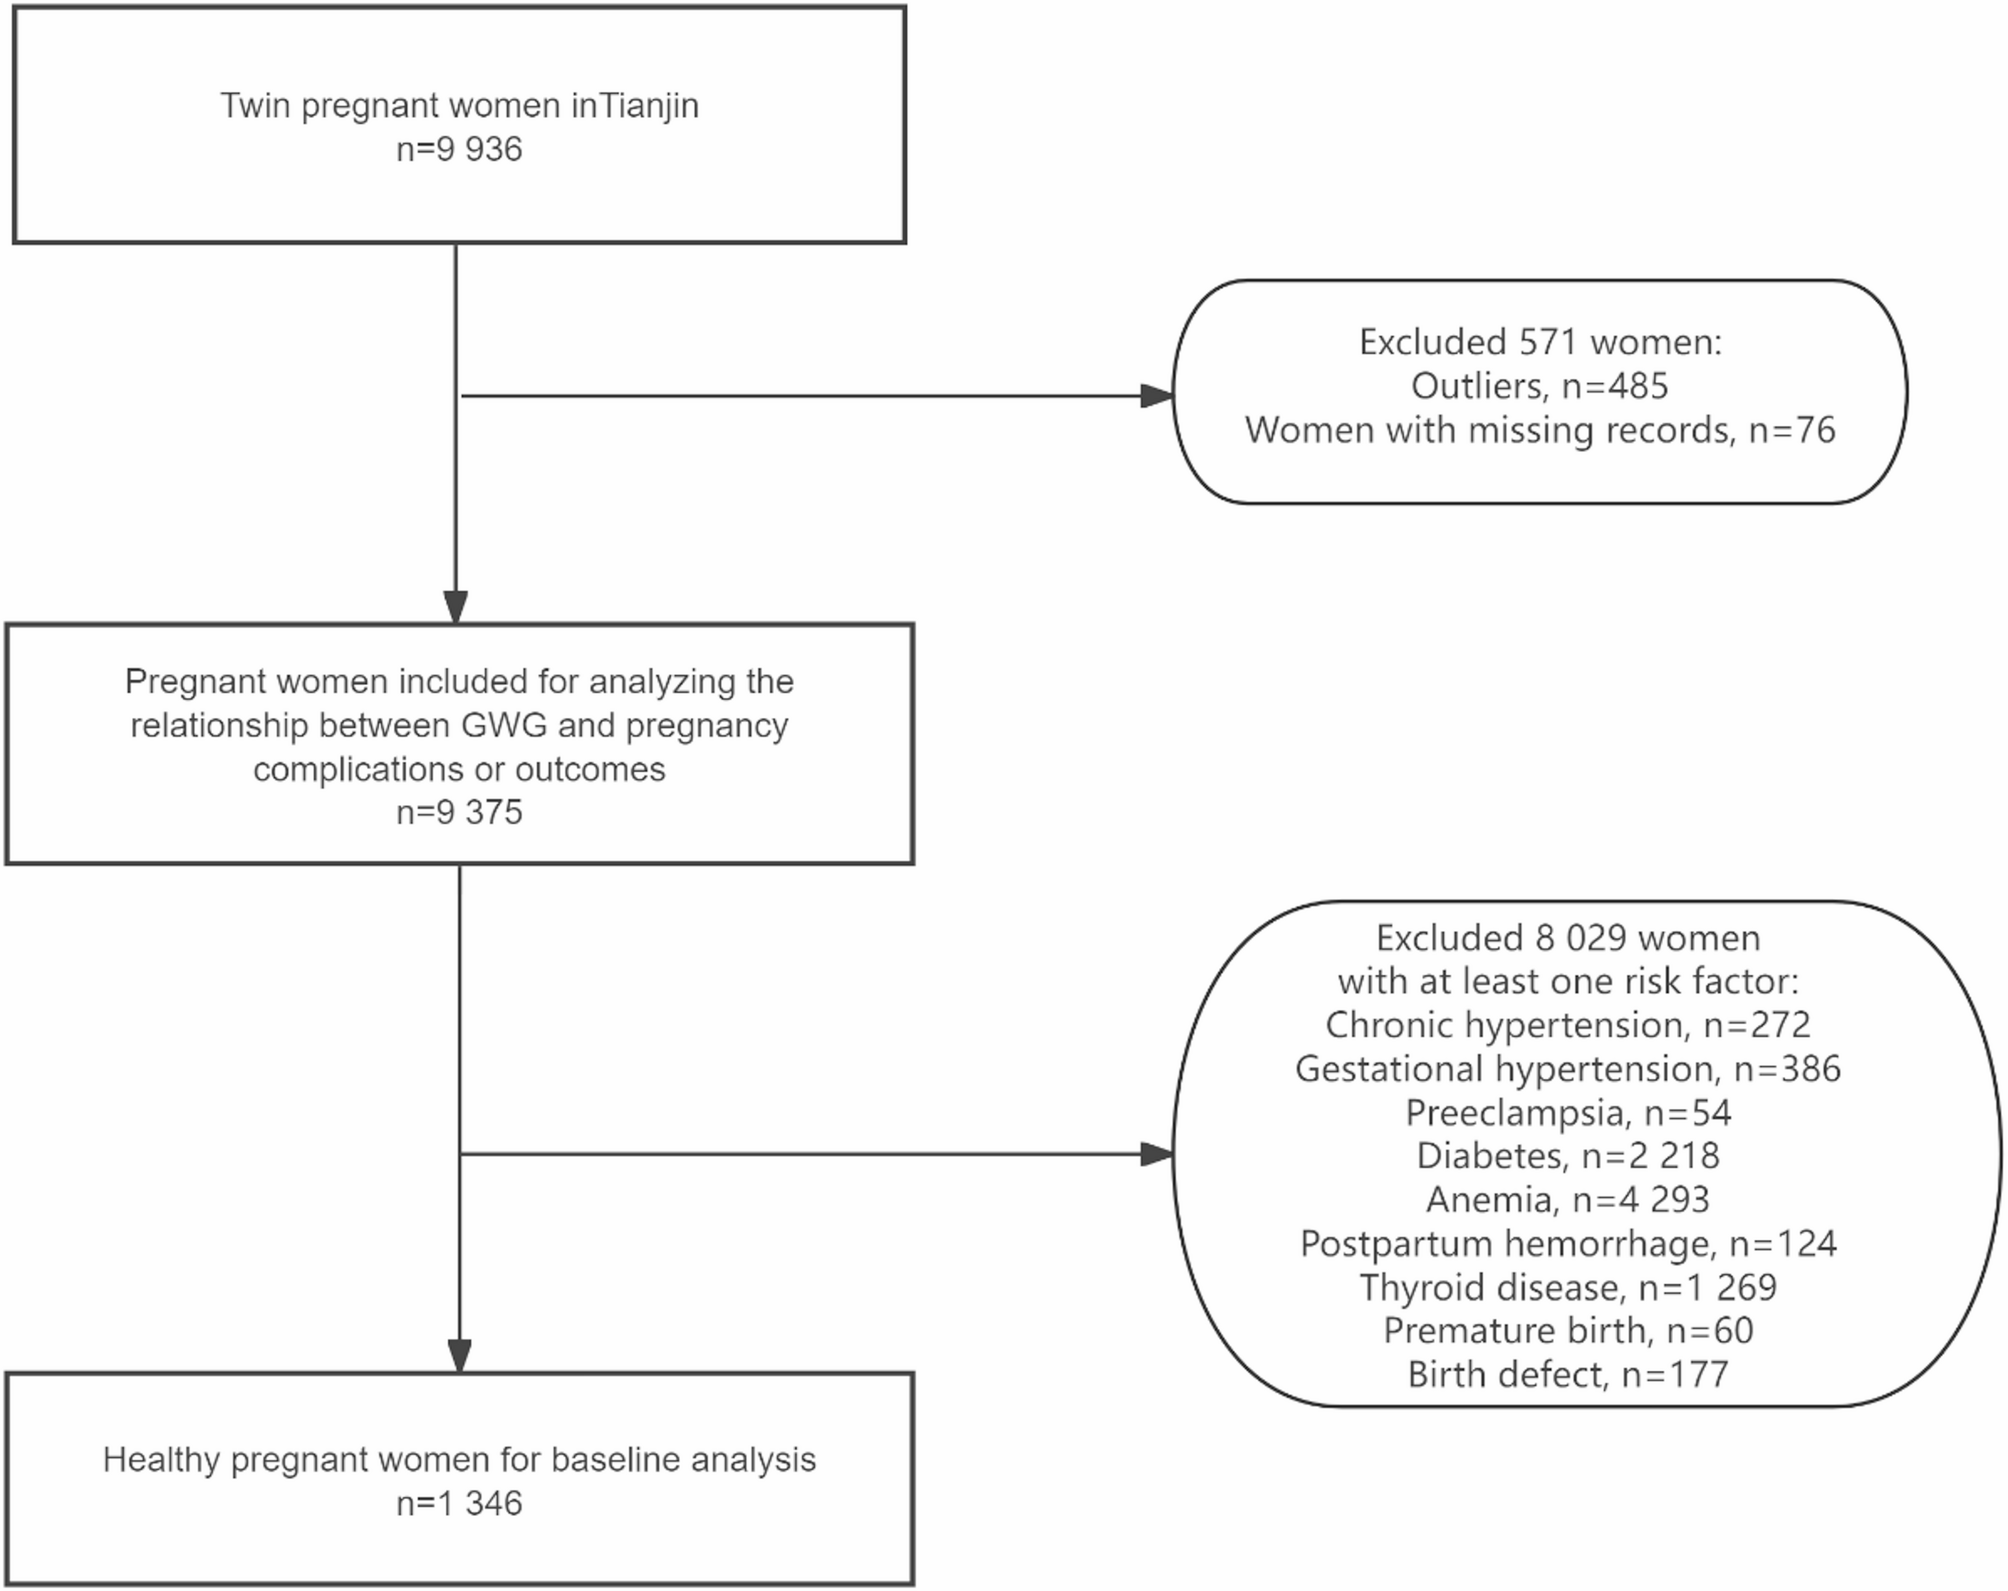
There were 19 872 twin births to 9936 women between January 1, 2010, and November 30, 2018, in Tianjin. After excluding outlier records, 9375 women and 18 750 infants were included (Table 1). To obtain a healthy population, we excluded 8029 women due to the presence of disease or unhealthy infants (Fig. 1).
This study analyzed maternal groups by prepregnancy BMI: 900 underweight (< 18.5), 5517 normal (18.5–23.9), 2068 overweight (24.0–27.9), and 890 obese (> 28). Mean age and parity rose slightly with BMI, from 27.5 ± 4.2 years and 1.2 ± 0.5 in the underweight group to around 29–29.7 years and 1.4 ± 0.6 in the obese group. Birthweight (2426–2514 g) and body length (46.9–47.2 cm) were similar across groups. Higher education proportions decreased from 56.9% (normal) to 38.4% (obese). Over 95% of each group were Han Chinese, and urban registration increased from 80% (underweight) to 89% (obese). Employment rates were 60–65%, with smoking rates < 1%. Anemia incidence dropped with higher BMI from 64.1 to 40.3%, while diabetes and hypertension rates rose, from 16.3 to 33.9% for diabetes, and 3.2–23.1% for hypertension (Table 1).
Flow diagram of the study population
The evidence strongly suggests that many diseases during pregnancy may influence GWG. Therefore, only records from a healthy population were used to construct the guideline. Considering the determinant role of BMI in determining GWG, the guideline was established according to the BMI category. After excluding unhealthy women, the study included 1346 pregnant women and 7813 records of their entire pregnancy (Fig. 1). Among these patients, 117 were in the underweight (UW) group, 783 were in the normal weight (NW) group, 320 were in the overweight (OW) group, and 126 were in the obese (OB) group based on the Chinese BMI classification. According to the WHO classification, 117 patients were UW, 897 were NW, 268 were OW, and 64 were OB.
The smoothed percentile curve in Fig. 2 indicates that the underweight group and normal weight group had greater body weight gain during pregnancy than the overweight and obese groups. Underweight, normal weight, overweight, and obese women had median [interquartile range] weight gains at delivery of 20.3 [17.0-24.2], 20.8 [16.6–25.3], 16.7[12.7–20.8], and 16.6[11.5–21.7] kg, respectively. As gestational age increased, the difference in weight gain became more apparent, which is consistent with the IOM 2009 guidelines. What’s more, obese and overweight pregnant women experienced slow weight gain or mild weight loss in the first trimester, which may be attributed to morning sickness or weight control during pregnancy.
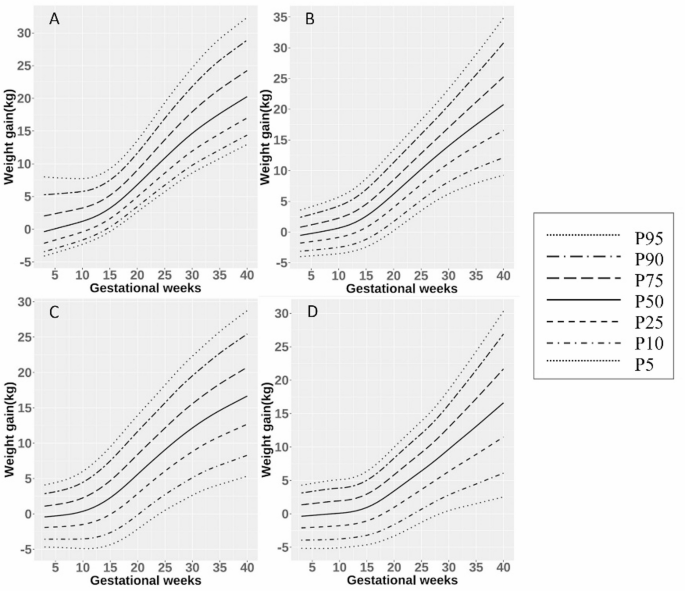
GWG percentile curve for the WHO BMI recommendation. A: underweight group, B: normal weight group, C: overweight group, D: obesity group
As the BMI classification of the Chinese population differs from the WHO classification, we compared the percentile curve of weight gain during pregnancy based on the Chinese BMI classification (Fig. 3). According to the Chinese BMI, the appropriate range of weight gain during pregnancy was underweight group 20.27 [17.00-24.24] kg, normal group 20.95 [16.64–25.66] kg, overweight group 16.94 [13.39–20.62] kg, and obese group 16.44 [11.29–21.79] kg respectively [17]. The GWGs were similar between the Chinese and WHO normal weight groups. For the obese population, the percentile line calculated based on the Chinese BMI classification was slightly greater than the percentile line from the BMI recommended by the WHO throughout pregnancy. The differences in GWG between the Chinese and WHO BMI charts tended to decrease with increasing gestational age and with increasing GWG in the overweight and obese groups.
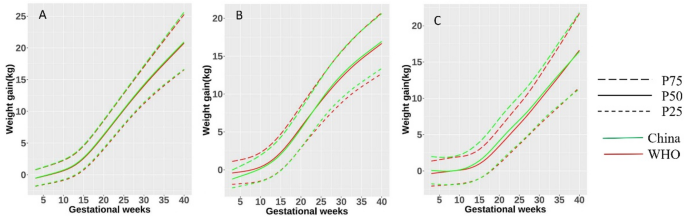
The difference between the GWG percentile curve for the Chinese BMI recommendation and the WHO BMI recommendation. A: Normal weight group, B: overweight group, C: obesity group
We classified pregnant women based on prepregnancy BMI according to WHO classification. While adjusting for other variables, odds of premature is 0.45 times lower among the excessive GWG group compared with the interquartile range of GWG group in the first trimester (95% CI: 0.23–0.97). In the excessive GWG group, a decreased risk for diabetes (1st trimester, aOR = 0.80, 95% CI: 0.69–0.94, 2nd trimester, aOR = 0.73, 95% CI: 0.64–0.83, 3rd trimester, aOR = 0.78, 95% CI: 0.67–0.89) and thyroid-related diseases (1st trimester, aOR = 0.71, 95% CI: 0.58–0.88, 2nd trimester, aOR = 0.81, 95% CI: 0.69–0.96, 3rd trimester, aOR = 0.82, 95% CI: 0.69–0.98) were observed throughout the entire pregnancy period. In the second trimester, adjusted odds of hypertension and adverse pregnancy outcome are 1.53 (95% CI: 1.24–1.91) and 0.68 (95% CI: 0.47–0.98) among women with excessive GWG. The rate of hypertension was increased in women with excessive GWG in the third trimester (aOR = 1.59, 95% CI: 1.28–1.98) (Fig. 4). While controlling for other variables, odds of abnormal birthweight is higher among insufficient GWG group compared with an interquartile range of GWG throughout the entire pregnancy period (1st trimester, aOR = 2.19, 95% CI: 1.03–4.56, 2nd trimester, aOR = 2.22, 95% CI: 1.40–3.57, 3rd trimester, aOR = 1.92, 95% CI: 1.23–3.04). Furthermore, adjusted odds ratios of hypertension and adverse pregnancy outcome are 1.68 times higher (95% CI: 1.16–2.45) and 2.35 times higher (95% CI: 1.18–4.59) among insufficient GWG in the first trimester. Patients in the insufficient GWG group in the second trimester were more likely to have thyroid-related diseases (aOR = 1.27, 95% CI: 1.06–1.51)) and premature(aOR = 2.37, 95% CI: 1.18–4.94). Adjusted odds of diabetes and thyroid_diseases are 1.17 (95% CI: 1.03–1.32) and 1.23 (95% CI: 1.05–1.45) times higher among insufficient GWG group compared with an interquartile range of GWG, while aOR of postpartum_hemorrhage is 0.34 (95% CI: 0.18–0.61) times lower in the third trimester (Fig. 4).
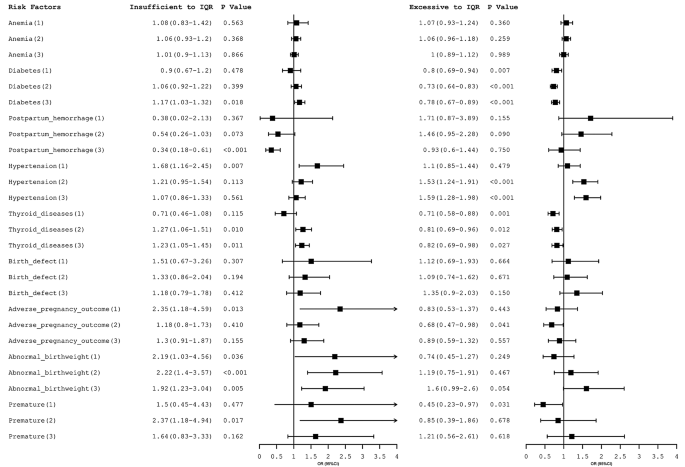
Association between the perinatal outcomes and WHO BMI categorized GWG according to GWG targets by different trimesters. The clinical records of patients were grouped by pregnancy period: (1) first trimester, (2) second trimester, and (3) third trimester. Prepregnant BMI was determined according to the WHO standard. The small square represents the estimated value of the aOR, and the line segment represents the 95% confidence interval of the aOR. IQR: interquartile range
When a similar analysis was carried out based on the Chinese BMI classification, a decreased risk for diabetes (1st trimester, aOR = 0.81, 95% CI: 0.69–0.95, 2nd trimester, aOR = 0.73, 95% CI: 0.65–0.83, 3rd trimester, aOR = 0.78, 95% CI: 0.68–0.90) and thyroid-related diseases (1st trimester, aOR = 0.69, 95% CI: 0.57–0.85, 2nd trimester, aOR = 0.79, 95% CI: 0.67–0.93, 3rd trimester, aOR = 0.83, 95% CI: 0.70-1.00) were observed in the excessive GWG group throughout the entire pregnancy period as well. The women with excessive GWG compared to an interquartile range were at increased risk for hypertension in the second (aOR = 1.56, 95% CI: 1.26–1.93) and third (aOR = 1.62, 95% CI: 1.30–2.02) trimesters. Moreover, aOR of abnormal birthweight was 1.76 times higher among women with excessive GWG in the third trimester (95% CI: 1.09–2.86) (Fig. 5). The aOR among pregnant women with insufficient GWG showed a similar trend except for postpartum hemorrhage in the second trimester (aOR = 0.41, 95% CI: 0.21–0.77) (Fig. 5).
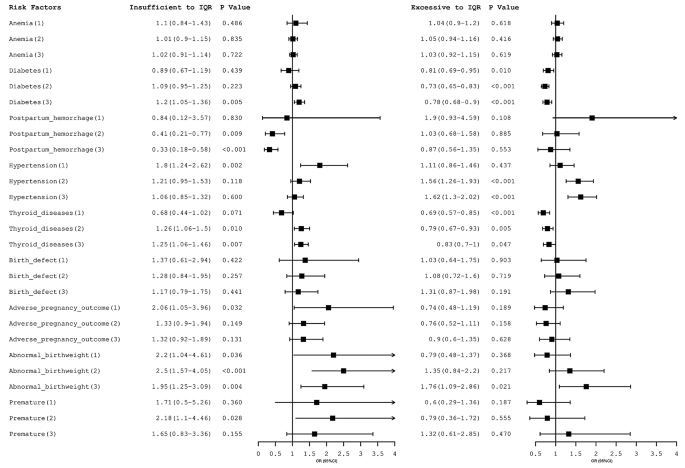
Association between the perinatal outcomes and Chinese BMI categorized GWG according to GWG targets by different trimesters. The clinical records of patients were grouped by pregnancy period: (1) first trimester, (2) second trimester, and (3) third trimester. Prepregnant BMI was determined according to Chinese standards. The small square represents the estimated value of the aOR, and the line segment represents the 95% confidence interval of the aOR. IQR: interquartile range