Baseline characteristics of participants
According to the stratification by the condition of CVD with corresponding sample weights, the baseline characteristics of demographic, examination, blood samples, and urine sample data from 7000 patients with diabetes were demonstrated in Table 1. The average age of eligible patients was 59 years. Compared with the non-CVD group, patients with CVD were more likely to be male, older, non-Hispanic whites, and former smokers, and only slightly over 40% received college education. The CVD group had worse economic conditions and lived without a spouse due to widowhood, divorce, and separation. Regarding anthropometric indices, they tended to have wider waist circumference, higher WWI, WHtR, and WHT.5R (p<0.05). Meanwhile, they had higher hypertension and cancerprevalence rate, and worse kidney function. However, our study showed that patients with CVD exhibits lower serum TG and LDL levels (p<0.05).
Association between WC, WWI, WHtR, WHT.5R and the risk of CVDs
Weighted logistic regression unveiled the association between the four anthropometric indices and the likelihood of CVD, CHF, CAD, and stroke (Table 2). All the four indices showed a significant association with CVD [WC Quartile 4: unadjusted OR 1.72(1.35,2.19), p < 0.001, full adjusted OR 1.95(2.44,2.65), p < 0.001; WWI Quartile 4: unadjusted OR 2.98(2.37,3.74), p < 0.001, full adjusted OR 1.76(1.29,2.42), p < 0.001; WHtR Quartile 4: unadjusted OR 1.64(1.28,2.11), p < 0.001, full adjusted OR 1.84(1.38,2.47), p < 0.001; WHT.5R Quartile 4: unadjusted OR 1.77(1.42,2.22), p < 0.001, full adjusted OR 2.01(1.53,2.63), p < 0.001].
Our findings underscored the significant statistical associations between CHF and several indices. Notably, WC, WHtR, and WHT.5R demonstrated robust associations with CHF, with the highest quartile showing the most significant results [WC Quartile 4: unadjusted OR 2.16(1.53,3.05), p < 0.001, full adjusted OR 2.83(1.79,4.47), p < 0.001; WWI Quartile 4: unadjusted OR 2.69(1.92,3.78), p < 0.001, full adjusted OR 1.46(0.86,2.46), p = 0.156; WHtR Quartile 4: unadjusted OR 2.33(1.64,3.30), p < 0.001, full adjusted OR 2.35(1.51,3.66), p < 0.001; WHT.5R Quartile 4: unadjusted OR 2.18(1.57,3.03), p < 0.001, full adjusted OR 2.33(1.52,3.58), p < 0.001]. Similarly, all indices were significantly associated with the prevalenceof CAD [WC Quartile 4: unadjusted OR 1.66(1.24,2.15), p < 0.001, full adjusted OR 1.64(1.22,2.21), p < 0.001; WWI Quartile 4: unadjusted OR 2.48(1.86,3.31), p < 0.001, full adjusted OR 1.51(1.04,2.19), p = 0.030; WHtR Quartile 4: unadjusted OR 1.34(1.02,1.75), p = 0.034, full adjusted OR 1.43(1.06,1.94), p = 0.019; WHT.5R Quartile 4: unadjusted OR 1.61(1.26,2.07), p < 0.001, full adjusted OR 1.69(1.27,2.23), p < 0.001]. However, when it came to stroke, only the WHtR index showed a significant association [WC Quartile 4: unadjusted OR 1.41(0.95,2.08), p = 0.087, full adjusted OR 1.58(0.96,2.60), p = 0.072; WWI Quartile 4: unadjusted OR 3.00(2.07,4,37), p < 0.001, full adjusted OR 1.65(0.97,2.81), p = 0.066; WHtR Quartile 4: unadjusted OR 1.51(1.06,2.17), p = 0.025, full adjusted OR 1.59(1.01,2.51), p = 0.045; WHT.5R Quartile 4: unadjusted OR 1.51(1.03,2.22), p = 0.037, full adjusted OR 1.61(1.00,2.61), p = 0.053].
Weighted restricted cubic spline analysis
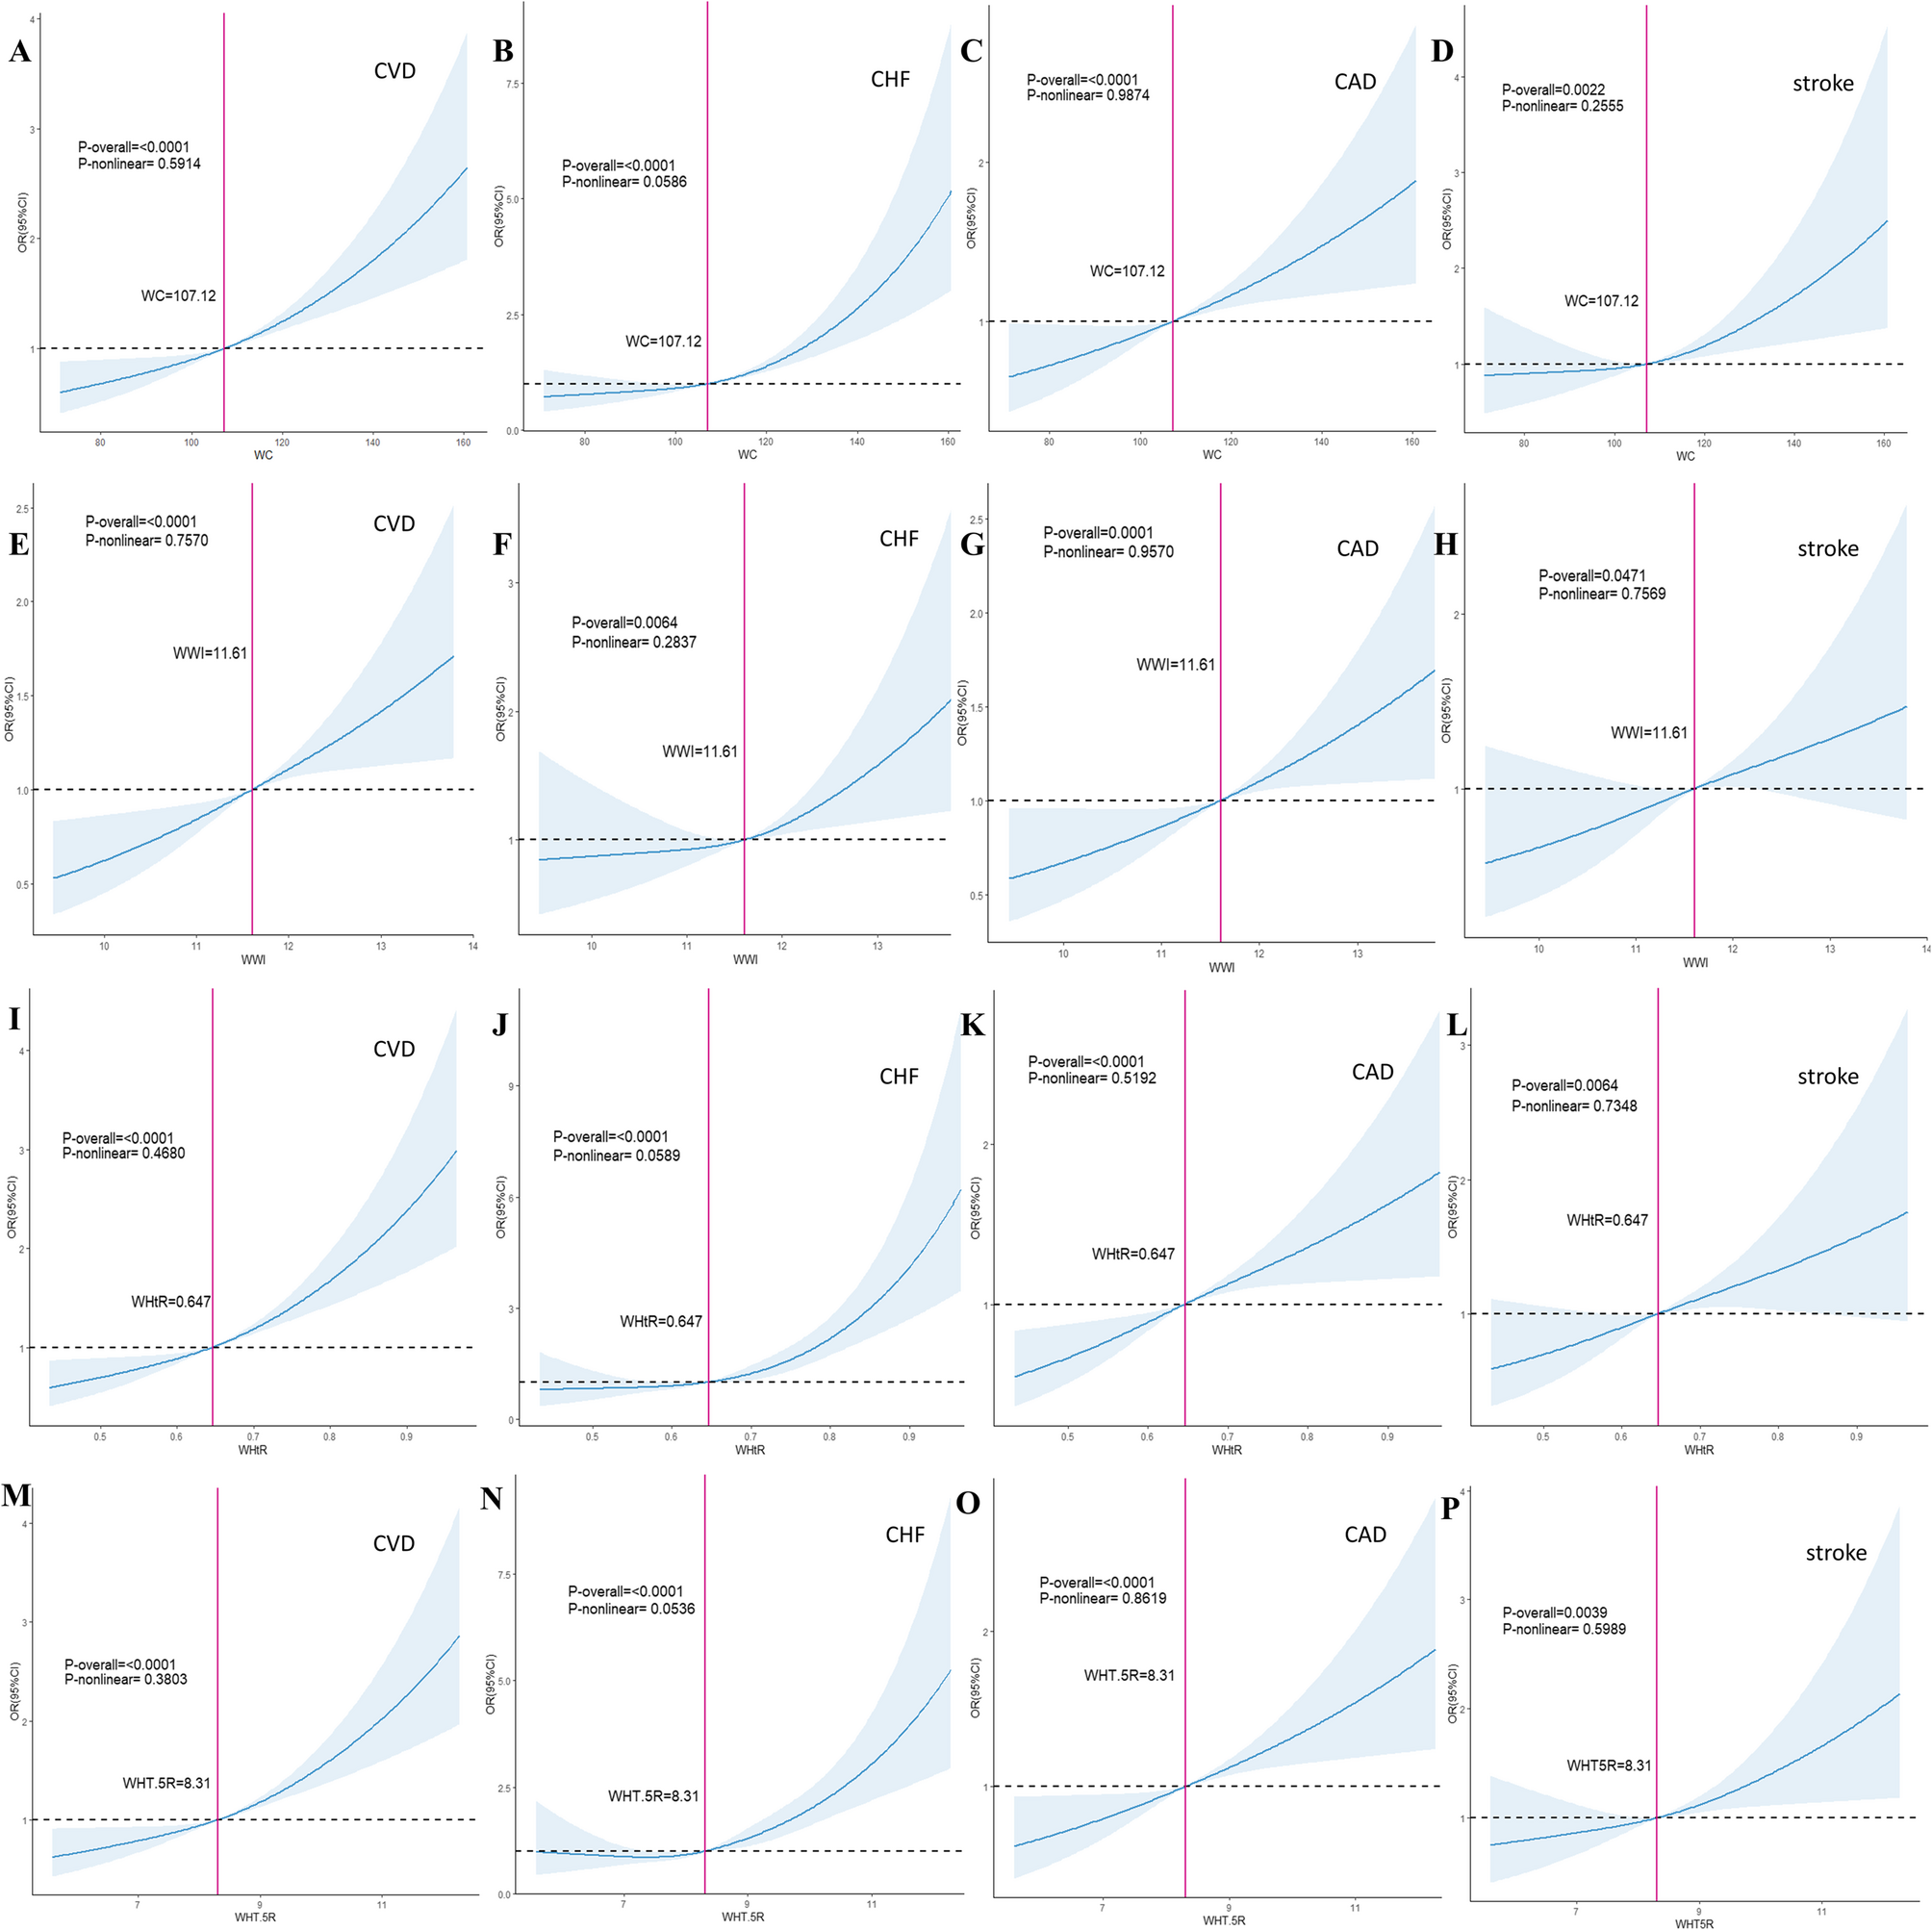
To further explore the association between the four anthropometric parameters and the likelihoodof CVD, CHF, CAD, and stroke, we conducted weighted RCS analyses with a visual demonstration in Fig. 1. All parameters showed a positive linear association with the likelihood of CVD, CHF, CAD, and stroke without nonlinear relationship [WC P-overall for CVD, CHF, CAD, stroke: <0.0001, < 0.0001, 0.0001, 0.0022, respectively; WWI P-overall for CVD, CHF, CAD, stroke: <0.0001, 0.0064, 0.0001, 0.0471, respectively; WHtR P-overall for CVD, CHF, CAD, stroke: <0.0001, < 0.0001, < 0.0001, 0.0064, respectively; WHT.5R P-overall for CVD, CHF, CAD, stroke: <0.0001, < 0.0001, < 0.0001, 0.0039].
Weighted restricted cubic spline analyses of four anthropometric indices and the risk of cardiovascular diseases. All the results were adjusted for age, gender, race/ethnicity, education level, marital status, ratio of family income to poverty, smoking status, alcohol use, serum uric acid, serum creatinine, eGFR, UACR, CKD, hypertension, cancer. Panels A-D show the relationship between WC and the risk of CVD, CHF, CAD and stroke. Panels E-H show the relationship between WWI and the risk of CVD, CHF, CAD and stroke. Panels I-L show the relationship between WHtR and the risk of CVD, CHF, CAD and stroke. Panels M-P show the relationship between WHT.5R and the risk of CVD, CHF, CAD and stroke. OR odds ratio, CI confidence interval, WC waist circumference, WHR waist-to-height ratio, WHT.5R waist divided by height0.5, WWI weight-adjusted-waist index, CVD cardiovascular disease, CHF congestive heart failure, CAD coronary artery disease
Subgroup and sensitive analysis
To elucidate the differences in the association between four anthropometric indices and the prevalence rates of CVD, CHF, CAD, stroke, we performed stratification and interaction analyses in different diabetic populations (Fig. 2 and Supplementary Figs. 2–15). The subgroup and stratified analyses supported most of our results. When WC was used exposure indicators, the likelihoodof CVD elevated in both female[OR 1.23(1.09,1.39), p = 0.0008] and male patients[OR 1.28(1.12,1.45), p = 0.0002], in Mexican American[OR 1.26(1.05,1.52), p = 0.0145], other Hispanic population[OR 1.63(1.24,2.15), p = 0.0005], non-Hispanic white[OR 1.22(1.09,1.46), p = 0.0009], non-Hispanic black[OR 1.26(1.09,1.46), p = 0.0016], in patients who were married or living with a partner[OR 1.28(1.14,1.43), p < 0.0001], or widowed, divorced, separated[OR 1.19(1.03,1.37), p = 0.184], never drinking[OR 1.23(1.09,1.38), p = 0.0008] or having 1–5 drinks/day[OR 1.27(1.12,1.45), p = 0.0003], in never-smoker[OR 1.20(1.05,1.37), p = 0.0079], former smoker[OR 1.32(1.15, 1.52), p < 0.001], or current smoker[OR 1.23(1.01,1.49), p = 0.0353], in all family income levels[≤ 1.5: OR 1.27(1.12,1.44), p = 0.0002; 1.5-4.0: OR 1.21(1.05,1.38), p = 0.0076; >4.0: OR 1.32(1.09,1.37), p = 0.0045], among patients with or without cancer, CKD, hypertension(Fig. 2A). When WHtR and WHT.5R were applied as exposure indices, patients with an increasing prevalence rate of CVD displayed a similar trend (Fig. 2B and Supplementary Fig. 3). However, patients with raising probability of CVD using WWI as an anthropometric tool tended to be female [OR 1.05(1.03,1.30), p = 0.0159], other Hispanic population[OR 1.87(1.39,2.50), p < 0.0001], non-Hispanic black[OR 1.17(1.01,1.36), p = 0.0341], married or living with a partner[OR 1.20(1.08,1.35), p = 0.0012], have higher family income[OR 1.33(1.11,1.58), p = 0.0018], have 1-5drinks/day[OR 1.23(1.08,1.40), p = 0.0014], have no hypertension[OR 1.32(1.12,1.56), p < 0.0008], with cancer[OR 1.20(1.09,1.32), p < 0.0002]. WC, WHtR, WHT.5R demonstrated a significant interaction effect modified by cancer (all three P-interaction < 0.05), and the association between WWI and the prevalence of CVD was modified by marital status (P-interaction = 0.01). Other detailed forest plots about the subgroup and sensitive analyses between the four anthropometric indices, including WC, WWI, WHtR, WHT.5R, and the prevalence of CHF, CVD, and stroke, were demonstrated in Supplementary Fig. 4–15.
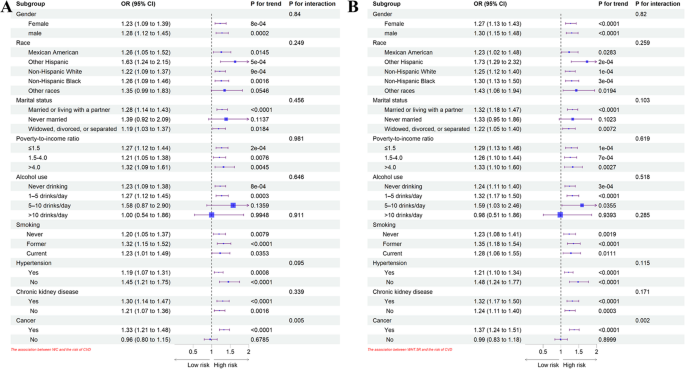
Stratified and subgroup analyses of the association between WC, WHT.5R and the occurrence of CVD. The results were adjusted for age, gender, race/ethnicity, education level, marital status, ratio of family income to poverty, smoking status, alcohol use, serum uric acid, serum creatinine, eGFR, UACR, CKD, hypertension, cancer (When stratifying based on a certain variable, the variable wasn’t adjusted in subgroup analyses). Figure 2A represents the stratification and subgroup analyses of the association between WC and the risk of CVD. Figure 2B represents the stratification and subgroup analyses of the association between WHT.5R and the risk of CVD. OR odds ratio, CI confidence interval, WC waist circumference, WHT.5R waist divided by height0.5, CVD cardiovascular disease