Survey results
Surveys were conducted in spring of 2024 when at least one wastewater treatment plant in every New York County was participating in the wastewater surveillance network, and the network consisted of more than 200 wastewater treatment plants. Out of the 62 counties in NYS, 38 (61.29%) responded to the survey while the remaining 24 (38.71%) did not participate. In ten counties, multiple individuals responded to the survey: 6 counties (15.79%) had two respondents, and 4 counties (10.53%) had three respondents (Fig. 2). In total, 51 individuals submitted surveys. The number of responses varies across the survey based on the number of times respondents may have answered yes or provided additional information to a question based on what is applicable to the respondent.
Numbers of responses of each county in NYS. Seneca, Schuyler, Columbia, and Orange County have 3 responses. Steuben, Cortland, Madison, Delaware, Albany, and Dutchess County have 2 responses
Almost all survey respondents used wastewater surveillance data (49/51) and reported advantages to wastewater surveillance data (48/51), with the most common use being the tracking disease trends. Monitoring variants, detecting diseases early, and assessing public health interventions were the next most common uses reported. (Fig. 3). More than half of the respondents considered wastewater surveillance data to be either very or extremely useful and most respondents had experience interacting with wastewater surveillance data in some forms. The two most common ways interacting with the wastewater surveillance data were reviewing/interpreting the data (n = 48, 94%) and communicating the data within their health departments (n = 40, 78%). Disseminating the results to external stakeholders or the public and making decisions based on wastewater surveillance data were less common but were still reported by more than half of the respondents. When asked what tools the respondents used to understand COVID-19 risk, wastewater surveillance data was the top choice (n = 49, 96%), followed by hospitalization (n = 45, 88%) and case data (n = 32, 63%). The importance of wastewater surveillance data was also emphasized by the respondents as 22 (43%) and 26 (51%) of the respondents found wastewater surveillance data either very or extremely important in understanding COVID-19 risk and transmission, respectively.
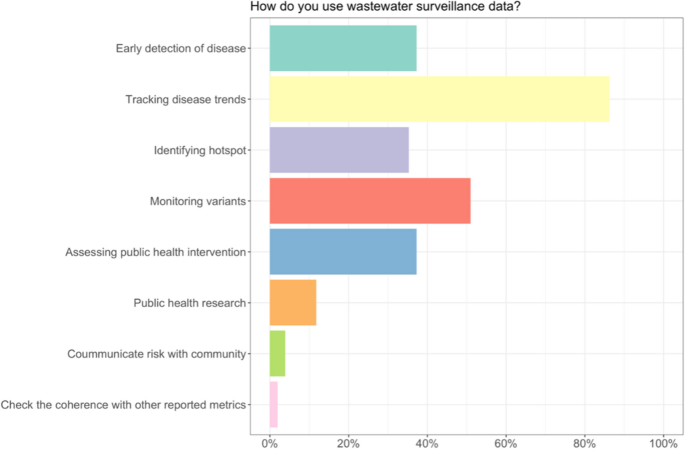
Ways of using Wastewater Surveillance data
Most respondents (n = 39, 76%) reported having “no difficulties” using wastewater surveillance data while 12 respondents (24%) said there was “some level of difficulty”. Regarding how often wastewater surveillance data were checked, the majority of respondents (n = 37, 73%) only examined the data when it was reported each week and not more frequently.
While 27 respondents (53%) reported that they were “very confident” or “extremely confident” in interpreting wastewater surveillance data, 7 respondents (14%) reported that they were either “slightly confident” or “not at all confident”. Accuracy and reliance-wise, most respondents (n = 38, 75%) found wastewater surveillance data to “probably” or “definitely” be an accurate representation of the COVID-19 situation; about half of respondents (n = 24, 47%) reported “often” or “always” relying on wastewater surveillance data to understand the COVID-19 situation. The majority of respondents (n = 32, 63%) also reported that their understanding of wastewater surveillance data has changed since COVID-19.
The majority of the respondents (n = 44, 86%) use wastewater surveillance data in public health communication. More than half of the departments that use the wastewater data to communicate share this information with government agencies (n = 29, 66%) and healthcare workers (n = 23, 52%). The next most reported group is the public, which half of the respondents (n = 22, 50%) report wastewater data and results to, followed by schools (n = 17, 39%). This information was reported to county officials and staff (n = 4, 9%) and boards of health (n = 2, 5%). To communicate the data, the respondents used email the most (n = 16, 36%) followed by reports (n = 11, 25%). The next most used communication methods were websites and meetings, which 10 respondents reported (23%). These are followed by social media and verbal communication, which are used by six of the respondents (14%). Lastly, only four of the respondents (9%) use multimedia as a means of communication.
Only a limited number of respondents indicated having made decisions using wastewater surveillance data alone or alongside other data (n = 13, 25%) or taking action in response to wastewater surveillance data (n = 12, 24%). Survey respondents reported a number of different uses and actions related to the wastewater surveillance data. A common action was communicating results, including transmission risk, to their stakeholders. Another common action was using the data to understand their supply needs in terms of personal protective equipment, rapid diagnostic tests, COVID-19 treatments, and vaccines. A few respondents also used the data for implementing targeted testing and vaccination locations, for education and awareness campaigns, and to inform hospital regulations with regard to face masks and other policies.
Beyond COVID-19, the majority of respondents (n = 45, 88%) foresee wastewater data of opioid use as valuable to understand opioid-related health trends and crises. About one third of respondents (n = 17, 33%) did not foresee challenges to translating and communicating these data, though most respondents (n = 34, 67%) did anticipate challenges. Respondents identified lack of knowledge for interpreting the data as the highest concern followed by limited sewer coverage in rural areas, concerns about privacy, and concern about the differences between medical and illicit drug use. Respondents who felt confident they could use data on opioids from wastewater reported using the data to provide harm reduction services, as well as in funding, interventions, identifying hot spots, informing education and programming activities, and communication.
Respondents also identified many other diseases and substances they would be interested in seeing wastewater results on including influenza, polio, RSV, hepatitis, vaccine preventable diseases, STIs/STDs, and other drugs (e.g., cannabis).
Interview results
Participation
We conducted in-depth interviews with 21 participants from 11 counties. The positions of the participants included department or environmental health directors, epidemiologists, sanitarians, and emergency preparedness coordinators.
Analytical techniques
The results of the interviews are guided by the research questions and analysis methods outlined in Table 1. Each section of the results corresponds to a specific question and draws on thematic, comparative, or narrative analysis, depending on the nature of the data. For example, themes around the utilization of wastewater data and its perceived utility were identified using thematic analysis, while comparative analysis helped explore whether responses differed by the role of the interviewee (e.g., director vs. epidemiologist). Narrative analysis was used to capture how health departments described their collaborations with stakeholders such as hospitals and schools.
Utilization of wastewater data
LHDs use the data to evaluate trends and compare it to other sources such as hospitalizations and case data. Wastewater surveillance data provides an early warning tool that they can compare to other regions. Some LHDs reported wastewater data allowing them to more precisely locate testing and vaccination sites to areas of high risk.
“I would say that we use it mostly as a warning system… if we did see a spike like we were gonna start enforcing masking again after it had been lifted, like by the CDC.” (County 2)
“We used it to make decisions about where we’re going to hold vaccination clinics…” (County 6)
Others reported recommending guidelines and masking advisories through their community organization partners.
“We would send notifications to organizations. We would send a letter to any congregate settings… nursing homes, assisted living facilities, schools, hospitals. we would say, here are some actions… like masking and vaccination when they’re available.” (County 8)
LHDs typically share the data either internally or on their websites via dashboards to keep the public informed on trending COVID-19 risk. They reported sharing instructions with their community organization partners on how to interpret the data.
“We post those weekly testing results on our website for the public… we also will utilize that information to potentially send out notifications in regards to kind of an increase in activity.” (County 5)
Most found the wastewater data to be more reliable than clinical data because it is unbiased, provides anonymity, brings awareness to areas that may be missed or overlooked and is a steady data source. When compared to survey responses, interview answers were similar but more in-depth.
“I like the wastewater data because… it’s a great way to just get a snapshot of what’s going on in the community rather than mining medical records or clinical data, which we don’t always have immediate access to. It’s the most reliable out of what we can get right now with less effort… We’re not doing case investigation anymore, so this is really as good as we can get. I think it’s a great baseline for making some decisions or at least… looking ahead” (County 4)
Attitudes about the validity, reliability, and utility of wastewater data
Overall, the health departments reported the wastewater data to be reliable; all LHDs interviewed appreciated the weekly memos and discussed how the data was useful.
“I think they’re fantastic, especially the strain data is really interesting to look at… And I think it’s really great, for the hospitals to see that.” (County 2)
“We use the trends right to inform future activities or current activities. I really like the different strains…That section of the memo where it shows how fast the predominant strain is changing even in our small community. I think that that is pretty impressive. A impressive, that they can find that data and B very impressive, that the strains of disease are changing that much and that fast.” (County 3)
“We love the weekly memos. It gives an idea what is going on in the community. What I would like to do is have one of my epidemiologists really go into it and make some assessments about what’s going on. I think the report is really good.” (County 4)
LHDs also considered the data to be timely and consistent, making it easier to use the data to respond to surges and target outbreak areas (Fig. 4).
“… when COVID was more prevalent, it helped us be able to prepare to anticipate a greater number of hospitalizations and a greater. Illness and this number of illnesses. And then also we were doing contact when we were doing contact tracing it also helped us prepare for the kind of the burden of work just you know, know what to anticipate.” (County 10)
LHDs also felt the data were better than clinical data for understanding disease burden when they shared with community organization partners (Fig. 4). LHDs largely found the wastewater surveillance data useful because the data correlated with case data and provided real-time information.
“ I think they’re really helpful… Once the wastewater results were correlated with hospitalizations. I think that was even more helpful for us and, as I mentioned, we distribute them internally, monitor at the Department of Health level and then respond. If we’re seeing a particular increase with the municipalities.”(County 8)
No differences in the opinions about wastewater were observed based on the position of the respondent (i.e., health directors v. staff epidemiologist/sanitarian).
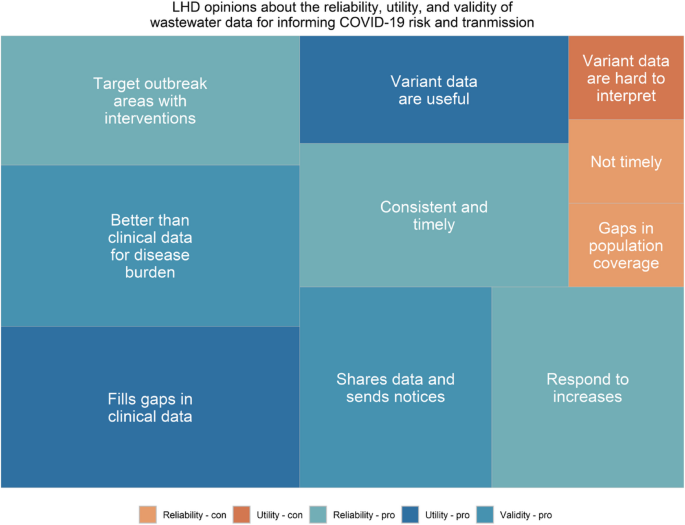
Interviewees reported positive attitudes about the utility, reliability, and validity of wastewater surveillance. Size of rectangles relates to the frequency of the theme. Blue colors indicate a positive attitude and orange indicate a negative attitude. A legend is provided below to demonstrate the pros and cons of Reliability, Utility, and Validity
LHD interaction with stakeholders
LHDs reported sharing the data with hospitals and schools, but not businesses, although during the interviews some reflected on how and why they might share the data with business owners in the future. Another use was the coordination with hospitals for staffing decisions, ordering supplies, and preparing for surges.
“This disease surveillance report that we produce goes to all the hospitals and healthcare providers … and they, in turn at least the hospitals, healthcare providers do provide us with … syndromic surveillance information. And then we use that information, and we put it into our report and add value and additional information that that is then is sent back to the providers, which includes the wastewater data and it gives them kind of instructions on how to interpret that what they may be seeing in their community. And if we need to, we could follow up with providers to provide additional guidance for either testing or vaccinations.” (County 6)
“If there’s a surge we can easily relay that information to the local hospitals and clinics and other medical facilities as well as schools” (County 7)
We’d compare the wastewater data to case data and create weekly epi curves. When we saw rises in COVID, especially around holidays, we’d send notifications to municipalities and congregate settings like nursing homes, schools, and hospitals, letting them know COVID levels were going up in their area. We’d share the data and suggest actions—masking, vaccination, social distancing—and offer to support with pods or outreach. Once wastewater surveillance added prediction modeling for hospitalizations, we also began notifying hospitals to prepare for potential surges. Internally, we circulated memos and reviewed data at least twice a week, since we were sampling twice a week.” (County 8)
LHDs reported using the data in weekly meetings and sending out weekly or monthly notices about the wastewater results for SARS-CoV-2 to the stakeholders in their counties. These reports were not exclusively about wastewater, but combined wastewater data with other disease and mortality information that hospitals and healthcare facilities need to know.
“We did a weekly partners call which involved all the school districts, hospitals, agency partners. We’d have a thousand people a week on this call, and the wastewater data was one of the key tools we’re using in informing the tenor of that call, you know. Are we on alarm, encouraging people to ramp up their efforts? Or are we encouraging folks to stay the course, or even giving them the ability to loosen the reins a little bit. At that time, we had multiple data sources where we had real time case data or almost real time case data that was coming in but definitely, the wastewater surveillance data was one of the tools we’re using to inform that call.” (County 3)
“We do a weekly report. I shared data from that before in the weekly report that goes to the schools, the hospitals… Most of the people are townships get a letter now, too.” (County 9)
Also, respondents identified meetings with local school superintendents as a setting where the wastewater data were frequently discussed.
Future uses of wastewater data
LHDs expressed their desire for the wastewater surveillance network to continue to sample and expand funding opportunities and highlighting recent funding program provided by the state network for samplers given out to smaller treatment plants.
“So you know, obviously, the continuation of the program is very important to us here in the county and then also just the expansion. We tried to bring in a couple of our other … sewersheds that kind of fit that 1 million gallon flow per day, and some people just didn’t have the right equipment for it, so they would have needed … funding or help to bring in those samplers.” (County 2)
“Continue. I think this is a wonderful, standard procedure for all county health departments, even the State of Department and I would ask them to continue looking at expanding the ability to test. For instance, I believe I was looking through some of CDC’s materials, and it’s possible that vector or tick-borne diseases might be able to be monitored through wastewater.” (County 6)
Further, LHDs want the network to add new targets including opioids and influenza (Fig. 5), and to add more sampling locations in rural areas. Opioids were the most requested and discussed potential new target that LHDs mentioned and several had ideas on how they would use that data for overdose mapping, identifying hot spots, and providing a baseline of opioid use to track over time.
“It would be really great to again try other diseases and try to figure out what we could learn, you know, from[the opioid data]. Obviously, I’ve probably said that a million times, and all drugs, not just opioids. Substance use would be very helpful for us.” (County 8)
LHDs also expressed interest in being involved in the decision-making process related to the statewide program rather than just having state-level officials determine wastewater surveillance priorities. Lastly, LHDs expressed a desire for more outreach programs for LHD officials like conferences and training.
“I think, number one, that that training or that conference you had in Syracuse was valuable, I think, meeting you know, having some kind of meeting periodically to discuss moving the ball forward on wastewater surveillance” (County 4)
“And just continually keeping us in the loop on, you know, asking these kind of questions. It’s really nice to be able to ask, Hey, what do you think about something before people make decisions at [the state level]. So that’s very helpful to just, you know, have conversations about what works, what doesn’t work or how we’re getting the information out to the public separately.” (County 1)
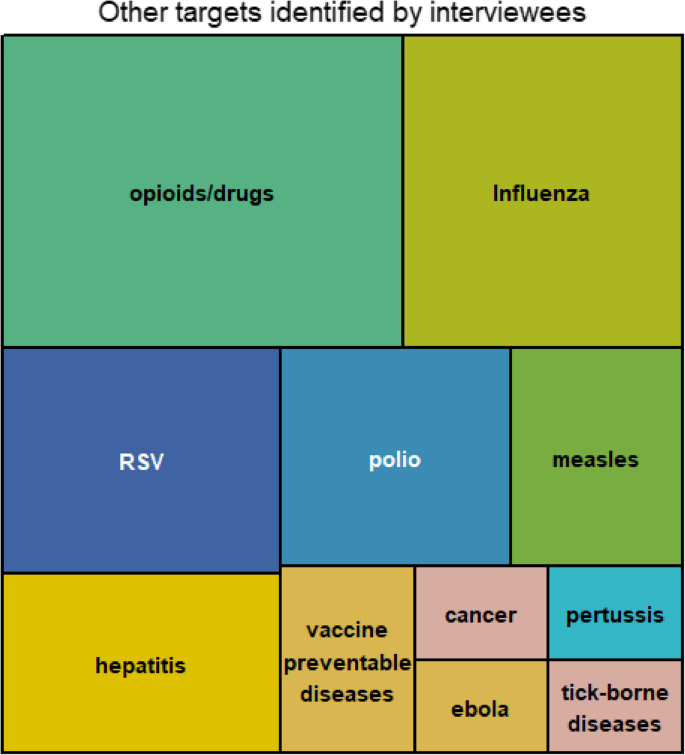
Interviewees identified eleven additional substances and disease that they would like to see added to wastewater surveillance. Size of rectangles indicates the frequency that the substance/pathogen was mentioned