Results of the T2DM with CKD cohort
Baseline data characteristics
As demonstrated in Supplementary Fig. 1, which outlines the pre-PSM screening process, 856 patients were preliminarily assessed, with 36 subsequently excluded. Exclusions were 21 cases of co-infection, 10 cases of concomitant malignant tumors, and 5 patients with thyroid disease or cirrhosis. Ultimately, 820 patients were included in the final analysis. Over an average follow-up period of 33.36 months, 277 patients reached the study endpoint (initiation of dialysis, progression to ESRD, renal transplant, serum creatinine doubling, cardiovascular and cerebrovascular diseases). These included 172 patients who progressed to ESRD, 58 patients with a 50% decline in eGFR from baseline, and 47 patients who experienced major cardiovascular or cerebrovascular events.
PSM analysis of the T2DM with CKD cohort
As shown in Supplementary Fig. 2, variables matched using propensity scores included key clinical characteristics such as sex, age, baseline SCr, and UACR. Matching was performed in a 1:1:1 ratio with a caliper value of 0.2. The balance of propensity scores across the three dietary regimen groups was evaluated using a multi-balance test.
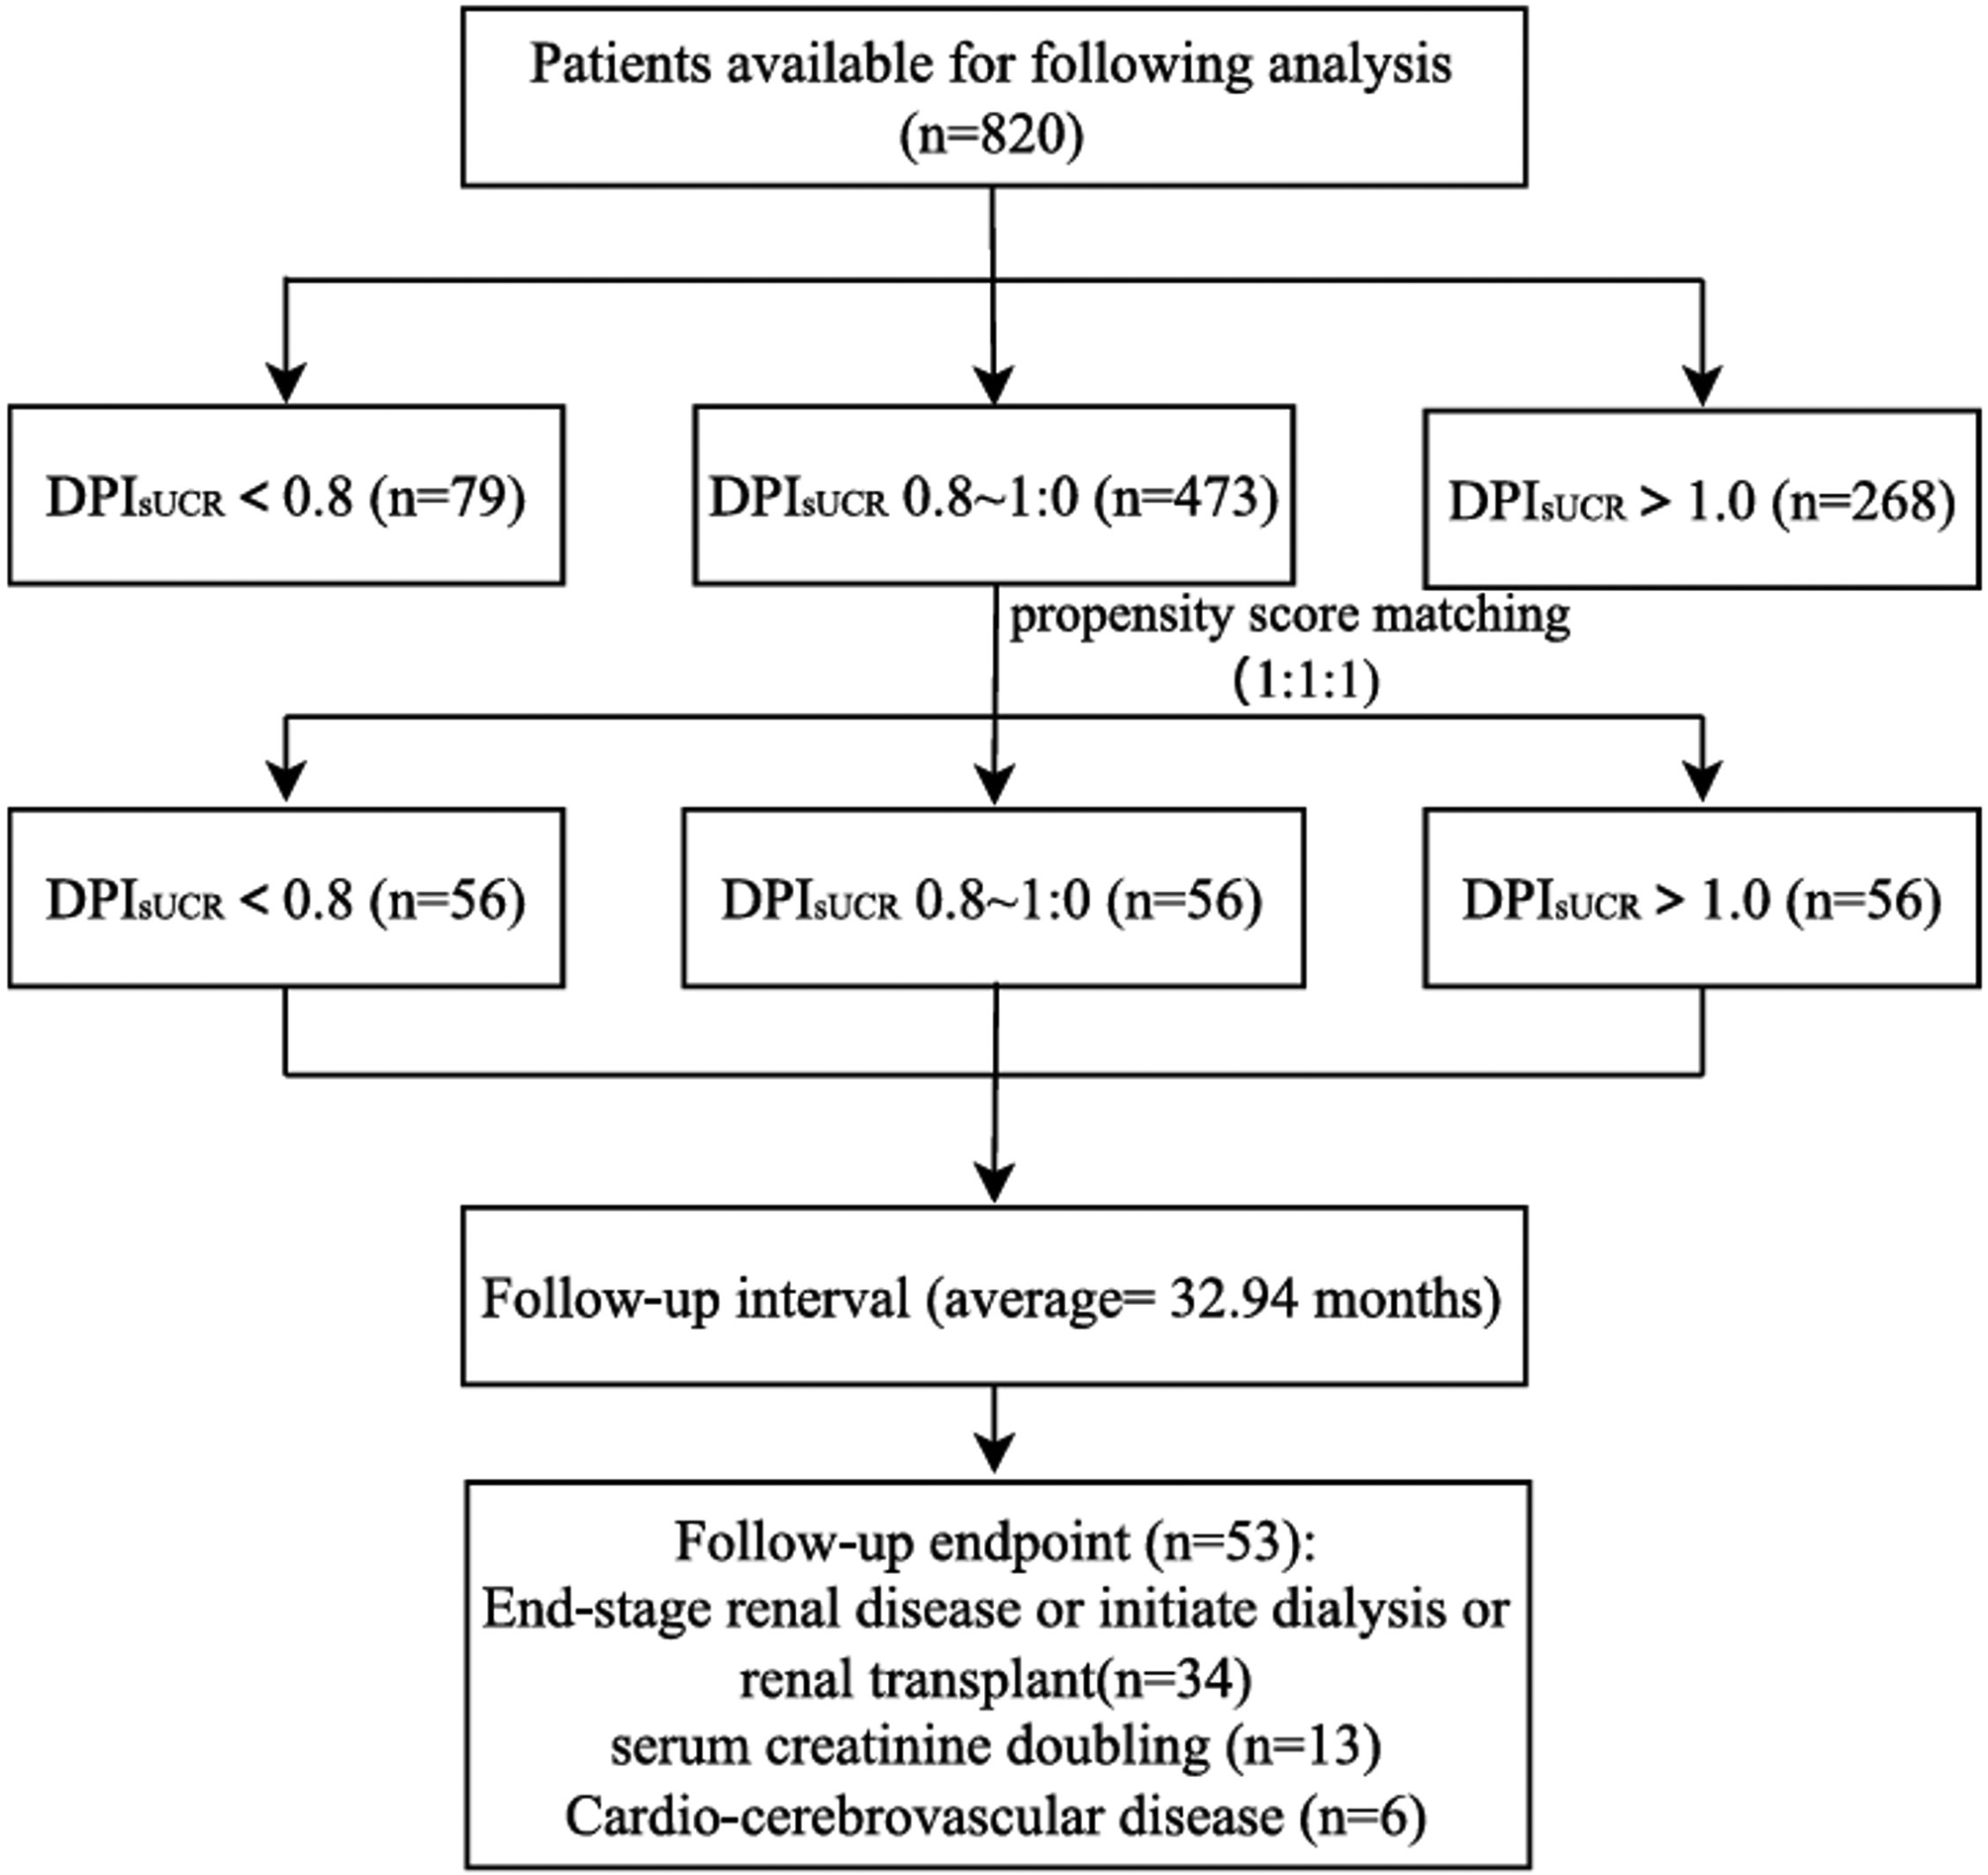
Following 1:1:1 matching, a total of 168 patients were divided into three groups with different DPIsUCR levels in the final analysis, as shown in Fig. 1. After an average follow-up period of 32.94 months, 53 patients reached the study endpoint. Among them, 34 progressed to end-stage renal disease, 13 experienced a 50% reduction in eGFR from baseline, and 6 had cardiovascular or cerebrovascular events. The enrollment process is detailed in Fig. 1.
In the original cohort, baseline characteristics such as gender, age, and eGFR showed significant differences among the three groups. However, after matching, these differences were balanced, as detailed in Table 1. For instance, the baseline ages of the three groups were [57.50 (50.00, 63.00) vs. 57.00 (51.75, 62.00) vs. 55.50 (50.50, 62.00) years, P = 0.672], and baseline renal function (eGFR) values were [46.89 (34.15, 73.23) vs. 55.85 (37.70, 79.26) vs. 51.98 (34.80, 90.05) ml/min/1.73 m², P = 0.548]. Other baseline characteristics also achieved balance.
Baseline utilization rates of renoprotective medications were comparable across CKD stages (Table 1). Among patients with CKD stages 1–3, RAS inhibitors (RASi) were the most commonly prescribed medications, followed by SGLT2 inhibitors (SGLT2i), mineralocorticoid receptor antagonists (MRAs), and GLP-1 receptor agonists (GLP-1 analogues), both before and after PSM. In CKD stage 4, the proportions of medication use were similar. Statistical comparisons revealed no significant differences in medication use between CKD stages 1–3 and stage 4 (all p > 0.05; Chi-square tests).
Flowchart of patients in the T2DM with CKD cohort after propensity score matching. Abbreviation: DPIsUCR dietary protein intake based on sUCR equation
Real-world prognosis analysis of DPIsUCR formula in T2DM with CKD cohort
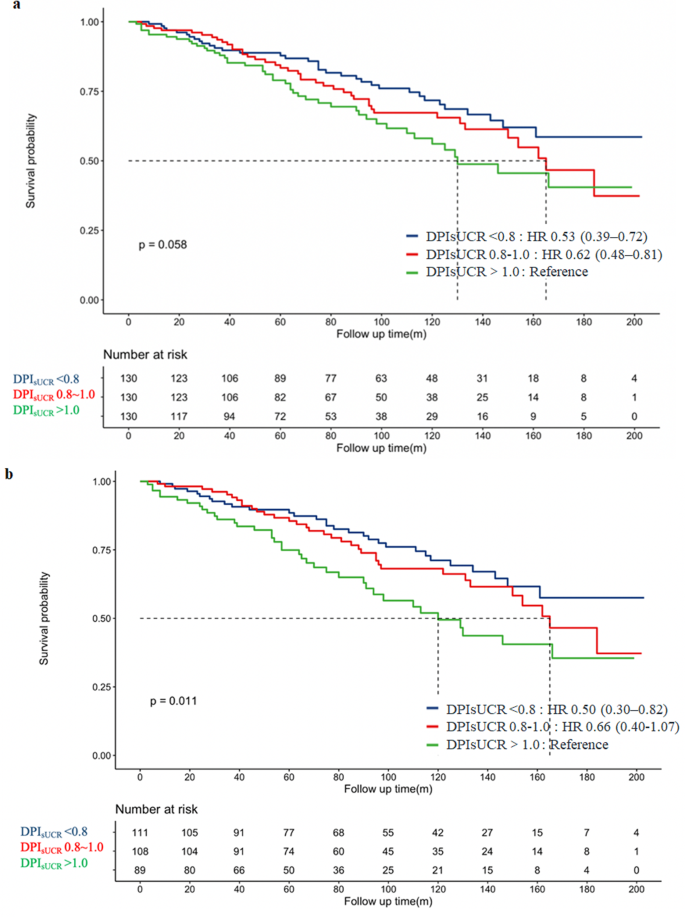
In the matched cohort, we used the Kaplan-Meier curve to assess the relationship between three different DPIsUCR levels and all-cause mortality. As shown in Fig. 2a, the survival curve for patients in the LPD group (DPIsUCR <0.8 g/kg·d), calculated using the DPIsUCR formula, was superior to that of the higher-protein diet group (DPIsUCR >1.0 g/kg·d). Additionally, Fig. 2b illustrates that for CKD stages 3–4 patients, the survival curve for the low-protein diet group (DPIsUCR <0.8 g/kg·d) remained better over time compared to the higher-protein group (DPIsUCR >1.0 g/kg·d), with statistically significant results. To assess whether significant survival differences existed among patients in different dietary protein groups (based on DPIsUCR), we performed both univariate and multivariate Cox regression analyses (Supplementary Table 1). The univariate Cox analysis revealed that, compared to patients with DPIsUCR >1.0 g/kg·d, those with DPIsUCR <0.8 g/kg·d had a 44% lower risk. After adjusting for age, sex, smoking history, SBP, HbA1c, Alb, UA, LDLC, and eGFR in the multivariate Cox regression analysis, the risk for patients with DPIsUCR <0.8 g/kg·d was reduced by 54% compared to those with DPIsUCR >1.0 g/kg·d.
After PSM, patients with DPIsUCR <0.8 g/kg·d had a 56% lower risk of reaching the endpoint compared to those with DPIsUCR >1.0 g/kg·d in the univariate Cox analysis. With further adjustments for age, sex, smoking history, HbA1c, eGFR, UA, and LDLC in the multivariate Cox analysis, the risk for patients with DPIsUCR <0.8 g/kg·d was reduced by 63% compared to those with DPIsUCR >1.0 g/kg·d.
Subgroup analysis
In this study, we explored heterogeneity by conducting subgroup analyses of both original and propensity score-matched cohorts. As illustrated in Fig. 3(a-b), subgroup analyses were stratified by gender, age, comorbidities, SBP, HbA1c, Alb, UACR, eGFR, DPIsUCR, and other indicators, integrating results from univariable Cox analyses (Supplementary Table 1) with clinical risk factors. Before matching, subgroups with significantly lower risks (HR < 1) included: Female patients (HR 0.70, 95% CI 0.53–0.91; p = 0.009), Age ≥ 60 years (HR 0.69, 95% CI 0.51–0.92; p = 0.012) and Alb ≥ 30 g/L (HR 0.57, 95% CI 0.40–0.80; p = 0.001). Subgroups with elevated risks (HR > 1) were: UACR ≥ 300 mg/g (HR 2.79, 95% CI 1.97–3.95; p < 0.001), eGFR 30–59 ml/min/1.73 m² (HR 1.71, 95% CI 1.23–2.23; p = 0.002), eGFR < 30 ml/min/1.73 m² (HR 5.54, 95% CI 3.79–8.10; p < 0.001) and DPIsUCR >1.0 g/kg·d (HR 1.48, 95% CI 0.91–2.41; p < 0.001). After matching, the risk associations were further refined. Protective subgroups (HR < 1) were: Female (HR 0.29, 95% CI 0.13–0.67; p = 0.004) and Alb ≥ 30 g/L (HR 0.35, 95% CI 0.15–0.82; p = 0.015). High-risk subgroups (HR > 1) were: HbA1c ≥ 7.0% (HR 2.41, 95% CI 1.09–5.31; p = 0.029), UACR ≥ 300 mg/g (HR 5.14, 95% CI 1.88–14.02; p = 0.001), eGFR < 30 ml/min/1.73 m² (HR 11.58, 95% CI 4.51–29.75; p < 0.001) and DPIsUCR >1.0 g/kg·d (HR 3.53, 95% CI 1.54–8.09; p = 0.003). Notably, male patients and those with Alb < 30 g/L, UACR ≥ 300 mg/g, eGFR < 30 ml/min/1.73 m², and DPIsUCR >1.0 g/kg·d consistently exhibited poorer prognosis in both cohorts (p < 0.05). The strengthened hazard ratios (e.g., eGFR < 30 subgroup increased from HR = 5.54 to 11.58) and narrower confidence intervals post-matching suggest improved estimation precision, reinforcing these factors as robust independent prognostic markers.
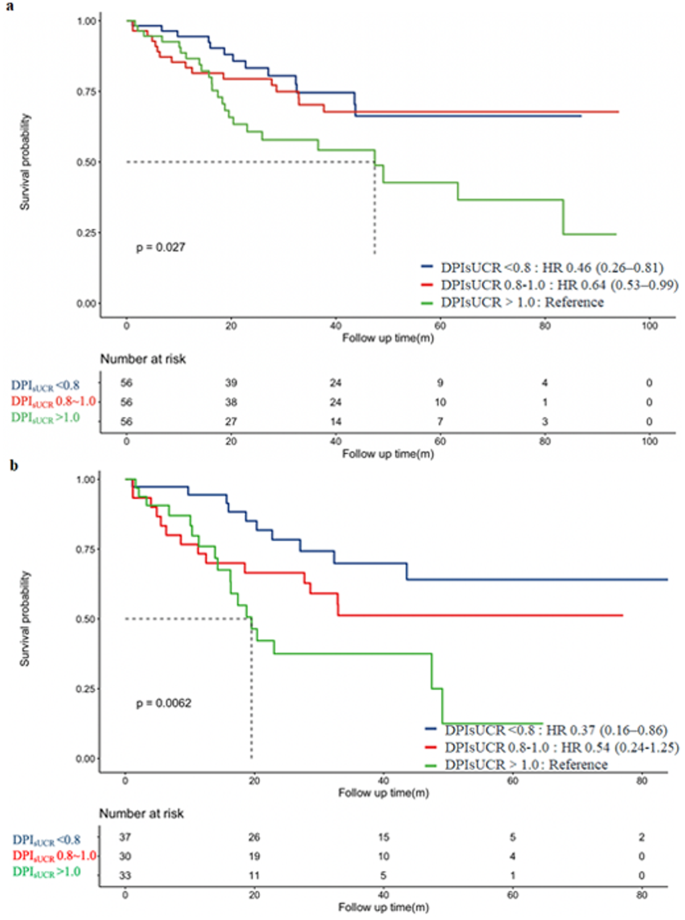
Kaplan-Meier survival curves for the Composite Endpoint, grouped by DPIsUCR levels. a: Kaplan-Meier curve for the Composite Endpoint within all T2DM with CKD patients. b: Kaplan-Meier curve for the Composite Endpoint within CKD 3 ~ 4 patients. Abbreviation: DPIsUCR dietary protein intake based on sUCR equation; T2DM type 2 diabetes mellitus; CKD chronic kidney disease
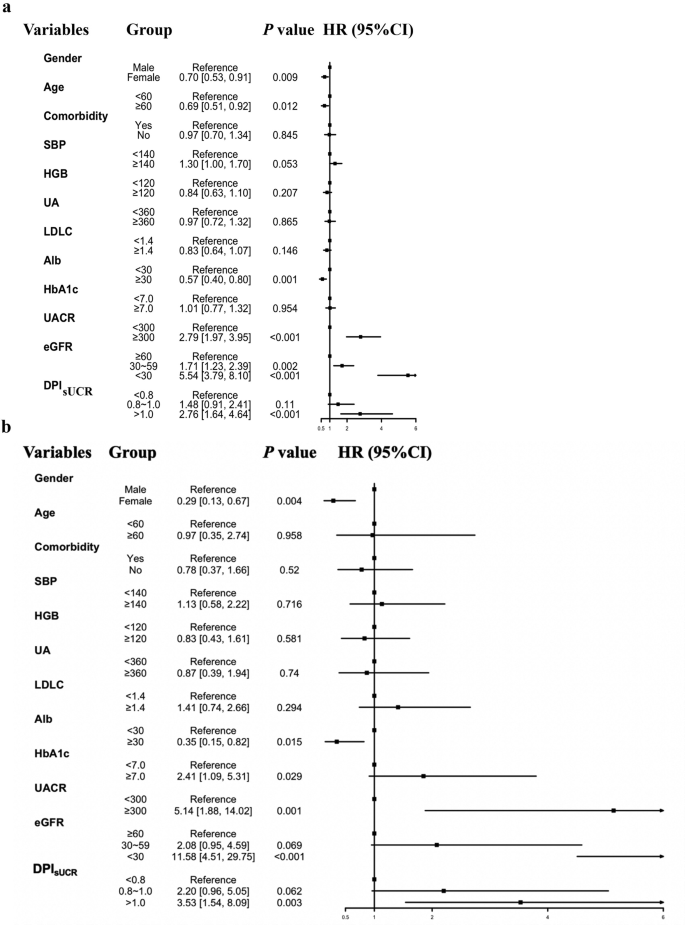
The subgroup analysis in T2DM CKD patients with DPIsUCR equation. The subgroup analyses were conducted using a stratified Cox proportional-hazards re-gression model across various subgroups. a: Subgroup analyses of primary T2DM with CKD cohort. b: Subgroup analyses of T2DM with CKD cohort after PSM. Abbreviation: SBP systolic blood pressure, HGB hemoglobin, eGFR estimated glomerular filtration rate, DPIsUCR dietary protein intake based on sUCR equation, UA uric acid, LDLC low-density lipoprotein, HbA1c, glycated hemoglobin, UACR urine albumin to creatinine ratio; T2DM type 2 diabetes mellitus; CKD chronic kidney disease; PSM propensity score matching
To balance the influence of time-related variables, we incorporated time-averaged parameters including TA-DPIsUCR and TA-eGFR into the analysis, as shown in Fig. 4(a-b). Subgroup analyses revealed distinct prognostic patterns across cohorts. In the original unmatched cohort, female sex demonstrated protective effects (HR 0.73, 95% CI 0.56–0.94; p = 0.017), while elevated risks were observed in subgroups with TA-eGFR 30–59 ml/min/1.73 m² (HR 2.18, 95% CI 1.50–3.15; p < 0.001) and TA-eGFR < 30 ml/min/1.73 m² (HR 12.28, 95% CI 8.65–17.45; p < 0.001). Following PSM, the risk stratification intensified significantly. The protective association with female sex became more pronounced (HR 0.29, 95% CI 0.13–0.61; p = 0.001). High-risk subgroups now included both TA-DPIsUCR and TA-eGFR categories: TA-eGFR 30–59 ml/min/1.73 m² (HR 3.09, 95% CI 1.25–7.68; p = 0.015), TA-eGFR < 30 ml/min/1.73 m² (HR 21.53, 95% CI 8.14–56.98; p < 0.001), TA-DPIsUCR 0.8–1.0 g/kg·d (HR 2.73, 95% CI 1.35–5.53; p = 0.022) and TA-DPIsUCR >1.0 g/kg·d (HR 3.03, 95% CI 1.17–7.83; p = 0.022). This matched analysis revealed a striking dose-response relationship between proteinuria severity (TA-DPIsUCR) and adverse outcomes, while confirming the critical prognostic value of sex and renal dysfunction (TA-eGFR) thresholds. The results from both the original and matched cohorts indicated that the prognosis was worse in the subgroup of males with eGFR < 30 ml/min/1.73 m², and DPIsUCR >1.0 g/kg·d.
Results of the NHANES cohort
Baseline data characteristics
The flowchart of enrolled patients is detailed in Supplementary Fig. 3 to show the inclusion process before PSM. This study initially screened 101,316 patients and excluded 99,593 patients, consisting of 43,737 patients who were younger than 18 years or older than 80 years, 3,545 patients with incomplete weight and height data, and 3,399 patients with incomplete urea nitrogen or creatinine values. Additionally, 48,392 patients were excluded due to missing 24-hour dietary review data or having two dietary protein intakes at the same level, 173 patients with an eGFR < 15 ml/min/1.73 m² or who had started dialysis at enrollment, and 347 patients who died of malignant tumors. Ultimately, 1,723 patients were included in the analysis.
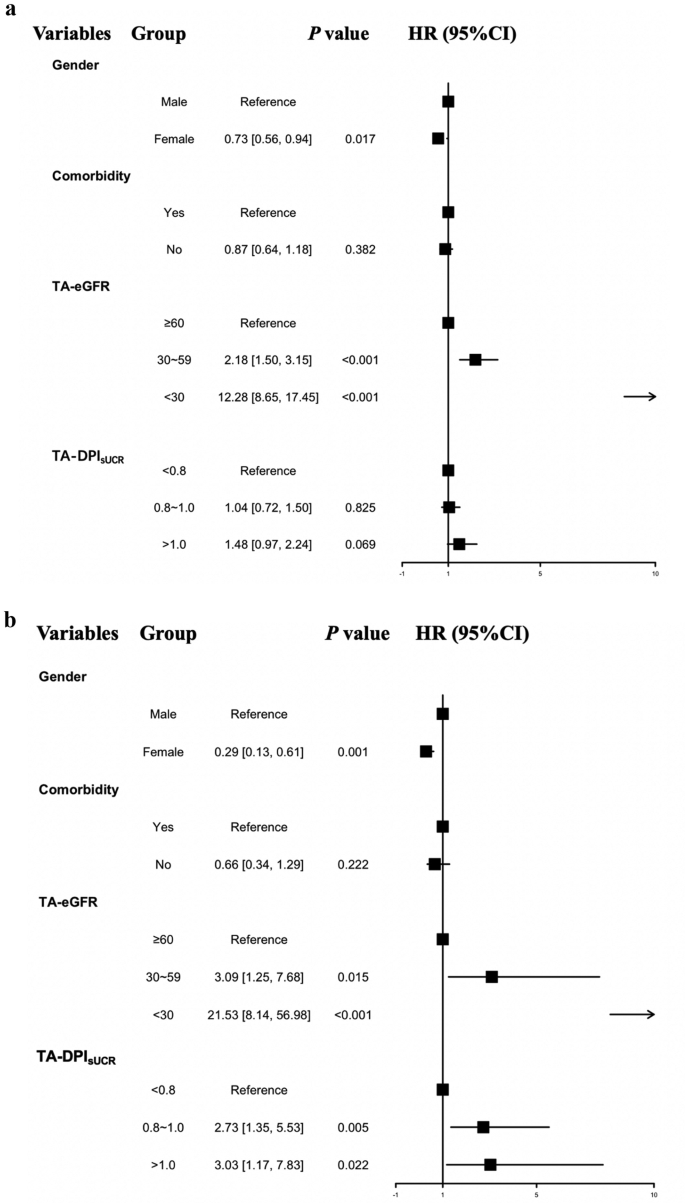
Time-average subgroup analysis in patients with T2DM with CKD with the DPIsUCR equation. a: Time-average analyses of the primary T2DM with CKD cohort. b: Time-average analyses of the T2DM with CKD cohort after PSM. Abbreviation: TA-DPIsUCR time average dietary protein intake based on sUCR equation; TA-eGFR time average esti-mated glomerular filtration rate; T2DM type 2 diabetes mellitus; CKD chronic kidney dis-ease; PSM propensity score matching
Participants were grouped based on their DPIsUCR levels, with 694, 811 and 218 patients in three groups respectively. After an average follow-up period of 87.63 months, a total of 489 patients reached the observation endpoint (heart diseases, cerebrovascular diseases and all-cause mortality), which included 190 patients with heart disease and 29 patients with cerebrovascular disease as the cause of death.
PSM analysis of the NHANES cohort
As shown in Supplementary Fig. 4, variables matched among the three dietary regimen groups included key clinical characteristics such as sex, age and baseline SCr. The balance of these characteristics across the three groups was assessed using a multi-balance test.
After matching, a total of 390 patients were included in the final analysis. With an average follow-up period of 87.19 months, 121 patients reached the study endpoint, including 46 patients developed heart disease, 6 patients experienced cerebrovascular events, and the rest with other causes. The enrollment process is detailed in Fig. 5.
In the original cohort, significant differences in baseline characteristics such as gender, age, and eGFR were observed among the three groups. However, after matching, these differences were balanced, as detailed in Table 2. For example, the baseline ages of the three groups were [73.00 (66.00, 78.75) vs. 72.50 (65.25, 79.00) vs. 73.00 (65.00, 80.00) years, P = 0.925], and baseline renal function (eGFR) values were [52.03 (44.62, 57.23) vs. 52.17 (42.70, 57.53) vs. 51.69 (39.69, 59.18) ml/min/1.73 m², P = 0.995]. Other baseline characteristics also showed balance.
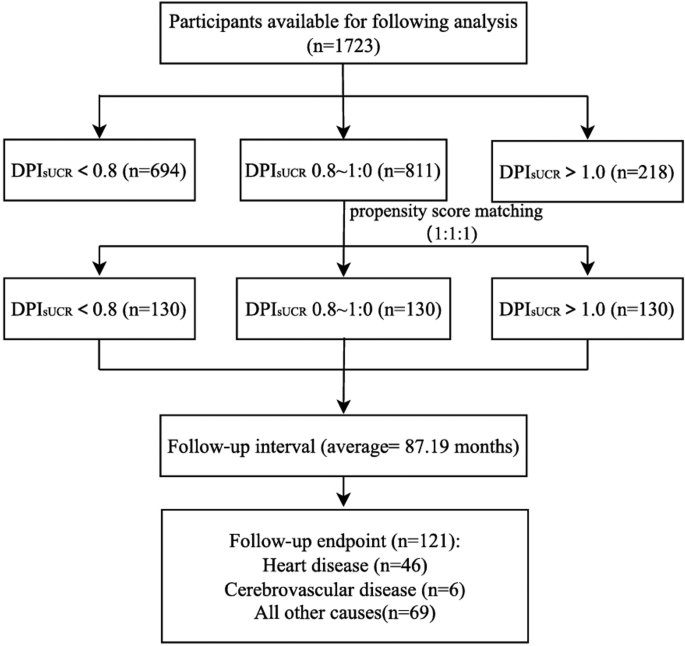
Flowchart of the NHANES enrolled participants after propensity score matching. Abbreviation: DPIsUCR dietary protein intake based on sUCR equation
Real-world prognosis analysis of DPIsUCR equation in CKD 1 ~ 4 patients
In the matched cohort, Kaplan-Meier survival analysis was applied to evaluate the relationship between different DPIsUCR levels and all-cause mortality. As shown in Fig. 6a, patients in the restricted protein diet group (DPIsUCR < 0.8 g/kg·d) exhibited a better survival curve compared to those in the higher protein intake group (DPIsUCR > 1.0 g/kg·d). Specifically, in patients with CKD stage 3 (Fig. 6b), the survival curve of the restricted protein group (DPIsUCR < 0.8 g/kg·d) was significantly better than that of the higher protein intake group (DPIsUCR > 1.0 g/kg·d) over time. However, in CKD patients with diabetes (Fig. 6c), although the survival curve of the restricted protein group appeared better, the difference did not reach statistical significance.
To further validate the robustness of these findings, univariate Cox regression analysis was performed on the cohorts before and after matching as presented in Supplementary Table 2. Before matching, patients with DPIsUCR < 0.8 g/kg·d had a 63% reduction in all-cause mortality compared to those with DPIsUCR > 1.0 g/kg·d. After adjusting for confounding factors such as age, sex, smoking history, diabetes status, SBP, HbA1c, Alb, UA, CHOL and HDLC, the mortality reduction was 47% for patients with DPIsUCR < 0.8 g/kg·d compared to those with DPIsUCR > 1.0 g/kg·d.
In the matched cohort, after correcting for variables such as age, sex, smoking history, HbA1c, eGFR, UA, and HDLC, patients with DPIsUCR < 0.8 g/kg·d had a 50% lower risk of all-cause mortality compared to those consuming more than 1.0 g/kg·d of dietary protein.
The prognostic analysis of different DPI in CKD patients with DPIsUCR equation. a: Kaplan-Meier curve for the Composite Endpoint within all CKD patients. b: Kaplan-Meier curve for the Composite Endpoint within CKD stage 3 patients. c: Kaplan-Meier curve for the Composite Endpoint within DKD patients. Abbreviation: DPIsUCR dietary protein intake based on sUCR equation