This research employed a cross-sectional design, using secondary data from the most recent 2022 Tanzania Demographic Health Survey (TDHS) dataset. The Demographic Health Survey (DHS) is nationally representative carried out every five years in over 85 low- and middle-income countries globally [21]. Participants in the survey are selected through a multistage sampling process. The methodology employed in the 2022 TDHS is present at https://www.dhsprogram.com/publications/publication-fr382-dhs-final-reports.cfm?cssearch=1811439_1[21].
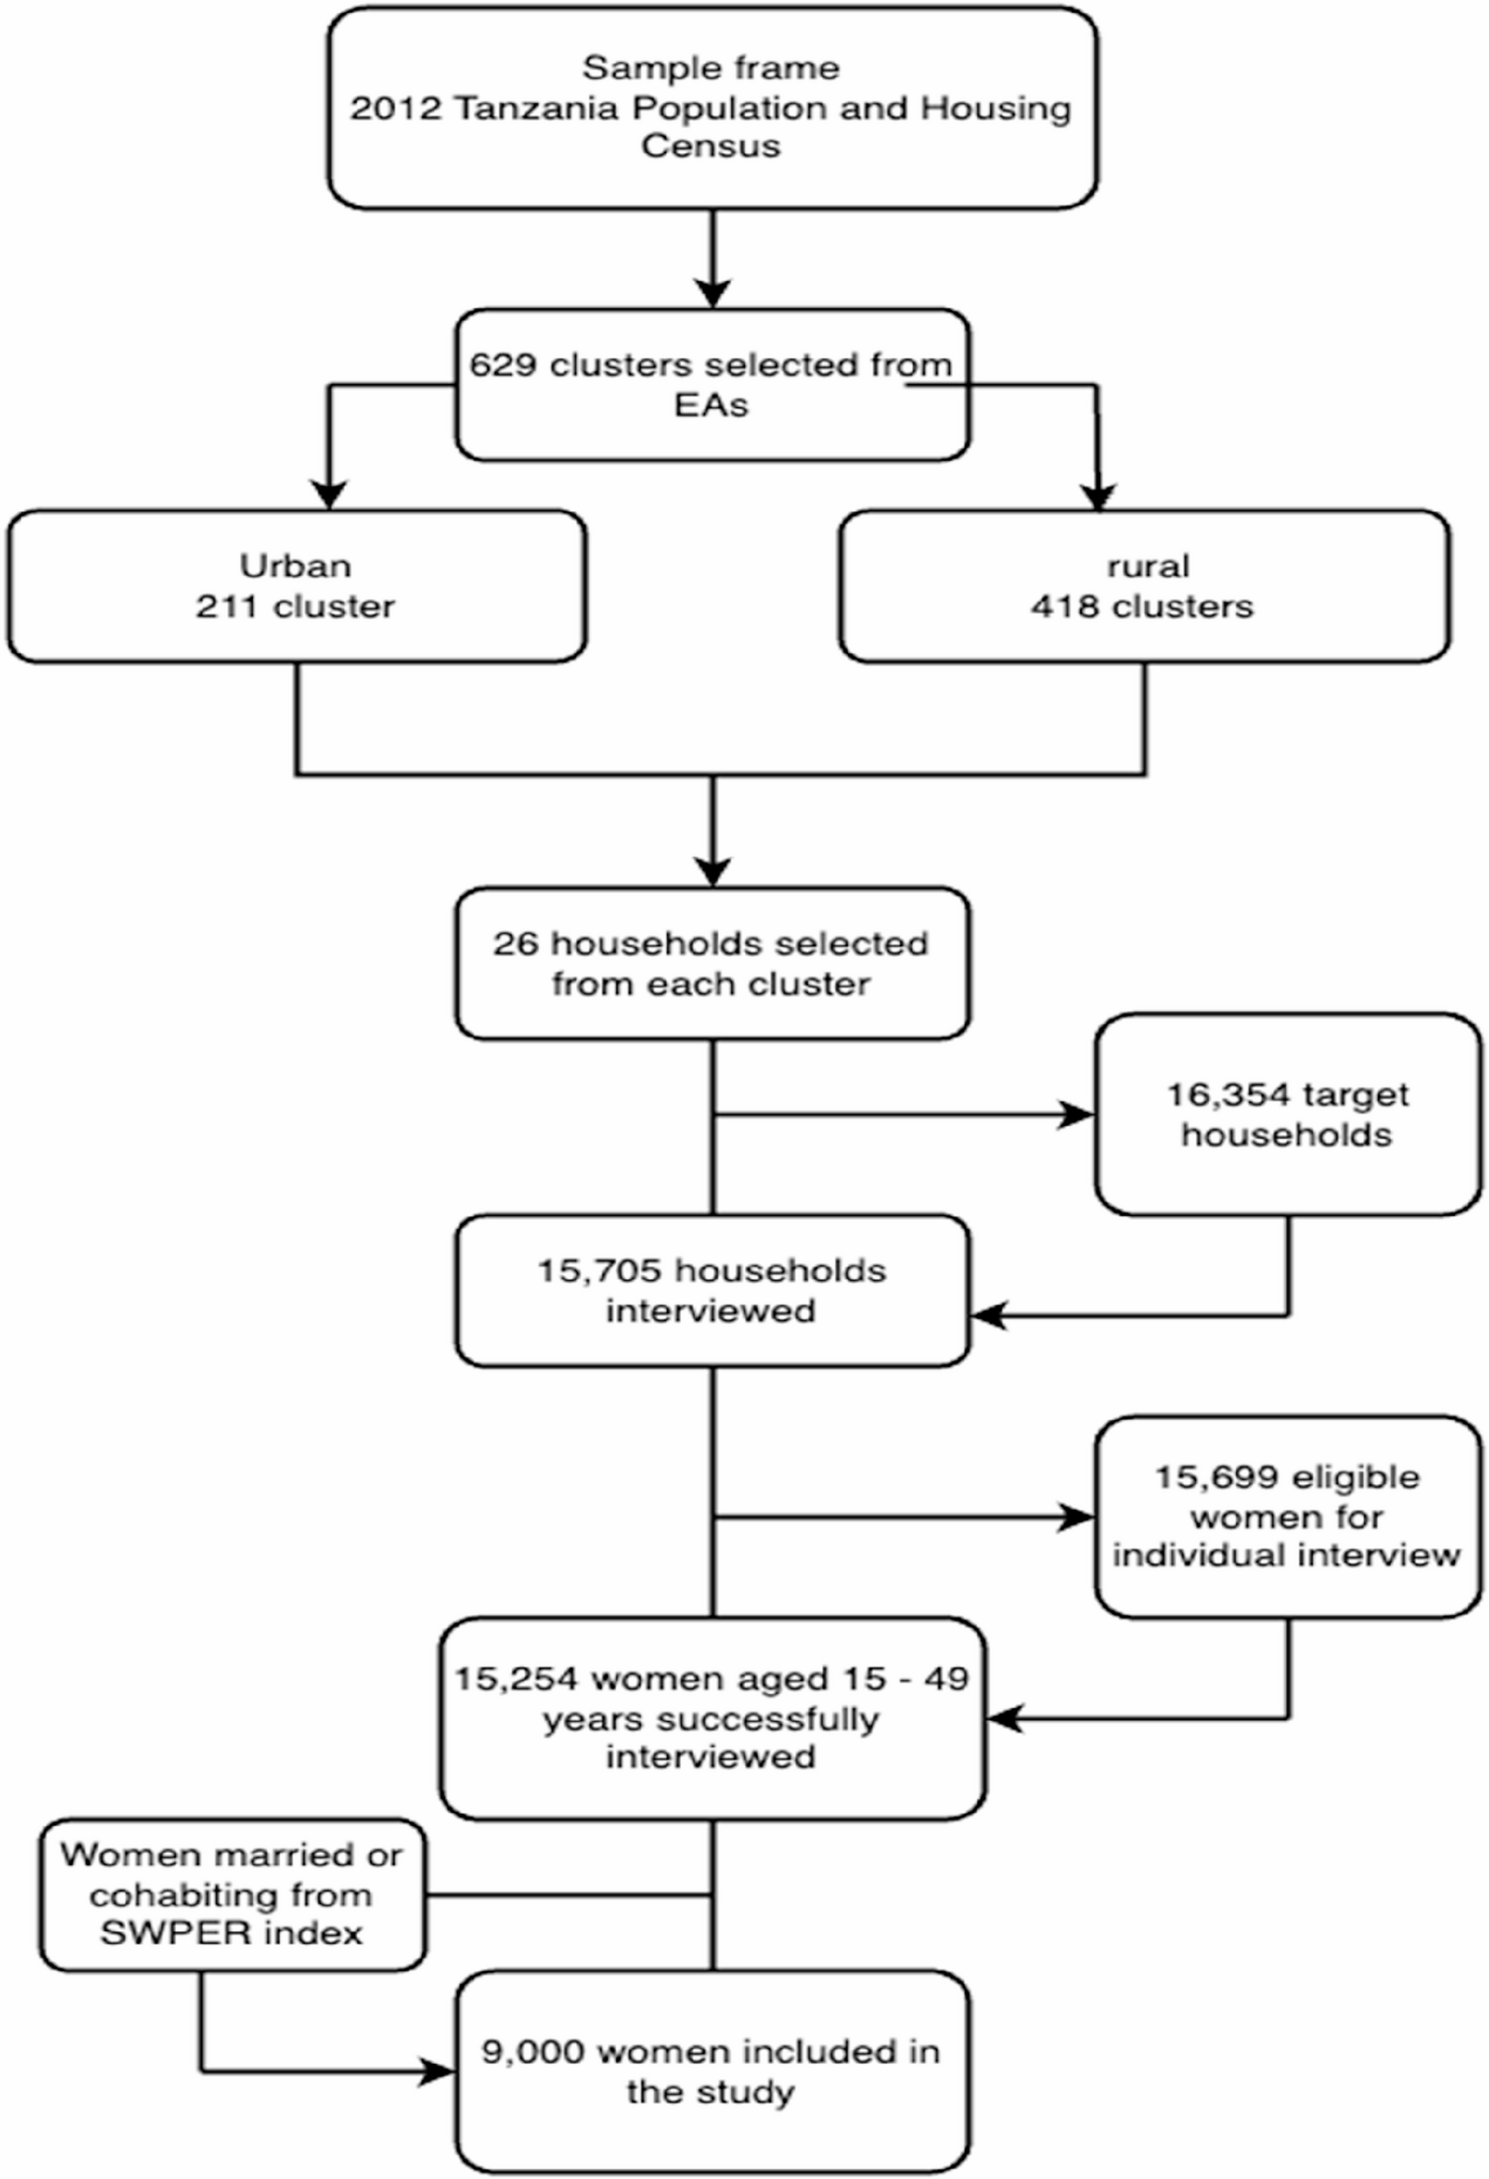
A total of 15,254 eligible women age 15–49 years from 15,705 households were successfully interviewed. The survey had a response rate of 97%. For the purpose of this study, only women who were married or cohabiting were included. This was because the Survey-based Women Empowerment (SWPER) Global required primarily women who were cohabitting or married to create the empowerment scale [22]. This brought the final sample size for the study to 9000 women age 15–49 years.
The detail description of the methodology used for the 2022 TDHS is freely available in the DHS website (https://www.dhsprogram.com/publications/publication-FR382-DHS-Final-Reports.cfm) [21]. Figure 1 shows a summary of the sampling process in a flow chart.
Sampling process used in this study
Data Collection and Data Collection Instrument
This study’s data is obtained from the responses in the woman’s questionnaire. The Woman’s questionnaire or also called the individual questionnaire collected data on maternal and child health issues, including but not limited to background characteristics (age, marital status, education, exposure to media, etc.), child birth and mortality history, family planning use and knoweldge, etc.
The SWPER (Survey-based Women’s emPowERment) Global Index is created using 14 questions from the woman’s individual questionnaire in the Demographic and Health Surveys (DHS) [22, 23]. These questions are grouped into three domains of women’s empowerment:
-
(1)
Social Independence: Access to information (frequency of reading newspapers or magazines), Educational attainment, Age at marriage, Age at first child, Differences in age and education between the woman and her cohabiting partner.
-
(2)
Decision-Making: Who makes decisions in the household on large purchases, Who makes decisions about the woman’s health care, Who makes decisions about visits to family or relatives, and Whether the woman worked in the previous year.
-
(3)
Attitudes to Violence: Woman’s opinion on whether a husband is justified in beating his wife in specific situations (e.g., leaving the house without telling the husband, neglecting the children).
These variables are combined using principal component analysis (PCA) to create the SWPER Global Index.
Study variables
Outcome variable
The focus of this study is on the unmet needs for FP among women age 15–49 years in Tanzania. Unmet needs for family planning is described as a fecund woman, who are sexually active and wishes to either space their birth or limit the number of children but are not using any modern contraceptive method [24]. These unmet needs are categorized into two distinct measures:
Unmet Need for Spacing: This refers to fertile women who wish to space their births but are not currently using any modern contraceptive methods.
Unmet Need for Limiting Births: This pertains to fertile women who do not desire any more children but are not using any modern contraceptive methods.
The primary outcome variable for this study is the unmet need for FP, (coded as 0 = no unmet for FP and 1 = unmet for FP), which includes both the unmet needs for spacing or need for limiting births. This outcome variable is not directly listed in the DHS dataset. It was obtained by recoding of data on family planning use among the women. The recoding process is available at https://github.com/DHSProgram/DHS-Indicators-Stata/tree/master/Chap07_FP.
Explanatory variables
The primary explanatory variable in this study is women’s empowerment, measured using the SWPER Global index. This index is a meticulously crafted measure of women’s empowerment, derived from the Demographic and Health Surveys (DHS) data for 62 low- and middle-income countries [20, 23]. The SWPER Global index encompasses three key domains:
Attitude Towards Violence: This domain evaluates a woman’s opinion on whether a husband is justified in beating his wife in specific situations.
Social Independence: This domain assesses a woman’s access to information, attainment of a desirable educational level, age at marriage and first childbirth, and the differences in age and education between the woman and her cohabiting partner.
Decision Making: This domain measures who makes decisions in the household and whether the woman is employed.
Women are categorized into low, medium, and high empowerment levels based on the cutoff points defined in the SWPER Global methodology. The comprehensive design of this index is detailed by Ewerling and colleagues. The STATA do-file for calculating the SWPER index is available at https://goo.gl/isGonn [22].
The study also included covariates that is used to control for the primary explanatory variables. These covariates are obtained are significant variables associated with unmet needs for FP in previous studies [4, 25,26,27,28,29,30]. These variables were categorized into individual level variables and community level factors. Some of the community level variables we aggregated individual responses within each cluster, or “community,” and used the average response for categorization [31].
Community-level variables were generated by aggregating individual responses within each primary sampling unit (PSU), which served as a proxy for “community”. For continuous variables such as educational attainment or wealth index, we calculated the mean or proportion within each cluster. We then created binary indicators for each community-level variable using the following rule:
Educational attainment (community level): The average number of years of education among women in the cluster was calculated. Women living in clusters above the national mean were coded as “high education community” and those below as “low education community”.
Wealth index (community level): Using the DHS wealth quintile scale (1 = poorest to 5 = richest), we computed the average wealth index per cluster. Communities with a mean index ≥ 3 (middle or above) were classified as “high wealth”; <3 were “low wealth”.
Knowledge of family planning (FP): Proportion of women in a cluster who knew at least one modern contraceptive method. Clusters with ≥ 50% of women reporting FP knowledge were classified as “high knowledge”.
Exposure to FP messages: Defined by the proportion of women in the cluster who reported exposure to family planning messages via radio, newspapers, or any media. Communities with ≥ 50% were labeled “high exposure”.
All thresholds (e.g., national mean, ≥ 50% cut-off) were selected based on literature precedence and practical distributional cut-points in DHS-based studies [31].
For instance, suppose in one cluster, the average years of education is 8 years. If a woman’s education level is below 8 years, she is coded as part of a “low-education” community. If her education level is 8 years or higher, she is coded as part of a “high-education” community. Again, let’s say the average wealth index in a community is 2.5 on a scale of 1 to 5, where a lower score indicates lower poverty. If a woman’s wealth index is 2.6 or higher, she is in a “high wealth” community. If her index is below 2.5 or lower, she falls into a “low-wealth” community.
Table 1 shows each of the study variables and how they are coding.
Conceptual framework and assumptions
To guide our model specification and clarify hypothesized relationships, we developed a conceptual model (Fig. 2). This figure represents our theoretical assumptions regarding the directionality and potential confounding or mediating relationships among variables influencing unmet need for family planning.
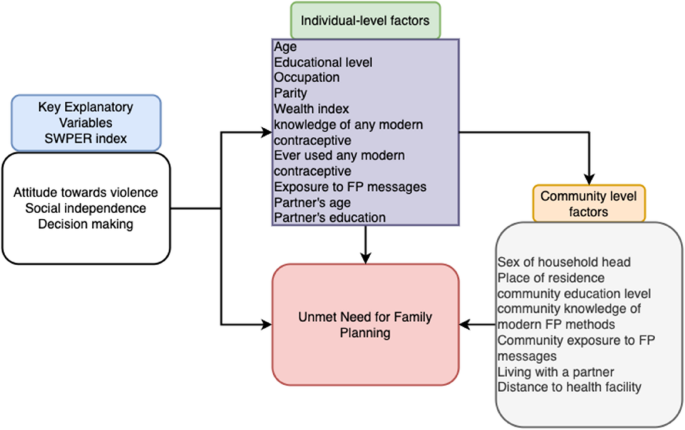
Conceptual framework for study
Data analysis
The data for this study was downloaded in STATA statistical analysis format and the data analysis performed in four stages using STATA version 18 statistical software, with sampling weights from the DHS data applied to adjust for the sampling design.
In this first stage, we generated a descriptive summary of the variables, including frequency distributions for the sociodemographic characteristics of the women, the unmet needs for FP and SWPER domains.
In the second stage of the analysis, Pearson’s chi-test was used to test for association between unmet needs for FP and the primary explanatory variables and covariates. Statistical significance was set at p < 0.05.
In the third stage of the analysis, explanatory variables, which were statistical significantly associated with unmet needs for FP, were included in a regression model to test for multicollinearity using variance inflation factor (VIF). Variables found with vif of 5 or more were excluded from the next stage of the analysis [32].
In the final stage of the analysis, a mixed-multilevel logistic regression analysis was conducted to identify women empowerment and its association unmet needs for FP. Five regression models were created. The first model (null model) was fitted without explanatory variables to test the random variability in the intercept and show the total variance in the unmet needs for FP among women in different communities. The second model (Model I) fitted women empowerment domains to test the effect of women empowerment on unmet needs for FP. In the third model (Model II), the individual-level factors were also fitted to examine their effect on unmet needs for FP. The Model III examined the effect of community-level factors on unmet needs for FP. The final model (Model IV) examined the combined effect of all statistically significant (p < 0.20) explanatory variables in the preceding models on unmet needs for FP among the women.
Fixed-effect results were reported as odds ratios with 95% confidence intervals. The Intraclass Correlation Coefficient (ICC) was calculated for each model to quantify the proportion of variation attributable to higher-level clustering and to facilitate comparisons between models.
In the analysis, the ’svy’ command in STATA was used to allow for adjustments for the cluster-sampling design of the data collection and weights. This was also done to account for selection bias in the study. The “melogit” STATA command was also used for the logistic regression, “estat icc” for the intra-class correlations and “estat ic” for the information criterions (Akaike Information Criterion (AIC) and Bayesian Information Criterion (BIC)).
Missing data
The data were cleaned by checking and correcting all inconsistencies and discrepancies. Also, missing data were handled by STATA’s default listwise deletion method.
Ethical consideration
The data used in this study were secondary and publicly accessible, therefore individual consent was not required by the ICF International Institutional Review Board. This study proceeded with the necessary permissions from the DHS Program, and all data were carefully managed to ensure privacy during the processing and analysis stages of the study.