Patient characteristics
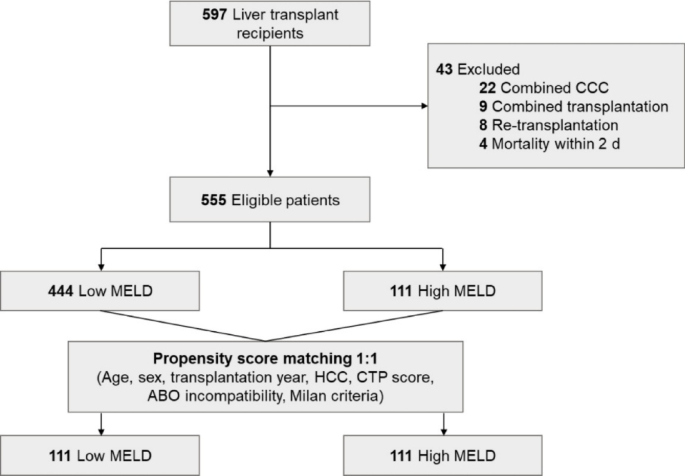
Among the 555 eligible patients, 444 were in the low MELD group and 111 in the high MELD group (Fig. 1). After propensity matching, 111 patients from each group were paired, with characteristics well balanced except for factors inherently different between low and high MELD patients, such as CTP score, ascites, encephalopathy, living-donor LT, and cold ischemic time.
Flowchart of the study population. CCC, cholangiocarcinoma; MELD, model for end-stage liver disease; HCC, hepatocellular carcinoma; CTP, Child–Turcotte–Pugh.
The median patient age was 54 years (interquartile range [IQR]: 47–61 years), and 60.8% of the patients were male (Table 1). No significant differences in underlying liver diseases or comorbidities were found between the two groups. The MELD scores were 15.0 (IQR: 10.5–20.0) and 40.0 (33.0–40.0) in the low and high MELD groups, respectively.
Living-donor transplantation was more frequent in the low MELD group than in the high MELD group (97.3% vs. 36.9%; p < 0.001). The mean donor age was significantly higher in the high MELD group than in the low MELD group (35.5 ± 11.9 vs. 46.4 ± 16.1 years; p < 0.001). No significant differences were observed between the two groups regarding ABO incompatibility, desensitization medications, low GRWR, and the proportion of patients meeting the Milan criteria.
Mortality and infectious complication rates were significantly higher in the high MELD group compared to the low MELD group. The overall mortality rate was 9.0% and 29.7% in the low and high MELD groups, respectively. The median follow-up duration for the low and high MELD groups was 942.0 (IQR: 626.0-1616.5) and 655.0 (IQR: 174.0-1487.5) days, respectively (p = 0.002). Infectious complications, including 1-year BSI, CMV infection, and IPA, were significantly more frequent in the high MELD group compared to the low MELD group.
Dynamics of Immunoglobulin G levels
IgG levels were measured before and after transplantation to assess dynamics according to the MELD score. In the overall population, the median IgG level before transplantation was 1,606.5 mg/dL (IQR: 1,124.6–2,149.0; Table 2 and Figure S1). One month after transplantation, the median IgG level significantly decreased to 1,011.6 mg/dL (IQR: 733.4–1,387.1) (p < 0.001). At 6 months and 1 year, the median IgG levels were 1,070.5 mg/dL (IQR: 780.4–1,566.4) and 1,117.5 mg/dL (IQR: 799.6–1,403.1), respectively. These levels were higher than at 1 month, but the differences were not significant (p = 0.151 and 0.172, respectively).
Before transplantation, HGG occurred in 4.5% of LT recipients. One month after transplantation, the incidence of HGG increased to 21.4%. At 6 months and 1 year, the incidence rates of HGG were 16.3% and 14.5%, respectively. Overall, 36.0% of patients developed HGG within 1 year after transplantation.
We compared IgG levels between the low and high MELD groups before and after transplantation. Serum IgG levels were not significantly different between the two groups at any time point before transplantation or at 1 month, 6 months, and 1 year after transplantation (Figure S1). The incidence of HGG was also not significantly different between the groups.
We further analyzed the IgG dynamics and incidence of HGG in LT recipients who did not receive rituximab as induction therapy (Table S1). The median IgG levels decreased the least at 1 month post-LT and gradually increased thereafter, showing dynamics similar to the entire cohort. Within 1 year, 35.4% of patients developed HGG.
We also evaluated IgG dynamics according to the severity of PSS. Pre-LT IgG levels showed a increasing trend with higher PSS severity, but this was not statistically significant (Table S2 and Figure S2). Additionally, the occurrence of pre-LT hypergammaglobulinemia (IgG > 1600 mg/dL) also increased across no, mild, and severe PSS groups (43.2%, 52.7%, and 56.4%, respectively), without statistical significance (p = 0.287). After transplantation, no notable trends related to PSS severity were observed in IgG levels.
Effect of HGG on clinical outcomes
Cox regression analysis was performed for mortality, BSIs, and CMV infections to determine the effect of HGG on clinical outcomes. The univariable analysis identified HGG before transplantation (HGGpre) as a significant risk factor for mortality (hazard ratio [HR] 4.06; 95% confidence interval [CI] 1.75–9.43; p = 0.001), whereas HGG at 1 month (HGG1mo) was not significantly associated with mortality (HR 0.90; 95% CI 0.37–2.18; p = 0.810; Table 3). Multivariable analysis was performed using a high MELD score, donor age, sex, BMI, living-donor transplantation, rituximab use, and number of RBC transfusions as confounders. After adjustment, HGGpre was significantly associated with mortality (adjusted HR [aHR] 2.82; 95% CI 1.10–7.20; p = 0.030).
In the univariable analysis, HGG1mo after transplantation was significantly associated with BSI (HR 2.19; 95% CI 1.08–4.45; p = 0.030), whereas HGGpre was not (HR 2.15; 95% CI 0.89–5.23; p = 0.090; Table 4). However, in the multivariable analysis, no significant association was observed between HGG1mo and BSI (aHR, 1.46; 95% CI 0.53–4.06; p = 0.463). Regarding CMV infection, HGGpre was significantly associated with increased risk in the univariable analysis (HR, 3.04; 95% CI, 1.15–8.06; p = 0.026; Table S3), whereas HGG1mo was not (HR, 1.31; 95% CI, 0.48–3.61; p = 0.602). HGGpre remained a significant risk factor for CMV infection in the multivariable analysis (HR, 2.96; 95% CI, 1.30–6.72; p = 0.009).
Kaplan–Meier curves also showed that HGGpre was associated with decreased survival compared to patients with no HGG (p = 0.002; Fig. 2). Further stratification was performed according to the HGGpre and MELD groups. The Kaplan–Meier curve showed a significant survival difference among the four groups (p < 0.001; Figure S3), with patients with HGGpre and a high MELD score having the worst prognosis, followed by patients with HGGpre and a low MELD score, no HGGpre and a high MELD score, and no HGGpre and a low MELD score.
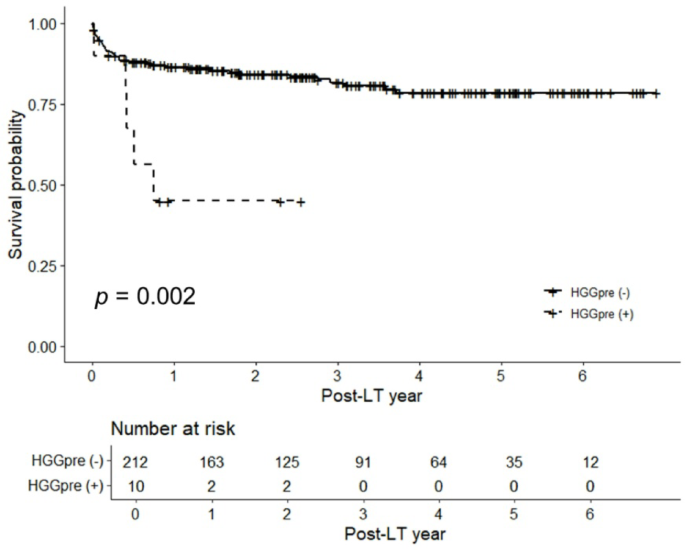
Kaplan–Meier curves of the overall survival rates after liver transplantation according to pre-transplantation hypogammaglobulinemia. HGG, hypogammaglobulinemia.
Risk factors for HGG in LT recipients
The risk factors for HGG before and after LT were investigated using logistic regression. A history of diabetes was identified as a risk factor for HGGpre (odds ratio [OR] 4.73; 95% CI 1.27–22.47; p = 0.028; Table S4). Risk factors for HGG1mo were GRWR < 0.8 (OR 5.40; 95% CI 1.51–20.17; p = 0.009) and steroid pulse therapy within 1 month after LT (OR 3.67; 95% CI 1.67–8.02; p = 0.001).