In a large case-control study with thorough control of major confounders, we did not observe associations between lung cancer risk and air pollution values estimated as annual average for the year 1990, i.e., 12–15 years before diagnosis. Comparable findings were confirmed in the subgroup of never and former smokers. On the other hand, previously reported results in the same population had suggested an increased risk for exposures closer in time to the year of diagnosis (i.e., 2000)16. We further confirmed this difference not only by comparing the results from the two years but also by considering the two exposures combined, mutually adjusting for one another.
The observed differences might be related to several factors. First, distinct methodologies were used to estimate exposure: FARM chemical transport model was used to estimate PM10 in 199021 while PM10 estimates for the year 2000 were derived from a hybrid spatial-temporal model27. Second, the granularity of 1990 exposure estimates was coarser than in 2000. For this reason, we rescaled the spatial resolution of exposure estimates in 2000 to a coarser definition (3 × 3 km) and obtained results that were comparable to those from the old analysis. Third, dissimilar levels in pollutant concentrations in the two time periods might also justify the observed difference in air-pollution related lung cancer risk, although the direction of the association is counterintuitive: if we compare PM10 concentration levels, we observe that the average pollutant levels in 1990 were 46% higher than in 2000. This phenomenon is particularly evident in the Milan area, where PM10 levels markedly decrease in the timespan we are considering. Fourth, we might look at our results within the greater framework of tumorigenesis, which was proposed to occur as a two-step process: i.e., the first one inducing mutations in healthy cells, and the second one triggering cancer development32. Our results might thus support a greater relevance of more recent exposures, especially when considering the two exposures combined. To this regard, it is interesting to note that a recent paper by Hill and colleagues provided combined results from a plethora of observational, in vivo, and in vitro studies to support the hypothesis that “environmental particulate matter measuring ≤ 2.5 µm […] promotes lung cancer by acting on cells that harbour pre-existing oncogenic mutations in healthy lung tissue”33. In addition, in one of the studies they performed on about 250 female lung cancer cases, they observed an association with lung cancer risk when considering 3-year PM2.5 cumulative exposure, while this association was not evident after 20-year exposure to the same pollutant.
Several other studies investigated the association between long-term air pollution exposure and lung cancer. Starting from the studies evaluated by the IARC, Hamra et al. conducted a large meta-analysis including 18 studies from different countries in Europe and North America. Data on PM10 were available for nine studies (five in North America, three in Europe and one in New Zealand). Overall, a positive association was observed for PM10 (RR: 1.08; 95% CI: 1.00-1.17), with mean levels ranging from 8.3 to 51 µg/m11. Looking in more detail at the three studies conducted in Europe,
the Multicenter ESCAPE study investigated the effects of long-term PM10 exposure on lung cancer incidence, using data from 14 cohorts. The enrollment years ranged from 1985 to 2005. Air pollution concentrations at the baseline residential addresses of the study subjects were back-extrapolated using land-use regression models applied to pollution data collected between 2008 and 2011 (i.e., after the study period). Back-extrapolated PM10 levels ranged from about 5 to 90 µg/m3, with the highest levels estimated in Italy and Greece. The pooled analysis showed an association between the risk of lung cancer and increasing PM10 concentrations (HR: 1.22; 95% CI: 1.03–1.45 per 10 µg/m3)34.
The English study followed up a national cohort from 2003 to 2007 and observed positive associations for an interquartile range (IQR) increase in PM10 (HR: 1.03; 95% CI: 0.98–1.08), using exposure data in 2002 (1–5 years before death) and adjusting for smoking status, cigarettes/day and income35. PM10, estimated from emission-based models, ranged from 12.6 to 29.8 µg/m3.
The mortality of a small cohort of women enrolled between 1985 and 1994 was examined through 2008 in Germany. PM10 in the years 1985–1994 was derived from total suspended particles (TSP, applying a coefficient of 0.71) measured by fixed monitoring sites. An increase of 7 µg/m3 in PM10 was associated with an increased HR of 1.84 (95%CI: 1.23–2.74), in models adjusted for education and smoking status36.
Among the five US studies included in the meta-analysis by Hamra and colleagues, the Adventist Health Study on Smog (ASHMOG) followed up for cancer incidence (1977–1992) a large cohort of 6,338 non-smoking Californian adults. PM10 levels were derived from TSP from 1972 to 1987 and subsequently directly measured through fixed-site monitoring stations. PM10 ranged from 0 to 85 µg/m3 with mean values of 51.0 µg/m3. Incident lung cancer in males was positively associated with an IQR increase (24 µg/m3) in PM10 mean concentrations (RR: 5.21, 95%CI: 1.94–13.99, adjusted by cigarette pack-years, education, and alcohol)37.
A cohort study performed by the American Cancer Society within the Cancer Prevention Study (ACS-CPS-II) examined the association between air pollution and mortality among over 400,000 people enrolled in 1982–1998. Mean PM10 concentration derived from fixed monitoring stations in the enrollment period was 28.8 µg/m3. Unfortunately, numerical results for PM10 were not available, and a relative risk slightly greater than 1.00 in the period 1987–1996 (with 95%CI including the null value) could be derived only by looking at one of the paper figures38.
The association between PM10 exposure and cancer mortality (1985–2000) was investigated in about 40,000 workers employed in the U.S. trucking industry. PM10 annual average exposures were determined for 1985 through 2000 from a model using spatial smoothing and geographical information system-based covariates. The average exposure during the study period was 26.8 µg/m3. A HR for lung cancer of 1.08 (95%CI: 0.91–1.30) was estimated per 10 µg/m3. No data on smoking were available39.
The California teachers Study (TCS) involved a large cohort of women followed up for mortality (1997–2005)40. Monthly average PM10 concentrations were calculated from fixed-site monitors for the period 1996–2005. PM10 estimates ranged from 9.19 to 82.64 µg/m3 (mean: 29.21). The HR per 10 µg/m3, adjusted for smoking status, pack-years, body mass index, alcohol, passive smoking, dietary fat, fiber and calories, was 0.93 (95%CI: 0.81–1.07).
The relationship between lung cancer incidence and long-term residential exposure to PM10 was also evaluated within the Nurses’ Health Study, another large cohort of women followed up from 1994 to 201041. PM10 ranged from 3.17 to 74.79 µg/m3. Exposure was defined as the time-varying cumulative PM10 average experienced in the previous 72-months. The HR per 10 µg/m3, adjusted for income, (active and passive) smoking and dietary variables, was 1.04 (95%CI: 0.95–1.14).
Finally, in the New Zealand Census-Mortality study, records from the 1996 national census were probabilistically linked to mortality data (1996–1999)42. Average PM10 exposure at 1996 census were estimated using land use regression models and ranged from 0 to 30 µg/m3. The OR per 10 µg/m3 of PM10, adjusted for ethnicity, social deprivation, income, education, and smoking status was 1.14 (95%CI: 1.05–1.23) among subjects who had not changed residence since 1991.
In summary, the abovementioned studies return a heterogeneous picture, where different time windows of exposure are investigated, concentration levels cover a quite wide range of values, and results are often characterized by some uncertainty, notwithstanding the overall interpretation of the findings that point towards an increasing trend in risk.
Following the IARC evaluation other studies were published.
The Nation-wide Dutch Environmental Longitudinal Study (DUELS) examined the mortality (2004–2011) of a cohort of more than 7 million subjects43. Applying land-used regression models, annual mean PM10 concentrations in 2001 were derived. The median PM10 concentrations was 29 µg/m3. The HR, adjusted for age, sex, marital status, region of origin, household income, per 10 µg/m3 increase in PM10 was 1.26 (95%CI: 1.21–1.30). No information on smoking and diet was available.
In a multi-cohort Swedish study, high-resolution dispersion models were used to estimate annual mean concentrations of PM10 at individual address during each year of follow-up (1990–2011), and moving averages were calculated for the time-windows 1–5 years and 6–10 years preceding the outcomes of interest (i.e., natural and cause-specific deaths). No associations were observed between PM10 exposure (range: 6.3–41.9 µg/m3) and lung cancer mortality, in models adjusted for sex, calendar year, sub-cohort, smoking status, alcohol consumption, physical activity, marital status, socioeconomic status, educational level, and occupation44.
Moving to lung cancer incidence, several studies were conducted in South Korea. A large cohort study included more than 6.5 million subjects from the Korean National Health Insurance Service (NHIS) database for 2006–2007, who were linked to Korea Central Cancer Registry data to confirm lung cancer incidence for 2006–2013. Individual exposure to PM10 was assessed as five-year average concentrations predicted at subjects’ district-specific home addresses for 2002–2007 via a geo-statistical model (mean: 55.8 µg/m3). An increased risk in lung cancer incidence (comparing the upper vs. the lower quartile of exposure) was estimated only for adenocarcinoma in current male smokers (HR: 1.14, 95%CI: 1.03–1.25, in models adjusted for age, gender, income, BMI, pack-year, history of COPD, interstitial lung disease, lung disease due to external factor, physical activity and alcohol consumption)45. Another NHIS-based study was conducted in the Seoul metropolitan area, where about 83,000 people were followed up for 2007–2015. PM10 exposure was estimated predicting district-specific annual-average concentrations (mean: 56.2 µg/m3). HRs for lung cancer incidence ranged from 1.05 (95%CI: 0.81–1.36) to 1.14 (95%CI: 0.84–1.54) considering either a 1-year or 5-year exposure average, respectively46. A further update of this study was provided, taking also advantage of improved exposure assessment: about 2 million people without history of lung cancer in 2002–2006 were selected from the NHIS database. Lung cancer incident cases were identified up to 2016, and PM10 concentration levels were estimated as 5-year averages at subjects’ residential addresses geocoded on a 100-m grid through a prediction model. PM10 levels ranged from 28.6 to 100.7 µg/m3 and were not associated with increased lung cancer risk, regardless of the various adjustments applied, which included both individual and areal covariates47.
The potential of the UK Biobank was exploited to investigate whether air pollution and genetic factors could jointly contribute to incident lung cancer. Almost 460,000 participants aged 40–69 years, recruited between 2006 and 2010, and without previous cancer at baseline, were included. PM10 concentrations at residential address were estimated applying land-use regression models: estimates were available for years 2007 and 2010, and the average of these sets of values was used as mean exposure of the study participants (19.3 µg/m3). In the fully adjusted model (i.e., including age, sex, BMI, household income, education level, smoking status, and pack-years of smoking), a 10 µg/m3 increase in PM10 concentration was associated with an HR of 1.53 (95%CI: 1.20–1.96). Interestingly, subjects with a high “genetic risk” (based on gene polymorphisms) had a higher risk of incident lung cancer (HR: 1.77, 95%CI: 1.50–2.10)48. Another analysis on a smaller population selected from the UK biobank (N ≈ 367,000) tried to consider also the effect of lifestyle factors, and the association between PM10 exposure and lung cancer risk was smaller and slightly more uncertain (HR: 1.05, 95%CI:0.99–1.10 per IQR increase in PM10, in models adjusted for age, sex, race, educational level, household income, region, BMI, alcohol status, smoking status, physical activity, and diet)49.
The role of PM10 exposure on both mortality and hospitalization for lung cancer was investigated in a recent cohort study conducted in Guangzhou, China, where about 650,000 participants were recruited between 2009 and 2015, and followed up for an average of 8.2 years. Annual mean concentration of PM10 (58.8 µg/m3) was estimated using a satellite-based random forest algorithm. Applying a causal inference model, for every 1 µg/m3 increase in PM10 concentration the HR for mortality due to lung cancer was 1.032 (95%CI: 1.024–1.041), and that for hospitalization was 1.067 (95%CI: 1.020–1.115)50.
The only case-control study that we know of specifically investigating PM10 exposure and lung cancer was performed in South Korea51. Nine hundred and eight incident lung cancer cases were matched to population controls by sex, smoking status and age. PM10 exposure assessment was done using land-use regression models in a 20-year period preceding subjects’ enrollment and complete residential histories since 1995. PM10 levels ranged from 18.25 to 95.58 µg/m3. The OR adjusted for education, smoking status, education, exposure to occupational carcinogens, and fruit intake was 1.09 (95%CI: 0.96–1.23) per 10 µg/m3 of PM10. Compared to the EAGLE study, this investigation is limited by the poor characterization of information regarding smoking habits (i.e., only smoking status was available).
In summary, the evidence trying to link PM10 and lung cancer risk has been steadily growing and points towards the carcinogenic effects of this air pollutant. Nonetheless, uncertainties characterizing the various investigations must be acknowledged, probably related to the variability of the confounders considered in the analyses, the different methods applied for the exposure assessment, the wide range of the pollutant concentration values, and the different time windows investigated (very often close to the health event of interest).
To this regard, the role of exposure to air pollution 10 years before lung cancer diagnosis has been recently examined in a large Southern Californian cohort study including more than 45,000 participants aged 50 + years at enrollment. Lung cancer risk was estimated considering 5-year moving averages of ultrafine particles (UFP) exposure, lagged 10 years52. Interestingly, the authors found only a modest association between UFP exposure and lung cancer risk when considering the entire cohort (HR: 1.03, 95%CI: 0.99–1.08), while an increased risk was observed for adenocarcinoma when comparing most exposed vs. least exposed males (HR: 1.39, 95%CI: 1.05–1.85), and also in male participants who were oldest at the time of enrollment (HR: 1.13, 95%CI: 1.02–1.26). Notwithstanding the far smaller sample size of our study population and the difference in the considered pollutants (although combustion-derived ultrafine particles are numerous in urban PM1053), we tried to replicate the analyses by Jones and colleagues: however, no positive associations were observed neither when looking at adenocarcinoma in males, nor when further restricting our analysis to the same histological subtype among males aged 60 years or more at enrollment (results not shown). Possible explanations of these partially contrasting findings (apart from the obvious difference in sample size and pollutants considered among the two studies) might be the finer spatial resolution of exposure levels in the California study (LUR models to predict average levels at participant residential addresses) but also, on the other hand, the lack of control for important confounders such as occupational exposures, for which indeed we were able to control for.
Our study has several strengths. First, EAGLE is a population-based case-control study with a large number of enrolled subjects18. Many variables regarding residential history, smoking habits, and several others factors relevant for lung cancer were collected. This makes us confident of the quality of our data and allowed us to control for many potential confounders or risk factors that could bias the effect of air pollution in the analysis. Second, we assessed a past exposure to air pollution temporally located 12–15 years before the enrollment which, as far as we know, has rarely been evaluated. Third, we are dealing with exceptionally high values of air pollution concentrations: the mean PM10 estimate of exposure of our study population in 1990 was 68 µg/m3, i.e., more than four times the air quality guideline level recommended by the World Health Organization (15 µg/m3)54. Notably, we also had estimates of PM2.5 values in 1990. We did not focus our analyses on PM2.5 because our main aim was to make a comparison with our previous results regarding the year 2000, where only PM10 estimates were available. However, PM2.5 levels represented about 96% of PM10 values in our dataset. As such, the annual average PM2.5 level in our study population would roughly be 65 µg/m3, i.e., more than three times higher than the mean of the highest quartile of exposure in the study by Jones and colleagues (21.8 µg/m3). In any case, we replicated our main analysis considering PM2.5 exposure and found comparable results (Table S9). Fourth, by comparing exposures in two time points, we tried to address the insidious topic of temporality in cancer development.
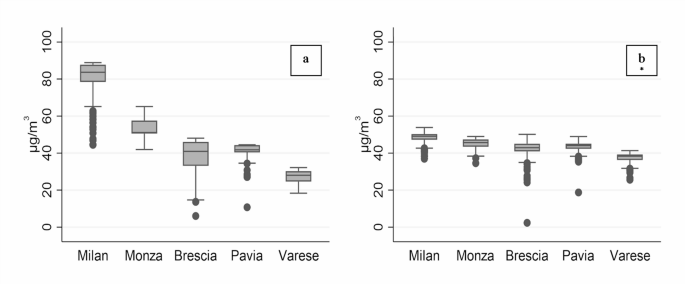
This study has also limitations. First, the spatial distribution of exposure estimates in 1990 is very different from that in 2000. This is particularly evident in Milan, which has much higher PM10 values as compared with other areas. A second limitation regards the low spatial resolution of our exposure data. The model applied to estimate 1990 PM10 concentration levels used a 3 × 3 km grid, thus implying that all subjects localized within the same cell were assigned the exact same exposure value, possibly introducing a nondifferential misclassification of exposure. To this regard, we must also consider that about 70% of our study population was resident within the metropolitan city of Milan. These subjects all fall within four cells only: as such, in our analysis for the year 1990 most subjects share the same exposure. However, the sensitivity analysis where we rescaled exposure estimates for the year 2000 to the 3 × 3 km grid basically reconfirmed previous results obtained with exposure estimates at a much finer spatial resolution, suggesting that exposure granularity is not the main driver of the different findings. Finally, as already discussed, we are comparing different methodologies to estimate exposures in the two time points, which could affect results with their own uncertainties55.