Characteristics of patients with SA-AKI
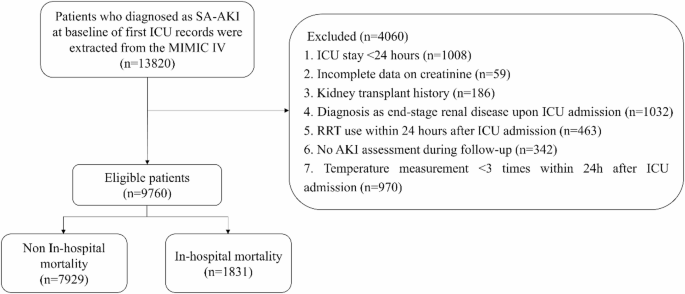
Among the 9760 individuals included, the median age was 66.79 years (IQR: 51.29–82.29 years), with 5639 (57.78%) male participants. During the 8.25-day (IQR: 3.10-22.98 days) follow-up, 1831 (18.76%) individuals died in the hospital, and 521 (5.34%) participants received RRT during their ICU stay. The mean body temperature was 36.65 (0.94)°C. Compared with patients with SA-AKI without in-hospital mortality, those with in-hospital mortality were more likely to be older, have Medicare insurance, have more severe AKI, use vasopressors, and use RRT. Compared with patients with SA-AKI without in-hospital mortality, those with in-hospital mortality had higher SOFA scores, CCIs, heart rates, WBC counts, and BUN levels and lower 24-hour urine output, SPO2 levels, and eGFRs (all P < 0.05). Table 1 shows more detailed characteristics of the patients with SA-AKI. No significant differences were observed before and after the imputation of data for the missing variables (see Supplementary Tables S1 and S2).
Body temperature trajectories of patients with SA-AKI in the first 24 h after ICU admission
We selected models with latent classes contained in the hypothermia, normal temperature, and hyperthermia groups on the basis of the lowest AIC and BIC values and an entropy value > 0.7. Additionally, the model had mean posterior class membership probabilities ranging between 0.7 and 0.81 and the highest relative entropy among the models with different classes, suggesting that this model provided better discrimination. The estimation of the models for a varying number of latent classes is summarized in Supplementary Tables S3 and S4. The different body temperature trajectories of each class are depicted in Fig. 2. In the hypothermia group, five different temperature trajectory classes were identified: L1, L2, L3, L4, and L5. Similarly, four trajectory classes (M1, M2, M3, and M4) emerged in the normal temperature group, whereas the hyperthermia group presented four distinct trajectory classes (H1, H2, H3, and H4). Each trajectory class represented unique patterns of temperature variations within the first 24 h of ICU admission. The overall distribution of trajectory classes varied, with some patients showing rapid temperature increases and others showing gradual decreases or maintaining relatively stable temperature levels.
Body temperature trajectories of patients with SA-AKI. (A) for the hypothermia group, (B) for the normal temperature group, (C) for the hyperthermia group, and (D) for the overall dynamic temperature changes.
Associations between body temperature trajectories and in-hospital mortality
Covariates, including RRT use, age, insurance status, marital status, first care unit, AKI severity, 24-hour urine output, SOFA score, CCI, weight, heart rate, respiratory rate, SPO2 level, RBC count, hematocrit level, RDW, eGFR, PT, BUN level, lactate level, anion gap, ibuprofen use, aspirin use, and acetaminophen use (Supplementary Table S5), were adjusted for. Compared with patients with the M3 trajectory, those with the L1 (HR: 2.41, 95% CI 1.58–3.66), L2 (HR: 1.48, 95% CI 1.11–1.97), L3 (HR: 1.27, 95% CI 1.01–1.59), L4 (HR: 1.29, 95% CI 1.08–1.54), and M1 (HR: 1.29, 95% CI 1.06–1.57) trajectories were at greater risk of in-hospital mortality. Compared with patients with a body temperature between 36 °C and 38 °C, those with a temperature < 36 °C (HR: 1.29, 95% CI 1.13–1.47) had an increased risk of in-hospital mortality (Table 2). This association was further analyzed in patients with SA-AKI with varying baseline temperatures. In the hypothermia group, the L1 (HR: 1.95, 95% CI 1.19–3.18) trajectory was associated with increased in-hospital mortality risk. In the normal temperature group, the M1 (HR: 1.28, 95% CI 1.05–1.56) trajectory was related to elevated in-hospital mortality risk. In the hyperthermia group, the H4 (HR: 2.37, 95% CI 1.05–5.36) trajectory was associated with increased in-hospital mortality risk (Table 3).
Associations between body temperature trajectories and RRT use
Additionally, we examined the links between body temperature trajectories and RRT use. Covariates, including age, marital status, 24-hour urine output, SOFA score, respiratory rate, eGFR, glucose, antibiotics, ventilation, vasopressors, diuretics, ibuprofen use, aspirin use, and acetaminophen use, were adjusted for (Supplementary Table S6). Among all patients with SA-AKI, the M2 (HR: 1.32, 95% CI 1.01–1.73), M4 (HR: 1.65, 95% CI 1.03–2.66), H1 (HR: 4.96, 95% CI 1.38–17.77), and H4 (HR: 6.52, 95% CI 1.74–24.42) trajectories were linked to increased odds of receiving RRT (Table 4). In the normal temperature group, the M4 (HR: 1.66, 95% CI 1.03–2.68) trajectory was associated with increased odds of receiving RRT. For the hyperthermia group, the H1 (HR: 5.19, 95% CI 1.04–25.75) and H4 (HR: 5.45, 95% CI 1.03–28.76) trajectories were correlated with a higher incidence of RRT use (Table 5).