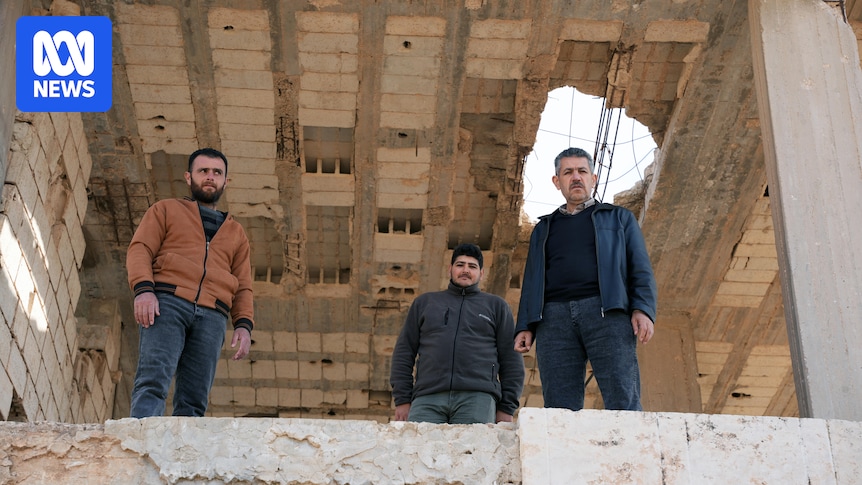
Prevalence, risk factors, and relationship of Hyperuricemia in Chinese

Xinyue Wang,1 Sili Wang,2 Wenbo Qi,3 Ying Wang,2 Lei Zhang,4,* Ping Sun3,*

1Acute Intervention Department (Female III Part), Shenzhen Mental Health Center/Shenzhen Kangning Hospital, Shenzhen, Guangdong, People’s Republic of China; 2Clinical Laboratory, Shenzhen Mental Health Center/Shenzhen Kangning Hospital, Shenzhen, Guangdong, People’s Republic of China; 3Geriatric Medicine Department II, Qingdao Mental Health Center, Qingdao, Shandong, People’s Republic of China; 4Endocrine Department, Qingdao Endocrine & Diabetes Hospital, Qingdao, Shandong, People’s Republic of China

Correspondence: Ping Sun, Qingdao Mental Health Center, 299 Nanjing Road, Shandong, 266034, People’s Republic of China, Tel +86 135 8939 4393, Email [email protected]

Purpose: Previous studies have shown that serum uric acid (UA) levels are significantly higher in patients with bipolar disorder (BD) than in patients with depressive disorder (DD), schizophrenia, and healthy controls. Currently, studies generally report that there is a complex bidirectional interaction between mood disorders (MD) and hyperuricemia (HUA). We investigated the prevalence and related factors of hyperuricemia in Chinese patients with mood disorders to find out potential mechanisms and build a predictive model.
Patients and Methods: A total of 771 patients with mood disorders who met the criteria were enrolled. The demographic and disease characteristics of MD patients were collected by a self-designed questionnaire. Depression severity was assessed by the Hamilton Depression Scale (HAMD-17). The Positive and Negative Symptom Scale (PANSS) was used to assess psychotic symptoms. The Nurse’s Guided Assessment of Suicide Risk Scale (NGASR) was used to assess suicide risk. Laboratory parameters of metabolism include blood cell-related parameters, electrolytes, liver function-related parameters, etc.
Results: The prevalence of hyperuricemia was 21.68% in patients with depressive disorder and 39.25% in patients with depressive episodes of bipolar disorder (DEBD). Among MD patients with or without hyperuricemia, there were some differences such as gender, mood stabilizers, systolic blood pressure etc. The independent risk factors of MD patients with hyperuricemia followed: lithium carbonate, urea (Ur), triglycerides (TG), lactate dehydrogenase (LDH), and white blood cell (WBC) (all p< 0.05). After combining the independent risk factors with platelets (PLT), albumin (ALB), alanine aminotransferase (ALT), and C-peptide by multivariate Logistic regression, we obtained an optimal predictive model.
Conclusion: MD patients treated with lithium carbonate should be closely monitored for uric acid levels. We suggested that hepatic TG accumulation and psychiatric drug-induced hepatocellular damage may contribute to hyperuricemia in patients with mood disorders.

Introduction

Mood Disorders (MD) refers to a collective term for Bipolar Disorder and Depressive Disorder.1 Bipolar Disorder (BD) is an episodic mood disorder defined by manic episodes, mixed episodes, or hypomanic episodes. These episodes usually alternate with depressive episodes or periods of depressive symptoms during the illness. Depressive Disorder (DD) is characterized by depressed mood (eg, sadness, irritability, emptiness) or loss of pleasure, accompanied by other cognitive, behavioral, or vegetative symptoms, and significantly affects organism function. According to the World Health Organization, a total of 970 million people worldwide suffered from mental disorders in 2019, with 280 million suffering from depressive disorder and 40 million suffering from bipolar disorder, the second and third highest prevalence of all mental disorders, respectively.2 It is worth noting that patients with depressive disorder and bipolar disorder are at higher risk for suicide, which is the fourth leading cause of death among 15–29 years old. Healthcare systems globally are severely under-resourced, with only 29% of people with mental disorders and one-third of people with depressive disorder receiving formal mental healthcare services.2

Uric acid (UA) is synthesized mainly in the liver, intestine, and vascular endothelium, which is the end product of exogenous purines in food and endogenous purines in damaged and dead cells. Uric acid is excreted mainly by the kidneys and about 90% reabsorbed by the renal tubules. When the production of uric acid exceeds the amount of uric acid excreted, hyperuricemia (HUA) will occur.3 In recent years, with the development of social economy and changes in lifestyle and diet, the prevalence of hyperuricemia in China has increased, and it has become the second most common metabolic disease after diabetes mellitus, with a tendency of low age onset.4 Data from the China Chronic Disease and Risk Factor Surveillance during 2018–2019 indicate that the prevalence of hyperuricemia in adult Chinese residents is 14%.5 In addition, hyperuricemia is significantly associated with the development and severity of metabolic syndrome and leads to gout.6 Hyperuricemia plays a pathogenic role in the development of chronic kidney disease (CKD) and cardiovascular disease (CVD) by inducing inflammation, endothelial dysfunction, vascular smooth muscle cell proliferation, and activation of the renin-angiotensin system.7

The potential link between two seemingly separate disorders, mood disorders and hyperuricemia, has gradually become a popular research topic in medicine and public health in recent years. Current studies suggest a complex two-way interaction between mood disorders and hyperuricemia. On the one hand, chronic psychological stress may disrupt purine metabolic pathways by activating the hypothalamic-pituitary-adrenal axis (HPA axis), exacerbating oxidative stress and inflammatory responses, leading to increased uric acid production or decreased excretion.8,9 On the other hand, hyperuricemia can indirectly affect central nervous system function and exacerbate abnormal mood regulation through uric acid crystal deposition, pro-inflammatory factor release and vascular endothelial dysfunction.10,11 Some studies have further revealed the common biological mechanisms of two diseases, such as overexpression of inflammatory factors (IL-6, TNF-α), dysregulation of intestinal flora, and mitochondrial dysfunction, which may serve as potential bridges for the co-morbidity of two diseases.12,13

A large-scale cohort study found that the prevalence of hyperuricemia was significantly higher in depressed patients than in healthy population, and uric acid levels were positively correlated with the severity of depressive symptoms.14 A systematic review and meta-analysis also showed that serum uric acid levels were significantly higher in patients with bipolar disorder than in patients with depressive disorder, schizophrenia, and healthy controls, and manic episodes were accompanied by higher uric acid levels than depressive episodes.15 Li et al hypothesized that patients with bipolar disorder may have a dysfunction of the purinergic system that leads to elevated uric acid levels, suggesting that uric acid levels may be a potential biomarker for bipolar disorder.16

Previous studies have shown a strong correlation between mood disorders and hyperuricemia. The prevalence of hyperuricemia in mood disorders carries specific clinical characteristics, which may be associated with disease mechanisms, treatment responses, and prognosis. However, current research on hyperuricemia prevalence and related factors among Chinese patients with mood disorders is still limited, due to insufficient exploration of their causal relationships and potential mechanisms. To improve the prognosis of mood disorders and enable earlier detection of hyperuricemia in patients with mood disorders, this study will analyze the socio-demographic information, clinical characteristics, and overall metabolic parameters of patients with mood disorders, while exploring the risk factors of hyperuricemia in these patients to build a predictive model.

Materials and Methods

Subjects

Patients diagnosed with depressive disorder or depressive episodes of bipolar disorder in the Departments of Depressive Disorder and Bipolar Disorder in Shenzhen Mental Health Center during 2020–2022 were the study subjects in this study. Inclusion criteria for this study included: (1) meeting the Diagnostic and Statistical Manual of Mental Disorders (DSM-5) diagnostic criteria for Depressive Disorder (DD) or Depressive Episode of Bipolar Disorder (DEBD); (2) being able to understand their disease-related condition and completing questionnaires and scale evaluations; and (3) voluntarily participating in this study and signing an informed consent form. Exclusion criteria included: (1) a diagnosis consistent with any other mental disorder; (2) chronic diseases affecting metabolism, such as coronary heart disease, hypertension, and diabetes mellitus; (3) a combination of serious diseases of other organs, such as organic brain disease, serious infections, and renal disease; and (4) drug abuse or alcohol dependence. According to the Mental Health Law of China, we will maintain the confidentiality of patient-related data.

Statistical simulation study and analysis suggest that one of the following two rules of thumb should be followed when using Logistic regression: (1) the EPV (events per variable) should be at least 10; (2) the sample size should be 10–15 times that of the independent variables.17,18 The total number of independent variables in this study was 61, and the sample size was 771.

Clinical Interview Assessment

After specialized training in scale assessment, two psychiatrists administered the Structured Clinical Interview (SCID-I/P), using the DSM-5 as the diagnostic criterion, to all study participants. We used customized questionnaires to collect the basics of patients with mood disorders, including demographic characteristics (gender, age, etc), disease status (duration of illness, drug use, etc), and coexisting disorders. Depression severity was assessed by the Hamilton Depression Scale (HAMD-17), with a score of 7–17 as mild, 18–24 as moderate, and 24 or more as severe. Psychotic symptoms were assessed by the Positive and Negative Symptom Scale (PANSS), with a score of 14 or more as comorbid psychotic symptoms.19 We used the Nurse’s Guided Assessment of Suicide Risk Scale (NGASR) to assess suicide risk in patients with mood disorders.

Laboratory Examination

Patients with mood disorders were routinely screened for blood cell-related parameters, electrolytes, fasting blood glucose, liver function-related parameters, blood lipids, kidney function-related parameters, thyroid hormones, lactogen, serum enzymes and specific proteins, and D-Dimer (D-Di) after admission. We measured uric acid by the Uricase method. The laboratory instrument employed was the Japanese Olympus AU5800 automatic biochemical analyzer, which utilized Roche uric acid detection reagents. To ensure the accuracy of the test results, each batch of testing is set up with quality control products. Test results of quality control products must be in the allowable error range before accepting the experimental data. According to the laboratory diagnostic criteria of Shenzhen Mental Health Center, National Clinical Practice National Guide to Clinical Laboratory Procedures (4th Edition), we defined hyperuricemia as UA>430 umol/L in males or UA>360 umol/L in females.

Statistical Analysis

Categorical and continuous variables were tested by chi-square and t-tests, respectively. The Kolmogorov–Smirnov one-sample test was used to test for normal distribution. Mann–Whitney U-test was used for non-normally distributed variables. Using Bonferroni correction to adjust for multiple comparisons. In addition, we used univariate and multivariate Logistic regression (backward: LR, system default: p<0.10) to investigate the risk factors for MD patients with hyperuricemia, and the area under the ROC (AUC) curve to determine the discrimination of significant parameters in distinguishing patients with and without hyperuricemia. Bootstrap cross-validation was used to test the optimal regression model. A consistency statistic between 0.7 and 0.8 is usually acceptable.20 All statistical analyses in this study used IBM SPSS 25.0 statistical software and R 4.1.2. A two-tailed p-value <0.05 was considered statistically significant.

Results

The mean age of the study subjects was 27.3 years (11–68 years), with 585 patients with depressive disorder (DD) and 186 patients with depressive episode of bipolar disorder (DEBD). Mean uric acid levels were significantly higher in DEBD patients than in DD patients (396.18±147.66 umol/L vs 326.32±88.48 umol/L, p<0.001). There were 127 (21.68%, 95% CI=0.18–0.25) hyperuricemia in DD patients and 73 (39.25%, 95% CI=0.32–0.46) in DEBD patients. No missing values in the data of this study.

Considering the differences in the overall characteristics of DD patients and DEBD patients, we analyzed the characteristics of DD patients (Table 1) and DEBD patients (Table 2) with or without hyperuricemia separately. Among MD patients with or without hyperuricemia, the differences were statistically significant in gender, mood stabilizers, systolic blood pressure (SBP), WBC, PLT, ALB, PA, ALT, AST, CK, LDH, Ur, TG, HDL, LDL, C-peptide, and hs-CRP (all p<0.05).

Table 1 Socio-Demographic Information, Clinical Characteristics and Laboratory Parameters in Depressive Disorder Patients with or Without Hyperuricemia (, %)

Table 2 Socio-Demographic Information, Clinical Characteristics and Laboratory Parameters in Depressive Episodes of Bipolar Disorder Patients with or Without Hyperuricemia (, %)

We first used univariate Logistic regression to screen for related factors of hyperuricemia in patients with mood disorders. Then, the risk factors (OR>1, p<0.05) were included in the multivariate Logistic regression to analyze the independent risk factors of mood disorder patients with hyperuricemia as follows: lithium carbonate, Ur, TG, LDH, and WBC (all p<0.05) (Table 3).

Table 3 Analysis of Risk Factors of Hyperuricemia in Patients with Mood Disorders

Finally, we obtained an optimal prediction model (AUC=0.79, p<0.001, 95% CI=0.75–0.83) by multivariate Logistic regression, which can differentiate between MD patients with or without hyperuricemia (Figure 1). The AUC value after Bootstrap cross-validation was 0.77 (10-fold, 50 repetitions).

Figure 1 Predictive ability of risk factors for the hyperuricemia in patients with mood disorders.

Discussion

Uric Acid Levels and Prevalence of Hyperuricemia in Chinese Patients with Mood Disorders

Previous studies have found that patients with mood disorders have different UA levels than healthy people. Most studies showed that patients with bipolar disorders had significantly higher UA levels than patients with depressive disorder and healthy controls.15 However, the results of UA levels are inconsistent in patients with depressive disorder.21,22 We found that uric acid levels were significantly higher in patients with depressive episode of bipolar disorder than in patients with depressive disorder. In addition, we found the prevalence of hyperuricemia was 21.68% in patients with depressive disorder and 39.25% in patients with depressive episodes of bipolar disorder, both of which were much higher than the overall prevalence of hyperuricemia in China (14%).

Gender, age, BMI, physical activity, hypertension, diabetes, legume and nut consumption, vegetable intake, red meat consumption, alcohol consumption, and vegetarianism are closely associated with hyperuricemia.23 Hypertension and dyslipidemia increase the risk of developing hyperuricemia, while diabetes shows a negative correlation. Consumption of vegetarian foods, legumes, nuts, and vegetables can reduce the risk of hyperuricemia, whereas high alcohol intake may elevate its incidence. In addition, medications affect metabolism in patients with mood disorders. Some metabolites (eg, lipids, choline, inositol, etc) in patients with bipolar disorder may be associated with changes in lithium metabolism, and branched-chain amino acids may be involved in the recovery of the state of patients with depressive disorder after sertraline treatment.24,25 Antipsychotics, especially second-generation antipsychotics, are associated with weight gain, lipid disturbance and glucose dysregulation, which can easily lead to the occurrence of metabolic syndrome.26

Risk Factors and Pathogenesis of Hyperuricemia in Chinese Patients with Mood Disorders

Lithium salts were used to treat uric acid diathesis (gouty disease) before being introduced into modern psychiatry as a mood stabilizer. A study found that patients with mood disorders had significantly higher serum UA levels but lower Ur levels after lithium carbonate treatment compared to healthy controls.27 Our study found that lithium carbonate was not only a major risk factor for MD patients with hyperuricemia, but also the risk factor with the highest risk score. Secondly, urea (Ur) also contributes to differentiating MD patients with or without hyperuricemia. Renal side effects of lithium include polyuria, nephrogenic diabetes insipidus (NDI), proteinuria, distal tubular acidosis, and decreased glomerular filtration rate. However, it is inaccurate to attribute the pathogenesis of lithium to lithium-induced kidney injury.28 In 1873, Garrod suggested that the diuretic effect of lithium could promote renal excretion, followed by A. Hesse demonstrating that lithium did have diuretic properties.29 Some diuretics (eg, thiazide diuretics and loop diuretics) cause hyperuricemia by decreasing blood volume and increasing net reabsorption of uric acid.30 Whether lithium salts have a similar mechanism remains to be explored. The prevailing view is that lithium reduces uric acid clearance by inhibiting renal tubular secretion.31,32

Previous studies have found that obesity and triglyceride (TG) levels are major risk factors for hyperuricemia in patients with bipolar disorder.16 Our study also found that TG level was a main risk factor for hyperuricemia in patients with mood disorders, and combined with albumin (ALB) and alanine aminotransferase (ALT) liver function-related risk factors to build an optimal prediction model. Liang et al have shown that fatty acid oxidation (FAO) can promote hepatic urate synthesis by activating the HIF-1α-NT5C2/XDH pathway.33 They suggest high TG levels can produce hyperuricemia by promoting the lipolysis metabolism pathway. When TG synthesized by the liver is not transported in time, fatty liver can form.34 Hepatic TG accumulation is a prime feature of nonalcoholic fatty liver disease (NAFLD) and a hepatic manifestation of insulin resistance.35 In the state of insulin resistance (IR), standard insulin levels do not work in tissues such as fat, skeletal muscle, liver, and heart, resulting in elevated insulin concentrations.36 The C-peptide is secreted by pancreatic β-cells and shares a common precursor (insulinogen) with insulin, so testing C-peptide is equivalent to testing insulin.37 In summary, IR promotes hepatic lipolysis by accelerating hepatic TG accumulation, which ultimately triggers hyperuricemia.

This study found that lactate dehydrogenase (LDH) had the highest risk score compared to other serum enzymes (CK, ALT, AST). Serum enzymes mainly reflect organ or tissue damage, while LDH is the least specific serum enzyme among them as it is present in all tissue cells. Clinically, elevated LDH levels are common in myocardial infarction, hepatitis, leukemia, anemia, and skeletal muscle injury. Patients with mental disorders may suffer from liver injury and skeletal muscle injury (rhabdomyolysis) due to the use of psychiatric drugs.38,39 A study found that the hepatocytotoxicity of acetaminophen (APAP) led to elevated local UA concentrations, which may be related to the large amount of DNA deposited in the necrotic regions of the liver.40 DNA contains large amounts of purines, and DNA fragments released from necrotic hepatocytes provide a large amount of purine substrate, which leads to elevated UA levels. In addition to releasing DNA fragments, cell necrosis also releases LDH. Therefore, high LDH levels and high UA levels may be concomitant manifestations of cell necrosis, and the causal relationship between the two requires more in-depth study in the future.

We also found that white blood cell (WBC) was an independent risk factor in MD patients with hyperuricemia, and platelet (PLT) was involved in the prediction model. The pathologic elevations of white blood cells are common in acute infections, leukemias, acute hemorrhages, aplastic anemia, etc.41 And high platelet levels are common in acute or chronic inflammatory conditions, iron deficiency anemia, and cancer.42 A study suggested that xanthine oxidoreductase activity increased in pathological conditions such as organ ischemia, inflammation, or infection.43 Xanthine oxidoreductase (XOR) catalyzes the last two steps of purine catabolism, from hypoxanthine to UA, while generating reactive oxygen species (ROS). Serum XOR is primarily derived from physiologic hepatocyte renewal, whereas tissue damage due to liver pathology causes a dramatic increase in serum XOR levels.44 Increased XOR activity inevitably accelerates purine catabolism, leading to elevated UA levels. There are few studies on the direct correlation between UA and WBC or PLT. Cheng et al found that elevated UA levels may be associated with the up-regulation of lethal 7-c, which correlates with the coagulation of platelets.45

Currently, biomarkers proposed by psychiatric metabolomics are present in several key pathways, including lipid metabolism, amino acid and neurotransmitter metabolism, energy metabolism, and oxidative stress.46 To serve as a clinically useful biomarker, a metabolite must demonstrate both sensitivity and specificity for a particular disorder. However, some metabolites overlap across diseases, while others are only reported in individual conditions.46 Identifying common metabolites in these studies remains challenging. This prediction model of mood disorder patients with hyperuricemia has clinical application value, and the early identification of high-risk patients is its core significance, to start targeted interventions to prevent gout, cardiovascular, and renal serious complications, and ultimately to improve the prognosis. After identifying high-risk patients, precise management will be triggered to weigh and adjust drugs that may increase uric acid, and initiate uric acid-lowering therapy in collaboration with specialists when necessary.

This study has several limitations. First, it was a cross-sectional survey study and could not demonstrate a causal relationship between variables. We must confirm our findings with a prospective cohort study. Second, the patients in this study were from southern China and recruited from the inpatient department of one hospital, making it regional. Therefore, our findings should be validated in other populations from different regions and clinical backgrounds. Third, the small number of patients with depressive episodes of bipolar disorder made our overall analysis difficult.

Conclusion

This study found that uric acid levels were significantly higher in patients with depressive episode of bipolar disorder than in patients with depressive disorder. Lithium carbonate, Ur, TG, LDH, and WBC were the main risk factors of hyperuricemia in patients with mood disorders. In addition, PLT, ALB, ALT, and C-peptides were involved in the optimal regression model, which helped us distinguish whether patients with mood disorders had concomitant hyperuricemia. Our study suggested that hepatic TG accumulation and psychiatric drug-induced hepatocellular damage may contribute to hyperuricemia in patients with mood disorders.

Abbreviations

MD, mood disorders; DD, depressive disorder; DEBD, depressive episodes of bipolar disorder; HUA, hyperuricemia; CKD, chronic kidney disease; CVD, cardiovascular disease; DSM-5, Diagnostic and Statistical Manual of Mental Disorders; HAMD-17, 17-item Hamilton Depression Rating Scale; PANSS, Positive and Negative Symptom Scale; NGASR, Nurse’s Guided Assessment of Suicide Risk Scale; AUC, the area under the ROC curve; OR, odds ratio; WBC, white blood cell; NEUT, neutrophil; LYM, lymphocyte; RBC, red blood cell; HGB, hemoglobin; PLT, platelet; FBG, fasting blood glucose; TP, total protein; ALB, albumin; GLB, globulin; PA, prealbumin; TBIL, total bilirubin; DBIL, direct bilirubin; IBIL, indirect bilirubin; ALT, alanine aminotransferase; AST, aspartate aminotransferase; TBA, total bile acid; CK, creatine kinase; LDH, lactate dehydrogenase; Ur, urea; CREA, creatinine; UA, uric acid; TG, triglyceride; TC, total cholesterol; HDL, high-density lipoprotein; LDL, low-density lipoprotein; TSH, thyroid stimulating hormone; TT3, total triiodothyronine; FT3, free triiodothyronine; TT4, total thyroxine; FT4, free thyroxine; PRL, prolactin; NSE, neuron-specific enolase; S-100, a kind of neuro-specific proteins; hs-CRP, hypersensitive C-reactive protein; PCT, procalcitonin; ACTH, adrenocorticotropic hormone; D-Di, D-Dimer; SBP, systolic blood pressure; DBP, diastolic blood pressure; NDI, nephrogenic diabetes insipidus; FAO, fatty acid oxidation; NAFLD, nonalcoholic fatty liver disease; IR, insulin resistance; APAP, acetaminophen; XOR, xanthine oxidoreductase; ROS, reactive oxygen species.

Data Sharing Statement

The data that support the findings of this study are available from the corresponding author upon reasonable request.

Ethics Approval and Informed Consent

This study was approved by the Institutional Ethical Committee for clinical research of Shenzhen Mental Health Center, Shenzhen, China. Informed consent was provided according to the Declaration of Helsinki.

Funding

This research was supported by the Shandong Province Medicine and Health Science and Technology Development Programme Project (Grant No. 202203090255), the Qingdao Medical and Health Research Project (Grant Nos. 2024-WJKY126 and 2024-WJKY132), the Shenzhen Fund for Guangdong Provincial High-level Clinical Key Specialties (No.SZGSP013), and the Fund of the Science and Technology Planning Project of Shenzhen Municipality (20210617155253001).

Disclosure

The authors report no conflicts of interest in this work.

References

1. ICD-11 cause of death and disease statistics. Available from: https://icd11.pumch.cn/Browse/Linearization?releaseId=2023-01&databaseEdition=1&hash=1689166199077. Accessed March 4, 2024.

2. Mental disorders. World Health Organization. Available from: https://www.who.int/zh/news-room/fact-sheets/detail/mental-disorders. Accessed March 4, 2024.

3. Yang S, Liu H, Fang XM, Yan F, Zhang Y. Signaling pathways in uric acid homeostasis and gout: from pathogenesis to therapeutic interventions. Int Immunopharmacol. 2024;132:111932. doi:10.1016/j.intimp.2024.111932

4. Multidisciplinary Expert Task Force on Hyperuricemia and Related Diseases. Chinese multidisciplinary expert consensus on the diagnosis and treatment of hyperuricemia and related diseases. Chin Med J. 2017;130(20):2473–2488. doi:10.4103/0366-6999.216416

5. Dietary Guidelines for Adults with Hyperuricemia and Gout (2024 Edition). National Health Commission of the People’s Republic of China. Available from: http://www.nhc.gov.cn/sps/s7887k/202402/4a82f053aa78459bb88e35f812d184c3.shtml?jump=true. Accessed March 4, 2024.

6. Lioté F. Hyperuricemia and gout. Curr Rheumatol Rep. 2003;5(3):227–234. doi:10.1007/s11926-003-0072-y

7. Yanai H, Adachi H, Hakoshima M, Katsuyama H. Molecular biological and clinical understanding of the pathophysiology and treatments of hyperuricemia and its association with metabolic syndrome, cardiovascular diseases and chronic kidney disease. Int J Mol Sci. 2021;22(17):9221. doi:10.3390/ijms22179221

8. Tsigos C, Chrousos GP. Hypothalamic-pituitary-adrenal axis, neuroendocrine factors and stress. J Psychosom Res. 2002;53(4):865–871. doi:10.1016/S0022-3999(02)00429-4

9. Raison CL, Capuron L, Miller AH. Cytokines sing the blues: inflammation and the pathogenesis of depression. Trends Immunol. 2006;27(1):24–31. doi:10.1016/j.it.2005.11.006

10. Tang X, Song ZH, Cardoso MA, Zhou JB, Simó R. The relationship between uric acid and brain health from observational studies. Metab Brain Dis. 2022;37(6):1989–2003. doi:10.1007/s11011-022-01016-2

11. Wang Q, Zhao H, Gao Y, et al. Uric acid inhibits HMGB1-TLR4-NF-κB signaling to alleviate oxygen-glucose deprivation/reoxygenation injury of microglia. Biochem Biophys Res Commun. 2021;540:22–28. doi:10.1016/j.bbrc.2020.12.097

12. Beurel E, Toups M, Nemeroff CB. The bidirectional relationship of depression and inflammation: double trouble. Neuron. 2020;107(2):234–256. doi:10.1016/j.neuron.2020.06.002

13. Mangiola F, Ianiro G, Franceschi F, Fagiuoli S, Gasbarrini G, Gasbarrini A. Gut microbiota in autism and mood disorders. World J Gastroenterol. 2016;22(1):361–368. doi:10.3748/wjg.v22.i1.361

14. Wang J, Yang M, Lin H, Wang J. Association between uric acid and the risk of depressive symptoms in US adults: results from NHANES 2005–2018. Sci Rep. 2024;14(1):24097. doi:10.1038/s41598-024-74869-5

15. Chen H, Sun F, Jin W. Study on association of serum uric acid levels with bipolar disorder: systematic review and meta-analysis in Chinese patients. Ann Gen Psychiatry. 2023;22(1):20. doi:10.1186/s12991-023-00450-5

16. Li S, Lu X, Chen X, et al. The prevalence and associated clinical correlates of hyperuricemia in patients with bipolar disorder. Front Neurosci. 2022;16:998747. doi:10.3389/fnins.2022.998747

17. Gao Y, Zhang J. Sample size determination for logistic regression analysis. J Evidence-Based Med. 2018;18(02):122–124.

18. van Smeden M, de Groot JA, Moons KG, et al. No rationale for 1 variable per 10 events criterion for binary logistic regression analysis. BMC Med Res Methodol. 2016;16(1):163. doi:10.1186/s12874-016-0267-3

19. Kay SR, Fiszbein A, Opler LA. The positive and negative syndrome scale (PANSS) for schizophrenia. Schizophr Bull. 1987;13(2):261–276. doi:10.1093/schbul/13.2.261

20. Hosmer DW, Lemeshow S. Applied Logistic Regression. Wiley-Interscience; 2000.

21. Tao R, Li H. High serum uric acid level in adolescent depressive patients. J Affect Disord. 2015;174:464–466. doi:10.1016/j.jad.2014.12.031

22. Li Y, Zhao L, Yu D, Ding G. Associations between serum uric acid and depression among middle-aged and elderly participants in China. Psychol Health Med. 2019;24(10):1277–1286. doi:10.1080/13548506.2019.1622748

23. Piao W, Zhao L, Yang Y, et al. The prevalence of hyperuricemia and its correlates among adults in China: results from CNHS 2015–2017. Nutrients. 2022;14(19):4095. doi:10.3390/nu14194095

24. Sussulini A, Prando A, Maretto DA, et al. Metabolic profiling of human blood serum from treated patients with bipolar disorder employing 1H NMR spectroscopy and chemometrics. Anal Chem. 2009;81(23):9755–9763. doi:10.1021/ac901502j

25. Kaddurah-Daouk R, Bogdanov MB, Wikoff WR, et al. Pharmacometabolomic mapping of early biochemical changes induced by sertraline and placebo. Transl Psychiatry. 2013;3(1):e223. doi:10.1038/tp.2012.142

26. Pillinger T, McCutcheon RA, Vano L, et al. Comparative effects of 18 antipsychotics on metabolic function in patients with schizophrenia, predictors of metabolic dysregulation, and association with psychopathology: a systematic review and network meta-analysis. Lancet Psychiatry. 2020;7(1):64–77. doi:10.1016/S2215-0366(19)30416-X

27. Wang Y, Lu Y, Liu X, et al. Analysis of serum uric acid and urea levels in patients with affective disorder after lithium carbonate treatment. Int J Lab Med. 2007;28(7):580–582.

28. Gong R, Wang P, Dworkin L. What we need to know about the effect of lithium on the kidney. Am J Physiol Renal Physiol. 2016;311(6):F1168–F1171. doi:10.1152/ajprenal.00145.2016

29. Amdisen A, Hildebrandt J. Use of lithium in the medically ill. Psychother Psychosom. 1988;49(2):103–119. doi:10.1159/000288074

30. Reungjui S, Pratipanawatr T, Johnson RJ, Nakagawa T. Do thiazides worsen metabolic syndrome and renal disease? The pivotal roles for hyperuricemia and hypokalemia. Curr Opin Nephrol Hypertens. 2008;17(5):470–476. doi:10.1097/MNH.0b013e328305b9a5

31. Perez-Ruiz F, Alonso-Ruiz A, Calabozo M. Lithium-induced gout in a patient with bipolar disorder. Br J Rheumatol. 1998;37(6):700–701. doi:10.1093/rheumatology/37.6.700

32. Walter-Sack I, Klotz U, Kobbe G, Schumann G, Voehringer HF. Impact of chronic lithium treatment on renal uric acid excretion in humans. Nephrol Dial Transplant. 2009;24(9):2734–2739. doi:10.1093/ndt/gfp160

33. Liang N, Yuan X, Zhang L, et al. Fatty acid oxidation-induced HIF-1α activation facilitates hepatic urate synthesis through upregulating NT5C2 and XDH. Life Metab. 2024;3(5):loae018. doi:10.1093/lifemeta/loae018

34. Castro L, Tórtora V, Mansilla S, Radi R. Aconitases: non-redox iron-sulfur proteins sensitive to reactive species. Acc Chem Res. 2019;52(9):2609–2619. doi:10.1021/acs.accounts.9b00150

35. Bedogni G, Miglioli L, Masutti F, Tiribelli C, Marchesini G, Bellentani S. Prevalence of and risk factors for nonalcoholic fatty liver disease: the Dionysos nutrition and liver study. Hepatology. 2005;42(1):44–52. doi:10.1002/hep.20734

36. Martínez FJ, Villa E, Serrano J, García-Robles R. Diagnosis of insulin resistance. Drugs. 1993;46(Suppl 2):165–171. doi:10.2165/00003495-199300462-00026

37. Hoekstra JB, van Rijn HJ, Erkelens DW, Thijssen JH. C-peptide. Diabetes Care. 1982;5(4):438–446. doi:10.2337/diacare.5.4.438

38. Ferrajolo C, Scavone C, Donati M, et al. Antidepressant-induced acute liver injury: a case-control study in an Italian inpatient population. Drug Saf. 2018;41(1):95–102.

39. Holmberg PJ, Arteaga G, Schiltz BM, Homme J. Sertraline-induced rhabdomyolysis, trismus, and cardiac arrest in a child. Pediatrics. 2018;142(4):e20180804. doi:10.1542/peds.2018-0804

40. Tang C, Cen L, Zeng H, et al. Inhibiting hepatocyte uric acid synthesis and reabsorption ameliorates acetaminophen-induced acute liver injury in mice. Cell Mol Gastroenterol Hepatol. 2024;17(2):251–265. doi:10.1016/j.jcmgh.2023.10.005

41. Abramson N, Melton B. Leukocytosis: basics of clinical assessment. Am Fam Physician. 2000;62(9):2053–2060.

42. Schafer AI. Thrombocytosis. N Engl J Med. 2004;350(12):1211–1219. doi:10.1056/NEJMra035363

43. Garattini E, Mendel R, Romão MJ, Wright R, Terao M. Mammalian molybdo-flavoenzymes, an expanding family of proteins: structure, genetics, regulation, function and pathophysiology. Biochem J. 2003;372(Pt 1):15–32. doi:10.1042/bj20030121

44. Bortolotti M, Polito L, Battelli MG, Bolognesi A. Xanthine oxidoreductase: one enzyme for multiple physiological tasks. Redox Biol. 2021;41:101882. doi:10.1016/j.redox.2021.101882

45. Cheng X, Liu T, Ma L, et al. Prothrombotic effects of high uric acid in mice via activation of MEF2C-dependent NF-κB pathway by upregulating let-7c. Aging. 2020;12(18):17976–17989. doi:10.18632/aging.103540

46. Konjevod M, Sáiz J, Bordoy L, et al. Validated metabolomic biomarkers in psychiatric disorders: a narrative review. Mol Med. 2025;31(1):254. doi:10.1186/s10020-025-01258-7

Continue Reading