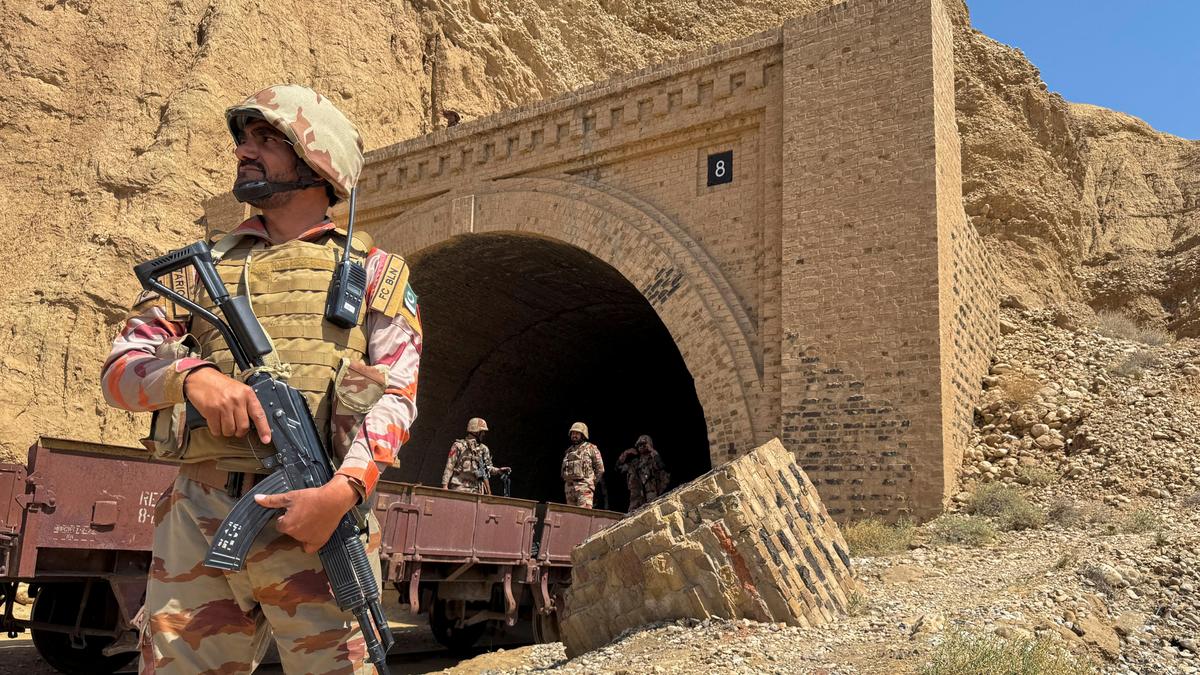
Ulinastatin for the treatment of severe acute pancreatitis: a systematic review and meta-analysis | BMC Gastroenterology

A total of 5,537 studies were extracted from the aforementioned electronic databases. After the removal of 1,032 duplicate records, 4,505 unique studies were available for the initial screening of titles and abstracts. After screening, 12 prospective and retrospective studies [9, 10, 19,20,21,22,23,24,25,26,27,28] were deemed eligible for inclusion in the analysis following the evaluation of the full-text articles. A total of 12 studies were included in the meta-analysis, comprising 1,244 participants (659 in the ulinastatin group and 585 in the control group) across different outcomes. A detailed overview of the search and selection process is depicted in Fig. 1.

Fig. 1

Study flow chart depicting the steps of synthesis of evidence from the literature

The risk of bias of the included studies is enumerated in Table s2. In our analysis of the 12 included observational studies, Newcastle Ottawa Scale scores ranged from 3 to 6 out of a maximum of 9, indicating an overall moderate to high risk of bias. Specifically, most studies exhibited limitations in the “comparability” domain, with only three studies scoring 1 out of 2 stars, and none scoring full marks. Additionally, selection criteria were inconsistently fulfilled, with only five studies scoring ≥ 3 out of 4 stars. While the outcome assessment domain generally received 2 out of 3 stars across studies, the cumulative Newcastle Ottawa Scale ratings suggest that methodological limitations, particularly in selection and comparability, may have influenced the pooled estimates.

Characteristics of the included studies

Following completion of the search, 12 studies [9, 10, 19,20,21,22,23,24,25,26,27,28] were included for the quantitative analysis and data synthesis. Two of these twelve studies were from the same centre and author group. Both studies were included as they evaluated different therapeutic combinations and populations and provided relevant data for our analysis. Table 1 depicts the characteristics of the patients from the studies included in our meta-analysis.

Table 1 Characteristics of the patients in the included studies

Outcomes

Mortality rate

Data from seven studies were included in the analysis to estimate the pooled mortality rate in patients who were treated with ulinastatin when compared to standard of care (SoC) (Fig. 2). The pooled analysis of seven studies revealed a significant reduction in mortality risk, with a risk ratio of 0.36 [95% CI: 0.20, 0.65]. The heterogeneity was moderate (I² = 53%). Visual inspection of the funnel plot for mortality suggested asymmetry, indicating a potential risk of publication bias (Figure s1). A sensitivity analysis was conducting with two overlapping studies [20, 21], and the results were unchanged (Figures s2 and s3).

Fig. 2
figure 2

A forest plot depicting the pooled mortality rate in patients with SAP who were treated using ulinastatin

Duration of hospitalisation

Data from four studies were included in the analysis to estimate the pooled duration of hospitalisation in patients who were treated with ulinastatin when compared to SoC (Fig. 3A). The pooled analysis of four studies revealed no significant reduction in the duration of hospitalisation (mean difference: 4.18 days [95% CI: −9.03, 0.68]). The heterogeneity was considerable (I² = 98%).

Fig. 3
figure 3

Forest plots depicting pooled analysis data (A) Duration of hospitalization, (B) APACHE-II score, (C) White blood cell count, (D) C-reactive protein, (E) Time taken for disappearance of abdominal pain, (F) Tumor necrosis factor-α, (G) Interleukin-6

Acute physiology and chronic health evaluation score

Data from six studies were included in the analysis to estimate the pooled APACHE-II score in patients treated with ulinastatin compared to the SoC (Fig. 3B). The pooled APACHE-II score showed a mean difference of −0.11 (95% CI: −1.48, 1.26), indicating no significant reduction. The heterogeneity was considerable (I² = 97%).

White blood cell count

Data from three studies were included in the analysis to estimate the pooled WBC count in patients treated with ulinastatin compared to the SoC (Fig. 3C). The analysis showed a mean difference of −2.17 × 109/cu mm (95% CI: −2.86, −1.48), indicating a significant reduction in WBC count with ulinastatin treatment. The heterogeneity was low to moderate (I² = 29%).

C-reactive protein levels

Data from four studies were included in the analysis to estimate the pooled CRP levels in patients treated with ulinastatin compared to the SoC (Fig. 3D). The pooled CRP level showed a mean difference of −7.77 mg/L (95% CI: −11.31, −4.23), indicating a significant reduction with ulinastatin treatment. The heterogeneity was considerable (I² = 98%).

Time for the disappearance of abdominal pain

Data from four studies were included in the analysis to estimate the pooled time for the disappearance of abdominal pain in patients treated with ulinastatin compared to the SoC (Fig. 3E). The pooled mean difference was − 1.77 days (95% CI: −2.18, −1.36), indicating a significant reduction in the time to pain resolution with ulinastatin treatment. The heterogeneity was substantial (I² = 74%).

Tumour necrosis factor-α levels

Data from four studies were included in the analysis to estimate the pooled TNF-α levels in patients treated with ulinastatin compared to the SoC (Fig. 3F). The analysis showed a mean difference of −15.75 pg/mL (95% CI: −24.13, −7.37), indicating a significant reduction in TNF-α levels with ulinastatin treatment. The heterogeneity was considerable (I² = 97%).

Serum IL-6 levels

Data from four studies were included in the analysis to estimate the pooled serum IL-6 levels in patients treated with ulinastatin compared to the SoC (Fig. 3G). The pooled mean difference was − 16.82 pg/mL (95% CI: −29.31, −4.34), indicating a significant reduction in serum IL-6 levels with ulinastatin treatment. The heterogeneity was considerable (I² = 96%).

Although the funnel plot for mortality demonstrated some degree of asymmetry, indicating possible publication bias, this finding must be interpreted with caution due to the small number of studies included. Formal assessments, such as Egger’s test, were not conducted as they are not reliable with fewer than 10 studies. (Figure s1).

All outcomes were rated as having low certainty of evidence according to the GRADE approach. This was primarily due to the observational nature of the included studies, which automatically starts the evidence level at low. Additionally, several studies demonstrated a serious risk of bias, with common issues in the comparability domain. No serious concerns were noted for inconsistency, indirectness, or imprecision; however, the initial study design and risk of bias justified maintaining the GRADE rating at the low level.

Continue Reading