Study design and participants
This phase 1 trial was conducted at the CAPRISA eThekwini Clinical Research Site in Durban, South Africa. The protocol was reviewed and approved by the University of KwaZulu-Natal BREC and the SAHPRA and is available at https://www.caprisa.org/Pages/EDCTP-funded%20studies. The trial was registered on the Pan African Clinical Trial Registry, PACTR202003767867253. Volunteers were recruited from Durban and surrounding areas within KwaZulu-Natal using BREC-approved study materials. Written informed consent was obtained from all participants prior to their enrollment in the study, in accordance with ethical guidelines and regulatory requirements. Following successful eligibility assessments, 57 participants (median age 25 years; BMI range 18.1–39.3 kg/m2) were enrolled into one of four groups (Supplementary Table 2)6.
The data included in this study are derived exclusively from HIV-uninfected participants (n = 57). At the time of this analysis, the HIV-positive groups remain in follow-up, and no complete datasets from these participants were available for inclusion. This analysis was exploratory in nature and focused specifically on evaluating the pharmacokinetic impact of co-administering recombinant human hyaluronidase (EDP) among HIV-negative individuals. The objective was to better understand how EDP influences the pharmacokinetic profile of the administered bNAbs.
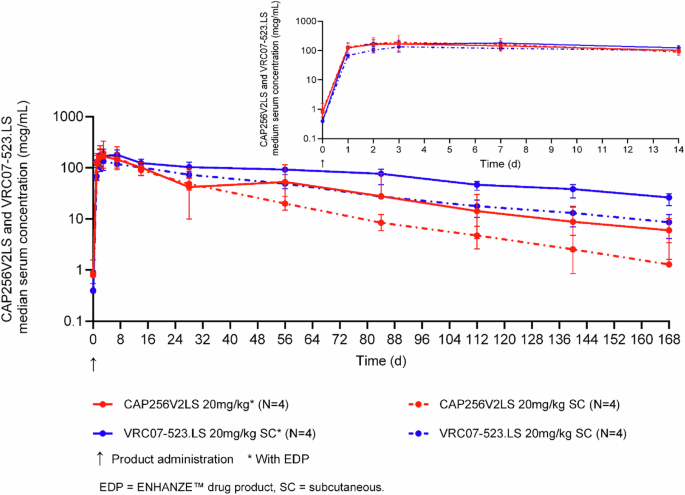
Fifty-seven HIV-negative women aged 18–40 years were included in this study and received bNAbs formulated with ENHANZE™ drug product (EDP) and without EDP (Supplementary Table 2). Because abdomen-site limitations required equivalent injection volumes, only the 20 mg kg cohorts were dosed with identical antibody combinations ± EDP, permitting a like-for-like comparison. Five participants in each 20 mg/kg cohort (total n = 10), therefore, comprised the pre-specified sub-analysis used for direct EDP versus no-EDP evaluation. All other HIV-uninfected groups (n = 57) contributed to population PK modeling (Fig. 4).
The dosing groups evaluating different administration strategies for bNAbs. CAP256V2LS and VRC07-523LS were delivered subcutaneously, both with and without recombinant human hyaluronidase (ENHANZE™ Drug Product, or EDP).
Pharmacokinetic analysis cohort: PK model and dose-normalized comparison
A total of 57 participants were enrolled across all study arms, and plasma concentration-time data from all 57 participants were included in the development of the population PK model. For the dose-normalized PK comparison, a subset of 42 participants was included—comprising individuals who received EDP (n = 20) or non-EDP regimens (n = 22) (Supplementary Table 1). Participants in Groups 1A and 1B were originally assigned to the non-EDP arm at 5 mg/kg and 10 mg/kg IV dosing, respectively. However, only three participants from these groups were included in the dose-normalized PK analysis. Two participants—one from Group 1A and one from Group 1B—were excluded due to end-of-infusion sampling times occurring later than 1 h post-dose. Repeat dosing groups from Group 2 were also excluded. These exclusions were made a priori to maintain consistency in PK parameter estimation.
Study product administration
CAP256V2LS and VRC07-523LS were individually mixed with EDP in the clinic pharmacy, and each antibody was provided as a single individual dose. Each antibody was administered sequentially at different sites of the abdomen to allow distinction of local reactogenicity. For the subcutaneous groups that utilized EDP, the product was administered into the abdomen at a single site via an infusion pump at a rate of 1 ml per minute. For the subcutaneous group without EDP, the product was given as a manual syringe injection technique with a maximum of 2.5mls per syringe, or the product was administered into the abdomen at a single site via an infusion pump at a rate of 15 ml per hour.
Determination of bNAb serum levels
A quantitative electrochemiluminescence sandwich immunoassay technique was performed on the MSD platform to individually determine CAP256V2LS and VRC07-523LS concentrations in plasma samples. The amount of CAP256V2LS and VRC07-523LS sandwiched by the anti-ID and anti-human IgG antibodies was directly proportional to the concentration of reactive CAP256V2LS and VRC07-523LS in each sample. Measurements were taken from distinct samples. Sample concentrations were interpolated from standard curves using Excel and GraphPad Prism Software 9.2.0 (GraphPad Software, La Jolla, CA, USA). A non-compartmental analysis on the PK was performed using WinNonLin (Certara, Princeton, NJ).
Immunogenicity testing for the detection of anti-rHuPH20 antibodies
This study employed a validated electrochemiluminescence (ECL) immunoassay to detect and quantify anti-rHuPH20 antibodies in plasma samples, conducted at Labcorp Bioanalytical Services. A total of 173 primary samples and 289 backup samples were received, stored at −60 to −80 °C, and handled according to the study protocol. Controls, including positive, negative, and immunodepletion controls, were used across all runs. All controls were validated within known stability parameters and prepared under controlled conditions. The assay was conducted on a 96-well streptavidin-coated plate platform, using biotin-conjugated rHuPH20 as the primary detection reagent and SULFO TAG-conjugated rHuPH20 for secondary detection. The ECL assay was conducted on the MSD platform with Sulfo-tagged reagents for precise antibody detection through relative light unit (RLU) readings. In the screening phase, samples with RLU values above the set threshold were flagged as potential positives. Confirmatory testing involved reassaying positive samples with additional controls to validate the results. Samples that confirmed positive were subsequently titered to quantify the concentration of anti-rHuPH20 antibodies. Eleven analytical runs were accepted, while three runs were rejected due to control criteria not being met. Data from rejected runs were not included in the final analysis. Nineteen samples were reassayed due to normal tier escalation. Fourteen of the nineteen initially screened positive samples confirmed positive. The analysis confirmed a low incidence of ADA development.
Pharmacokinetics analysis
A two-compartment model was developed using NONMEM version 7.5 (ICON Clinical Research LLC, Blue Bell, PA, USA) for population pharmacokinetic analysis. The non-linear mixed effect model (NLME) approach was utilized to account for inter-individual variability. R® V4.4 (or higher), along with a comprehensive R archive network and Certara packages, was used for dataset preparation, exploratory data analysis, visualization, and calculation of individual Bayesian posterior exposure levels.
Population pharmacokinetic model
The pharmacokinetic model development for CAP256V2LS involved analyzing data from participants who had received at least one dose of CAP256V2LS and had one measurable concentration sample (n = 57, Fig. 4). Concentrations below the lower limit of quantitation (BLQ) were excluded. Initially, data exploration guided the structural model development, using standard statistical criteria such as the −2 log-likelihood and graphical diagnostics, including plots of observed vs. predicted values. A stepwise covariate analysis was performed to identify factors influencing CAP256V2LS PK. Continuous covariates were scaled relative to the median value, while categorical covariates were referenced against the most common group. The stepwise forward addition and backward elimination procedure with predefined significance levels (0.05 for inclusion and 0.01 for removal) helped refine the model, ensuring physiologically and pharmacologically relevant covariates were included. The final model was assessed using standard diagnostic plots and visual predictive checks, simulating concentration-time profiles based on 1000 replicates for comparison with observed data to validate the model’s predictive accuracy.
Anti-drug antibody assay
A three-tiered approach was used to evaluate ADAs using an MSD ECL bridging assay (tiers 1 and 2) and a neutralization assay (tier 3). Briefly, for the tier 1 assay, we incubated serially diluted sera with a fixed amount of SULFO TAG CAP256V2LS or VRC07-523LS and corresponding biotinylated CAP256V2LS or VRC07-523LS. The mixture was added to streptavidin-coated MSD plates and analyzed with an MSD Sector instrument. ECL intensity higher than the pre-determined positivity cut-off point was considered positive. Positive sera were then evaluated in the tier 2 assay, where samples were pre-incubated with and without unlabeled CAP256V2LS or VRC07-523LS and evaluated for a reduction of ECL intensity. We used a tier 3 confirmatory HIV-1 neutralization assay to functionally characterize samples that were tier 2 positive. For this assay, we added unlabeled CAP256V2LS or VRC07-523LS to the serum sample at the antibody IC80 concentration of the DU156·12 pseudovirus. Any neutralization readout lower than 50% neutralization by the spiked sample was reported to have functional ADA.
Statistics and reproducibility
The CAPRISA 012B study was divided into four distinct groups evaluating different administration strategies for bNAbs (Fig. 4). CAP256V2LS and VRC07-523LS were delivered subcutaneously, both with and without recombinant human hyaluronidase (ENHANZE™ Drug Product, or EDP).
Group 1 involved a dose-escalation of CAP256V2LS administered intravenously. Group 2 assessed subcutaneous dose-escalation of CAP256V2LS. Group 3 evaluated the subcutaneous co-administration of CAP256V2LS and VRC07-523LS in a dose-escalation format. Detailed findings for these groups have been reported by Mahomed et al.6
In Group 4, participants received fixed doses of antibodies with or without EDP, divided into three subgroups: 1200 mg CAP256V2LS or placebo (4a), 1200 mg VRC07-523LS or placebo (4b), and 1200 mg CAP256V2LS followed by 1200 mg VRC07-523LS or placebo (4c). Each subgroup included five participants in a 4:1 ratio of active treatment to placebo.
Participants were excluded based on factors relating to retention, clinical decision, and declined enrollment (Fig. 4).
Summary statistics were presented as medians and interquartile ranges for continuous variables, while categorical variables were summarized using frequencies and percentages.