Study design
This is a descriptive, cross-sectional study, conducted at the Respiratory Viruses Unit of the Institute Pasteur of Côte d’Ivoire. This unit houses the World Health Organization (WHO) National Reference Laboratory for influenza and other respiratory viruses. We analyzed the epidemiological data and biological samples from the national sentinel influenza surveillance network. The network was built according to WHO guidelines [16] and consists of nine health centers located in health areas covering a population of approximately 1.9 million inhabitants. These sites are located in several geographical areas of the country (Supplementary Fig. 1), and data was collected during the period between January 1 st, 2013 and December 31 st, 2015.
Study population
Each sentinel site recruited five patients per week, who met the influenza-like illness (ILI) or severe acute respiratory infection (SARI) case definition and were 5 years of age or younger and whose guardians gave consent for the survey. All subjects with fever (temperature ≥ 38 °C) and coughing for less than 10 days were admitted as ILI cases. SARI was evoked in all subjects feeling feverish or with fever and cough, or breathing difficulties that had been going on for less than 10 days and whose condition required hospitalization. We excluded from the study children with a real-time reverse transcription-polymerase chain reaction (RT-PCR) result positive for influenza virus and RSV.
Sample and environmental data collection
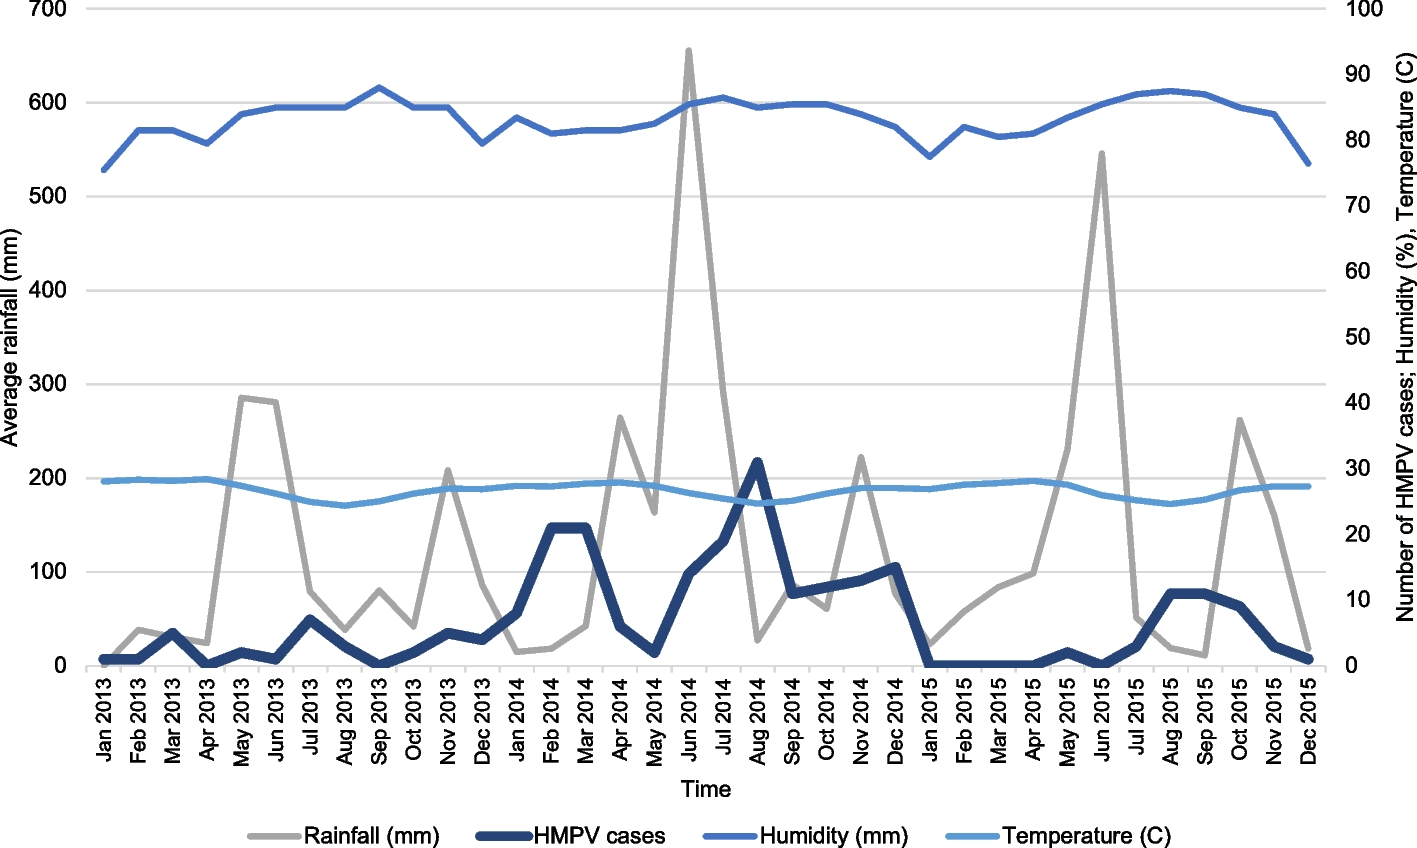
A total of 3,899 nasopharyngeal swabs were collected using the Copan Universal transport medium (UTM-RT) system. The samples were obtained during consultation or hospitalization, and were immediately stored in a cooler with a cold accumulator or a refrigerator at + 4 °C before their transfer to the reference laboratory at the Institute Pasteur. An epidemiological fact sheet with demographic data, patient history, signs of severity, and risk factors for influenza infection was completed for all subjects included in the study, as samples were obtained as part of the national influenza sentinel surveillance framework. For each site, climate data (temperature, humidity, and rainfall) were collected from the Société d’Exploitation et de Développement Aéroportuaire, Aéronautique et Météorologique (SODEXAM) in order to determine the correlation between positive cases of hMPV and these different climatic parameters.
Statistical analysis
Data management and analysis were performed using R software (version 2.15.1) after initial data entry in Epi-info® (version 3.5). Descriptive statistics were used to summarize the data; quantitative variables were described by their medians, while categorical variables were presented as counts and proportions.
To analyze associations between categorical variables (e.g., hMPV positivity by sex, age group, or clinical presentation), the chi-square (χ2) test or Fisher’s exact test was used as appropriate. The relationship between monthly hMPV case counts and climatological factors (temperature, humidity, rainfall) was assessed using Spearman’s correlation and a multiple linear regression model. A p-value < 0.05 was considered statistically significant for all tests.
RNA extraction and real time RT-PCR for hMPV detection
RNA was extracted from 200 μL of the collected nasopharyngeal secretion in Universal Transport Medium (UTM-RT). Extraction was performed using the QIAamp Viral RNA Mini kit (QIAGEN®, Hilden, Germany) as per the manufacturer’s instructions with RNA elution into a final volume of 80 μL of AVE buffer. Nuclease-free water was included for each extraction run as a negative control. Two aliquots of each extracted RNA sample were made, one of the aliquots was used for RT-PCR targeting the N gene of hMPV, and the second was stored at −20°C for future analyses.
The master-mix for RT-PCR was made with the Invitrogen™ SuperScript™ III Platinum™ Kit One-step quantitative RT-PCR System with the following primers and probes:
-
Fwd-5’-ATGTCTCTTCAAGGGATTCACCT-3’,
-
Rev-5’-AMAGYGTTATTTCTTGTTGCAATGATGA-3’,
-
Pr-(JOE) -5’-CATGCTATATTAAAAGAGTCTCARTAC-(BHQ-1) -3’.
The cycling conditions were 30 min (min) at 50 °C, 2 min at 95 °C, 45 cycles of 15 s (s) at 95 °C, 15 s at 55 °C, and 15 s at 55 °C; and a final incubation at 55 °C for 10 min.
Amplification and sequencing of the F and G genes
Conventional RT-PCR was also used to amplify a fragment of the F and G gene open reading frames (ORFs) of 243 positive samples obtained by real time PCR, from hMPV samples. The amplification RT-PCR was performed using the Qiagen One-Step RT-PCR kit (Qiagen) as per the manufacturers’ instructions, using the following primer sequences:
-
F gene Fwd-5’-CAATGCAGGTATAACACCAGCAATATC-3’,
-
F gene Rev-5’-GCAACAATTGAACTGATCTTCAGGAAAC-3’ [17].
-
G gene Fwd-5’-GAGAACATTCGRRCRATAGAYATG-3’ [18].
-
G gene Rev-5’-AGATAGACATTRACAGTGGATTCA-3’.
Thermocycling was performed following reverse transcription at 50 °C for 30 min, PCR activation at 94 °C for 15 min, 40 cycles of denaturation at 94 °C for 30 s, annealing at 55 °C for 1 min, extension at 72 °C for 1 min, followed by a final extension at 72 °C for 10 min. All PCR products were visualized using the flashgel system of Lonza® with 1.5% agarose gel. Sequencing was performed in both directions using an ABI 3500 XL Genetic Analyzer with BigDye terminators (Applied Biosystems) at a contract sequencing facility (Genewiz sequencing, Germany). The complete genome sequences of the reference prototypes of each lineage were available in GenBank (under the accession numbers AF371337 [A1], FJ168779 [A2], AY525843 [B1] and FJ168778 [B2]).
Dataset assembly
In order to supplement the Côte d’Ivoire hMPV datasets of 20 F gene lineage A, 43 F gene lineage B, 21 G gene lineage A, and 29 G gene lineage B sequences, we retrieved all available hMPV sequences from GenBank on September 6, 2019, that were annotated with location and collection date. This initial background dataset consisted of 2,345 F and 1,554 G sequences.
The sequence were aligned using MAFFT v7.409 [19] and subsequently manually inspected in AliView v1.25. During manual editing, one Côte d’Ivoire sequence was removed from the G gene dataset because of a duplication not seen in other Côte d’Ivoire or background sequences. We also removed 145 nucleotides (nt) from G2403 and G357 in the G: B2 dataset out of concern that the 145-nt were the result of recombination [20].
We noted the 180-nt and 111-nt duplications in G gene samples reported by Saikusa et al. [21] and preserved them in the initial G gene alignments. Any background sequences that were noted as nonfunctional in their GenBank entries or had premature stop codons that would likely impair function were also removed.
Because the Côte d’Ivoire sequences are fragments, we trimmed the total dataset of each gene to match the length of the Côte d’Ivoire sequences. The F dataset was trimmed to 686-nt positions and the G dataset to 868-nt positions. After each dataset was trimmed, we removed samples shorter than 75% of the length of the longest sequence.
After editing the alignments, maximum-likelihood (ML) trees were inferred using RAxML v7.2.6. [22] incorporating a general time reversible (GTR) model of nucleotide substitution with a gamma-distributed (Γ) rate variation among sites. We investigated the temporal signal of the datasets using TempEst [23]. A few background sequences showing incongruent temporal patterns were excluded (Supplementary Fig. 2). In order to confidently identify clades within each gene, each ML tree was run with 5,000 bootstrap replicates. We extracted clades encompassing the Côte d’Ivoire samples at nodes with high bootstrap support (> 70%). In the F gene ML tree, we identified three clades of interest (A, B1, B2; Supplementary Fig. 3) and in the G gene ML tree, four clades (A, B Early, B1, and B2) were selected. The “B Early” clade was designated to describe a phylogenetically distinct group of G gene sequences that could not be classified within the canonical B1 or B2 clades. As shown in the phylogenetic tree (Supplementary Figure S4), this clade occupies a basal position relative to the other B lineages, meaning it diverges from the main trunk of the B genotype before the common ancestor of the B1 and B2 clades. The name “B Early” was therefore chosen to reflect this early-diverging characteristic. We extracted the sequences for each new tree to create “gene: clade” specific datasets, which were subsequently aligned and manually edited. Duplicate sequences with identical countries, collection dates, and nucleotide sequences were removed (Supplementary Figs. 5–8). Specific to the G: A dataset, the region caused by the 180-nt insertion, encompassing the 111-nt insertion, was removed. We used RAxML to generate “gene: clade” ML trees which were examined in TempEst for outliers (see Fig. 2 below).
Phylogenetic analysis
To reconstruct the evolutionary history and spatial diffusion of the virus, we employed a Bayesian phylogenetic and phylogeographic framework for each of the “gene: clade” datasets separately using the high-performance computational capabilities of the Biowulf Linux cluster at the National Institutes of Health, Bethesda, MD, USA (http://biowulf.nih.gov). Evolutionary rate variation across lineages was accounted for using an uncorrelated relaxed molecular clock model with branch rates drawn from a log-normal distribution. Changes in the viral effective population size (Ne) over time were inferred using a Skygrid demographic prior [24]. Nucleotide substitution was modeled using a general time reversible (GTR) model with gamma-distributed rate variation among sites. For sequences where only the year of collection was available, tip dates were accommodated by uniform sampling within a one-year window (January 1 st to December 31 st).
Markov chain Monte Carlo (MCMC) analyses were conducted using BEAST v1.10.4, with computational performance enhanced by the BEAGLE library [25]. Each dataset was analyzed in at least three independent MCMC runs of 400 million iterations, with sampling every 40,000 iterations. Convergence of all parameters was assessed visually using Tracer v1.7.1, and statistical uncertainty was quantified using 95% highest posterior density (HPD) intervals. A burn-in of at least 10% was applied to each chain.
Given the independent modeling of the diffusion and substitution processes, we adopted a two-step inference approach. First, we focused on the sequence evolution process to generate an empirical distribution of phylogenetic trees. Subsequently, this distribution of trees was used as a condition for inferring the discrete location diffusion process. A subset of 500 trees was randomly selected from the combined posterior distribution of trees to represent the empirical distribution for spatial diffusion analysis [26].
Spatial diffusion dynamics among specified countries were estimated for each “gene: clade” dataset using a Bayesian discrete phylogeographic approach [27]. This approach models location transitions as a continuous-time Markov chain (CTMC) process, allowing for the inference of ancestral location states. A nonreversible CTMC model [28] was employed, and Bayesian stochastic search variable selection (BSSVS) was incorporated to identify a sparse set of significant transition rates, representing epidemiological connectivity [29]. Furthermore, Markov jump histories for location traits were mapped across the posterior tree distribution using stochastic mapping techniques [30], and the number of jumps was summarized.
Maximum clade credibility (MCC) trees were generated using Tree Annotator v1.10.4, and visualizations were produced using FigTree v1.4.3.