The viaduct will replace two cast-iron bridges that were built by Joseph Butler & Co in Leeds in 1847.
While the Victorian bridges have been deemed no longer suitable for use, they are Grade II listed and will remain in place when the new viaduct opens.
The new nine-span structure is being manufactured from Corten steel, a high-strength material that develops a rusty brown colour and does not need continuous painting.
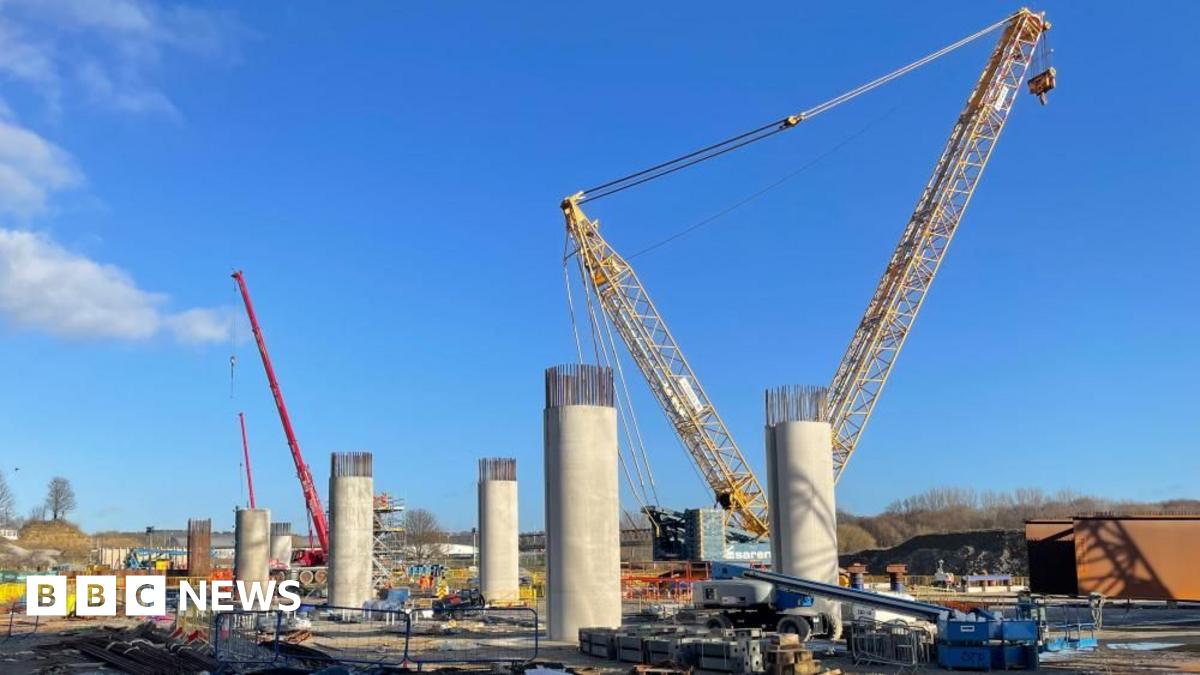
A 12,000-tonne crane is being used to swing each individual span into position on eight supporting pillars.
Close to the viaduct, Ravensthorpe Station has been closed by Network Rail as part of the upgrade work.
The station is being rebuilt at a nearby location so more trains can stop there and will include a footbridge with lifts, a new forecourt and improved drop-off facilities. It will reopen in March 2028.
Network Rail’s Transpennine Route Upgrade, which is due to be completed in the early 2030s, will see the line between York and Manchester fully electrified.