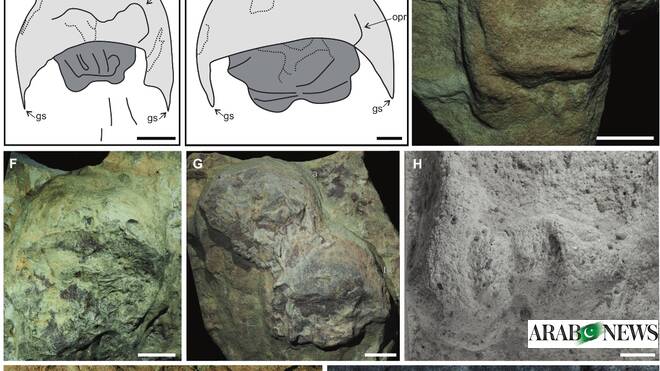
As the second leading cause of death globally, cancer is a worldwide health crisis, particularly as life expectancies continue to increase. In its final stages, cancer spreads throughout the body in a process known as metastasis. Here, the cancer cells enter the circulatory system, moving to various distal sites where they cause the formation of new tumors. Metastasis accounts for a vast majority of cancer-related deaths, but the molecular machinery driving this behavior is still poorly understood.
The cytoskeleton is a critical component of cancer cell migration and is broadly involved in cell structure and motility. The formation of actin filaments (F-actin), in particular, is a notable driver of cell motility, and the presence of F-actin structures can serve as a biomarker of cell migration. Actin filaments can also be used as an indicator of cell necrosis, as the loss of membrane integrity causes F-actin to become exposed.
3D insights into the behavior of cytoskeletal F-actin
Previous investigations of F-actin in cancer cells were largely performed in 2D, providing relatively limited information, since cell processes ultimately occur in 3D. Tumors in particular can be challenging targets for such approaches, as they are heterogeneous, and 2D cross-sectional visualization may not provide a complete picture of the cellular dynamics at play. Therefore, an accurate molecular understanding of the cytoskeleton’s role in metastasis would necessitate imaging techniques that capture volumetric data.
A recent study from the Vienna University of Technology, Austria, used light sheet fluorescence microscopy (LSFM) to examine cytoskeletal changes in spheroids composed of either colorectal cancer (CRC) or non-small cell lung carcinoma (NSCLC) cells in 3D. The 2D data measured with this technique were deconvoluted in NeuroDeblur (MBF Bioscience) and reconstructed into a 3D representation using Thermo Scientific Amira Software, which revealed intricate internal and external tissue structures.
F-actin filaments in a colorectal cancer cell spheroid, captured with light sheet fluorescence microscopy. 70 images were captured through a 90-µm thick sample. b-g) Cross-sectional images taken at 15-µm intervals. Image Credit: Figure reproduced from Prado-López et al. under CC-BY 4.0.
Light sheet fluorescence microscopy
Light sheet fluorescence microscopy uses a laser to trigger fluorescence through a cross-section of a sample. When this is done at discreet intervals throughout an entire sample volume, precise optical sectioning of the specimen becomes possible, producing a data series that can be deconvoluted and stacked into a 3D volume.
Prado-López et al. used this approach to analyze cancer-cell spheroids produced from CRC and NSCLC specimens. They found that the internal structures of the cells exhibited sufficient autofluorescence for differentiation and segmentation. In particular, F-actin structures could be clearly identified, along with quantification of their intensity in individual cells (see below).
F-actin distribution (a) and quantification (b) in five colorectal cancer cells. Image Credit: Figure reproduced from Prado-López et al. under CC-BY 4.0.
Quantitative analysis through Amira Software segmentation also allowed F-actin intensity to be correlated to CRC and NSCLC cell necrosis. Six distinct regions were identified and mapped to different cellular states, such as proliferation, senescence, and necrosis.
Insights and future direction
F-actin polymerization, which leads to cell stiffening, correlates with increased cell mobility. Prado-López et al. found they could directly observe this F-actin behavior in a more physiologically relevant, 3D context.
Subsequent segmentation in Amira Software provided a quantitative analysis of F-actin distribution. This approach is an exciting step forward in our ability to view cancer cell mobility and metastasis at a molecular level. These insights will enhance our understanding of this process and provide avenues for potential intervention and treatment.
Learn more about visualization and segmentation of biological data at thermofisher.com/amira
References
- American Cancer Society (2024) Global Cancer Facts & Figures. 5th Edition. Availabele at: https://www.cancer.org/content/dam/cancer-org/research/cancer-facts-and-statistics/global-cancer-facts-and-figures/global-cancer-facts-and-figures-2024.pdf.
- Wise, J. (2024). Global life expectancy to increase by almost five years by 2050, study predicts. BMJ, (online) 385, p.q1126. https://doi.org/10.1136/bmj.q1126.
- Geijtenbeek, Teunis B.H. (2012). Actin’ as a Death Signal. Immunity, 36(4), pp.557–559. https://doi.org/10.1016/j.immuni.2012.04.004.
- Prado-López, S., et al. (2025). Cytoskeleton imaging of colorectal and lung cancer spheroids using light sheet microscopy. BJC Reports, 3(1). https://doi.org/10.1038/s44276-025-00144-3.
- Olson, M.F. and Sahai, E. (2008). The actin cytoskeleton in cancer cell motility. Clinical & Experimental Metastasis, 26(4), pp.273–287. https://doi.org/10.1007/s10585-008-9174-2.
Sponsored Content Policy: News-Medical.net publishes articles and related content that may be derived from sources where we have existing commercial relationships, provided such content adds value to the core editorial ethos of News-Medical.Net which is to educate and inform site visitors interested in medical research, science, medical devices and treatments.