Literature search results
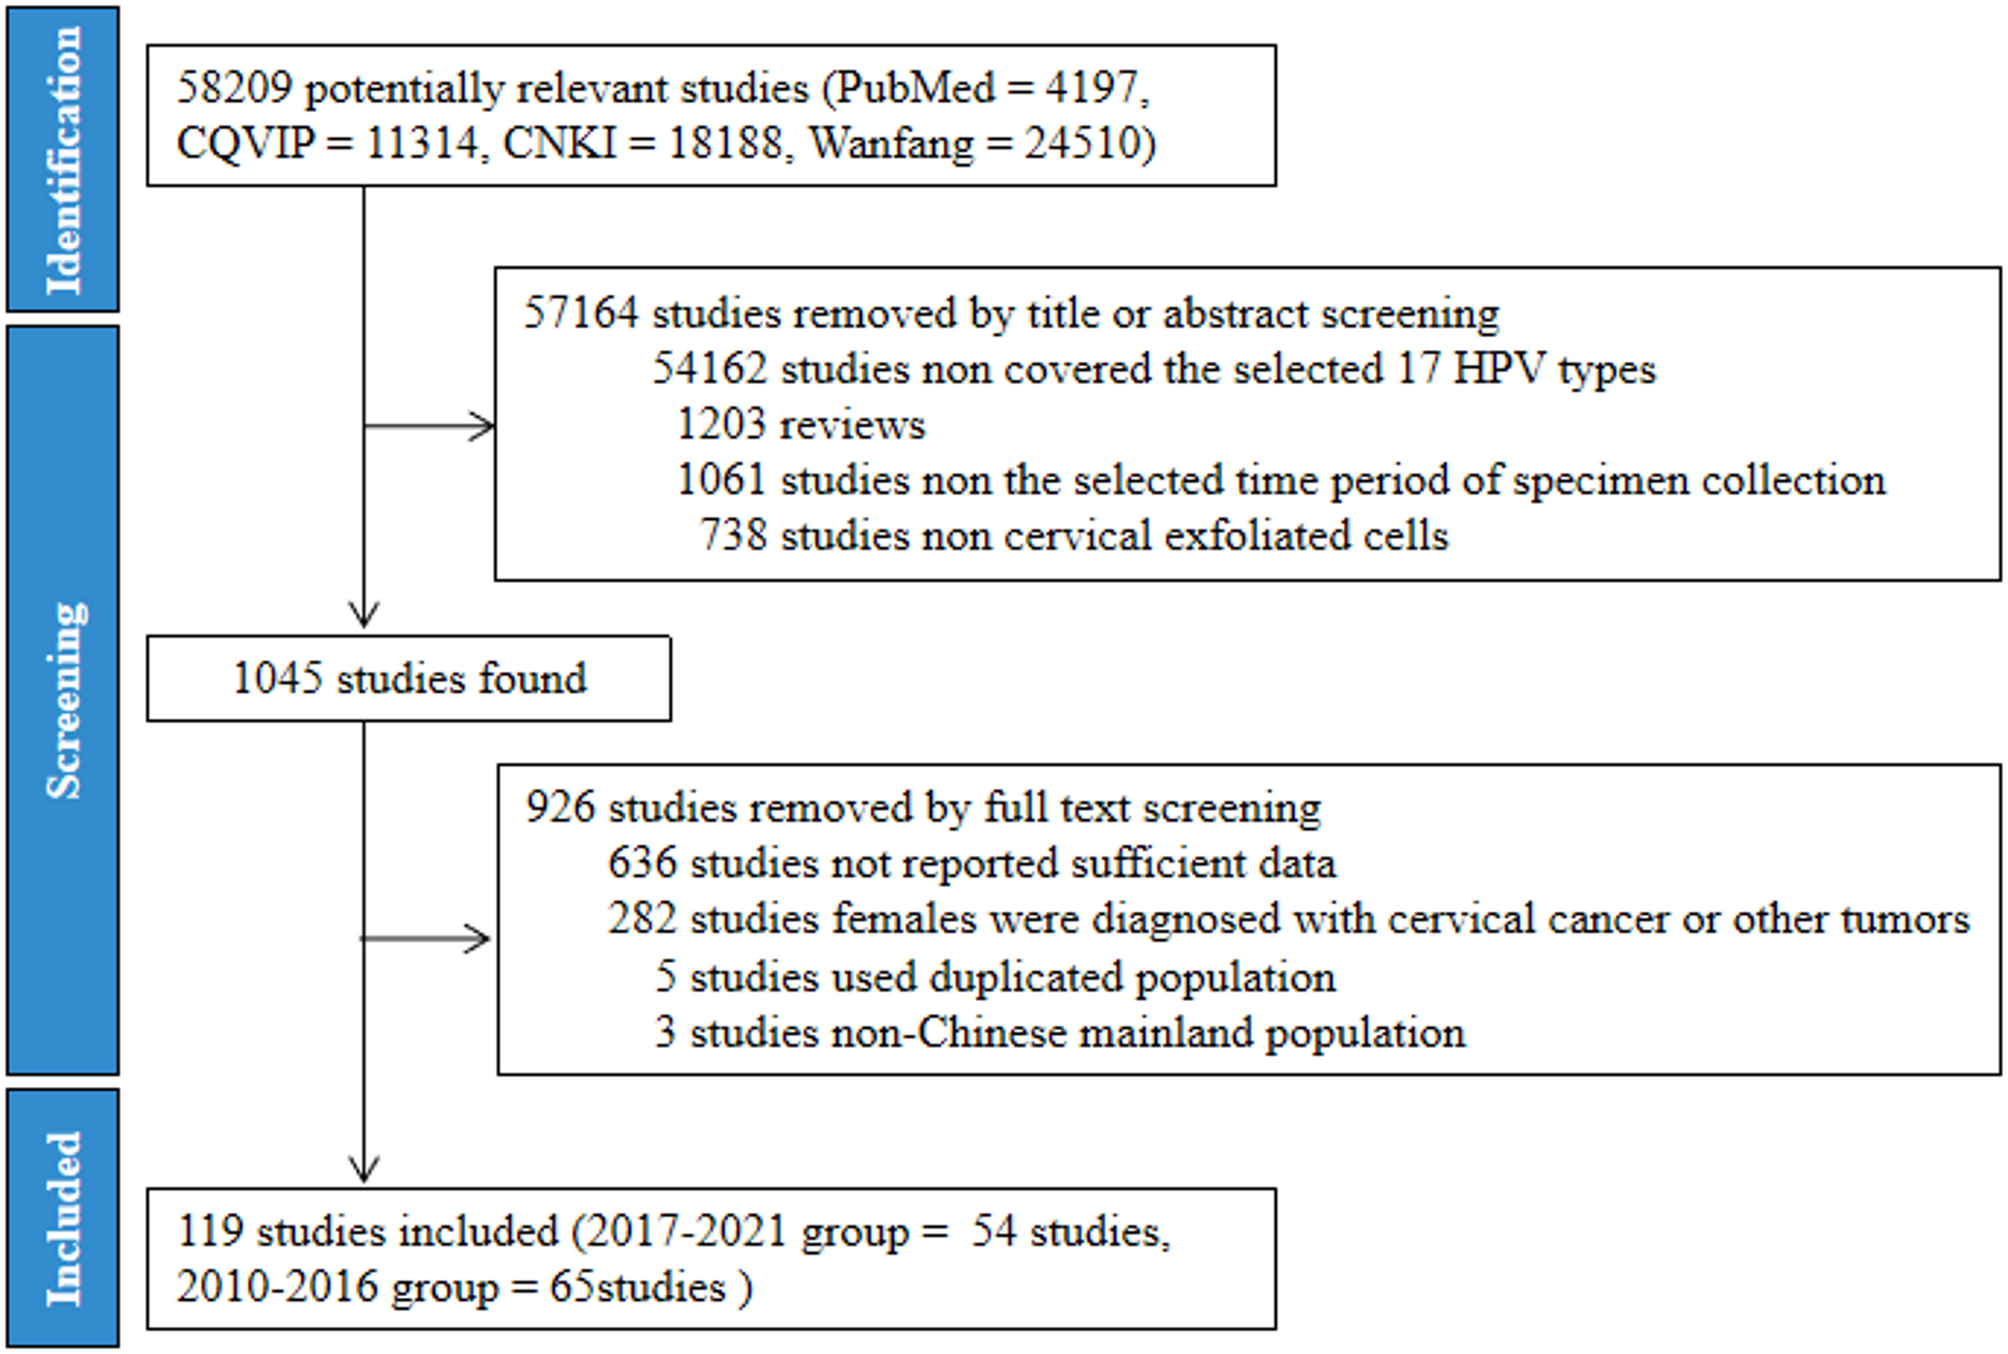
A total of 58,209 potentially relevant studies were found through searching the PubMed, CQVIP, CNKI, and Wanfang databases. The process of study inclusion was summarized in Fig. 1. Briefly, all potentially relevant studies were screened by reading the title and abstracts. And 57,164 studies were removed in this step. Subsequently, 926 studies were excluded after the full text were read. Ultimately, there were 119 studies containing 1,073,296 females from mainland China were included in the study. In detail, there were 54 studies containing 462,125 females from 31 regions in 2017–2021 (Table S2) and 65 studies containing 611,171 females from 30 regions in 2010–2016 (Table S3). There were no suitable studies on the prevalence of HPV infection in Tibet from 2010 to 2016.
Flow chart of literatures selection using PRISMA guidelines
Temporal changes in total prevalence of HPV infection between 2010-2016 and 2017–2021
A total of 17 HPV types were selected for the study, including 15 HR-HPVs (HPV16, 18, 31, 33, 35, 39, 45, 51, 52, 53, 56, 58, 59, 66, 68) and 2 LR-HPVs (HPV6, 11). The total prevalence of the 17 selected HPV types in 2017–2021 was 26.06% (120,448/462,125) which was significantly higher than the 23.20% (141,803/611,171) in 2010–2016 (P < 0.001), suggesting a potential upward trend in the HPV types over time. In the 2017–2021 group, Jilin, Beijing, Tibet, Heilongjiang and Guangxi ranked in the top 5 in terms of the total prevalence of the 17 selected HPV types, with the prevalence ranging from 33.61% to 46.40%. The total prevalence of the 17 selected HPV types in 2017–2021 significantly increased in 11 regions (Beijing, Jiangxi, Chongqing, Inner Mongolia, Zhejiang, Sichuan, Hunan, Hainan, Guangxi, Liaoning and Guangdong), and decreased in 15 regions compared to 2010–2016 (P < 0.05). There was no significant difference in the total prevalence of HPV in the other 4 regions between the aforementioned two periods (Fig. 2, Table S4). In addition, Jiangxi, Beijing, Chongqing, Inner Mongolia, and Zhejiang were the regions in which the total prevalence of the 17 selected HPV types increased by more than 1.5 times, while Shandong, Qinghai, Jiangsu, Fujian, Anhui, Shaanxi, and Shanxi were the regions in which the prevalence decreased by 2/3 in 2017–2021 compared to 2010–2016 (Figure S1). Our results show that the prevention and control of HPV infection has achieved good results in some regions such as Shandong, Qinghai, Jiangsu, Fujian, Anhui, Shaanxi, and Shanxi. However, our data also suggest that more attention should be given to regions with high or significant increases in HPV prevalence in the future, such as Jilin, Beijing, Tibet, Heilongjiang, Guangxi, Jiangxi, Chongqing, Inner Mongolia and Zhejiang.
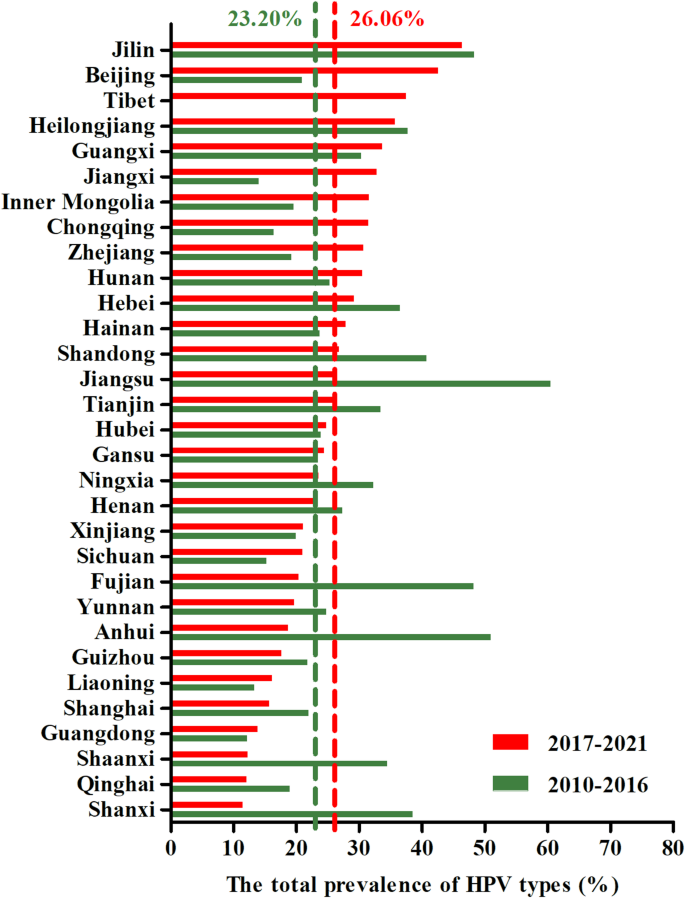
Comparison of the total prevalence of the 17 selected HPV types between 2010–2016 and 2017–2021 in various regions of mainland China. 17 HPV types: including 15 HR-HPVs (HPV16, 18, 31, 33, 35, 39, 45, 51, 52, 53, 56, 58, 59, 66, 68) and 2 LR-HPVs (HPV6, 11)
Comparison of the national prevalence of each selected HPV type between 2017-2021 and 2010–2016
To determine the changes of HPV infection, the national prevalence of each selected HPV type was calculated and analyzed (Table S5, Figure S2). Our results showed that the national prevalence of HPV51, 59, 53, 56, 39, 45, 66, 52, 35, 68 and 58 was significantly greater in 2017–2021 than in 2010–2016 (P < 0.001). However, there were 4 HPV types—HPV33, 16, 6 and 11—with a significantly lower national prevalence in 2017–2021 than in 2010–2016 (P < 0.05). No significant difference in the national prevalence of HPV 31 and 18 was observed between the two periods. In addition, among the 17 selected HPV types, HPV 52, 16, 58, 53, and 51 ranked in the top 5 in 2017–2021 (Fig. 3), and the national prevalence rates were 4.15%, 3.82%, 2.86%, 2.12%, and 1.65%, respectively. Among the top 5 infected HPV types in 2017–2021, the national prevalence of non-vaccine-covered HPV53 and 51 accounted for 3.77%. The national prevalence of HPV 16, 52, 58, 53 and 18 ranked among the top 5 HPV types from 2010-2016 (Table S5), which was different from that from 2017-2021.
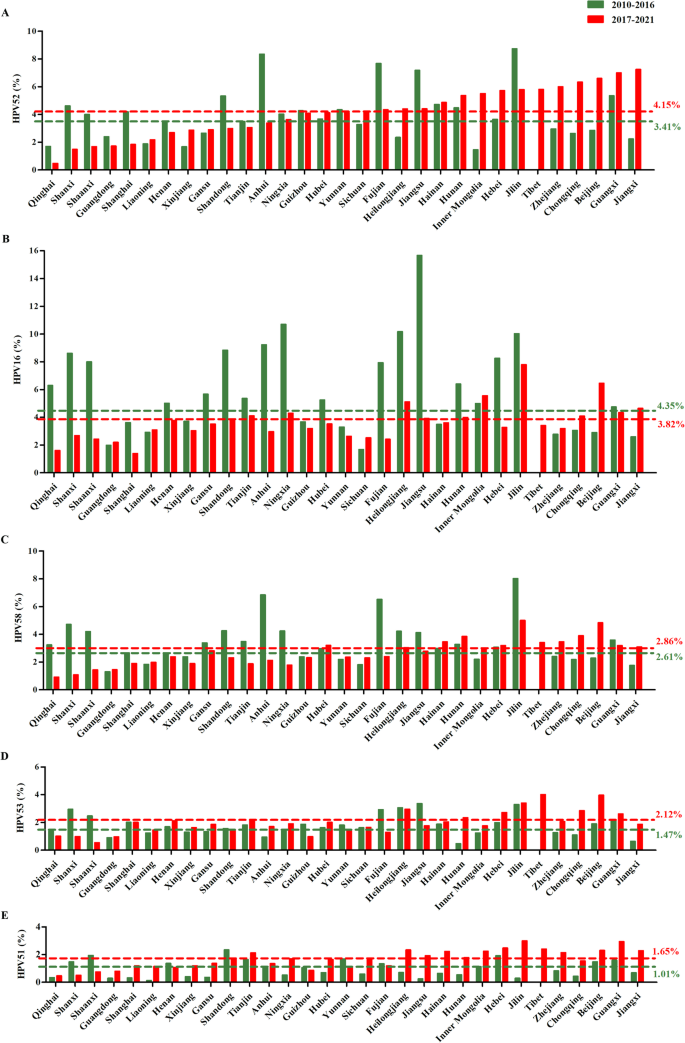
Comparison of the prevalence of the top 5 common HPV types between 2010–2016 and 2017–2021 in different regions of mainland China
Geographic distribution and temporal changes in the prevalence of HPV types targeted by bivalent, quadrivalent and nine-valent HPV vaccine
In order to investigate the effect of the HPV vaccine, the geographic distribution and changes in the prevalence of HPV types targeted by bivalent, quadrivalent and nine-valent HPV vaccine were analyzed. HPV16 and 18 (2-HPV type) are the HPV types targeted by bivalent HPV vaccine. The national prevalence of the 2-HPV type in 2017–2021 was 5.01%, which was a 10.05% reduction compared to that in 2010–2016 (P < 0.001) (Fig. 4A and B). For the prevalence of the 2-HPV type, 66.67% (20/30) of the regions decreased significantly in 2017–2021 compared to 2010–2016 (P < 0.05). However, there were 5 regions (Beijing, Jiangxi, Chongqing, Guangdong and Zhejiang) with opposite trends. Among these regions, Beijing and Jiangxi were the 2 regions in which the prevalence of the 2-HPV type increased by more than 1.5 times, while the prevalence decreased by 2/3 in Gansu, Heilongjiang, Shandong, Ningxia, Hebei, Shanghai, Qinghai, Fujian, Shanxi, Shaanxi, Jiangsu, and Anhui in 2017–2021 compared to 2010–2016 (Fig. 5A, Table S6). There was no difference in the prevalence of 2-HPV type in Sichuan, Inner Mongolia, Liaoning, Hainan and Xinjiang between these two periods.
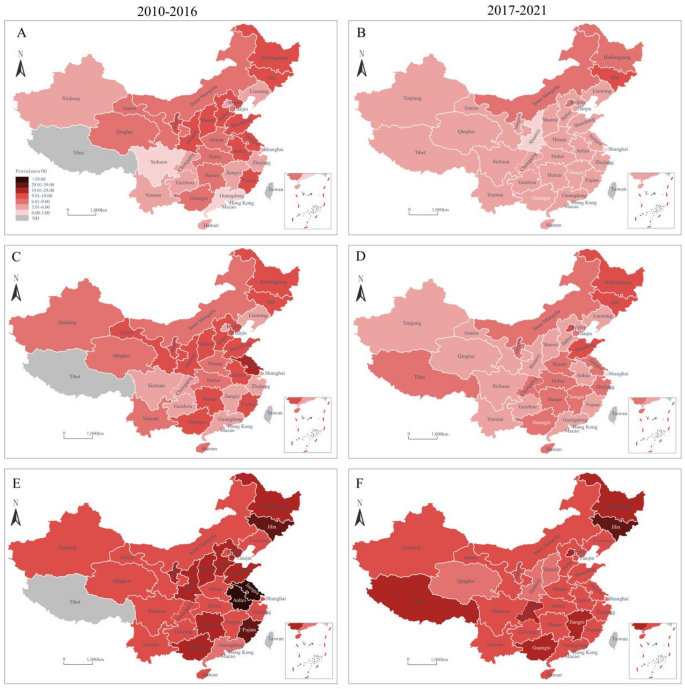
Geographic distribution in the prevalence of HPV types targeted by the bivalent, quadrivalent and nine-valent HPV vaccine in 2010–2016 and 2017–2021 in mainland China. A–B, the 2-HPV type (HPV16, 18) targeted by the bivalent vaccine; C–D, the 4-HPV type (HPV16, 18, 6, 11) targeted by the quadrivalent vaccine; E–F, the 9-HPV type (HPV16, 18, 6, 11, 31, 33, 45, 52, 58) targeted by the nine-valent vaccine; ND, no data
HPV16, 18, 6 and 11 (4-HPV type) are the HPV types targeted by the quadrivalent HPV vaccine. Similar to that of the 2-HPV type, the national prevalence of the 4-HPV type in 2017–2021 was 6.64% which was a 13.09% decrease compared to that in 2010–2016 (P < 0.001) (Fig. 4C and D). In 66.67% (20/30) of the regions the prevalence of the 4-HPV type significantly decreased, and in 7 regions (Beijing, Jiangxi, Chongqing, Guangdong, Sichuan, Zhejiang and Hainan), the prevalence significantly increased in 2017–2021 compared to 2010–2016 (P < 0.05). Beijing and Jiangxi were also the 2 regions in which the prevalence of the 4-HPV type increased more than 1.5 times in 2017–2021 compared to 2010–2016 (Fig. 5B, Table S7). Inner Mongolia, Liaoning, and Jilin were the 3 regions in which there was no difference in the prevalence of the 4-HPV type between these two periods.
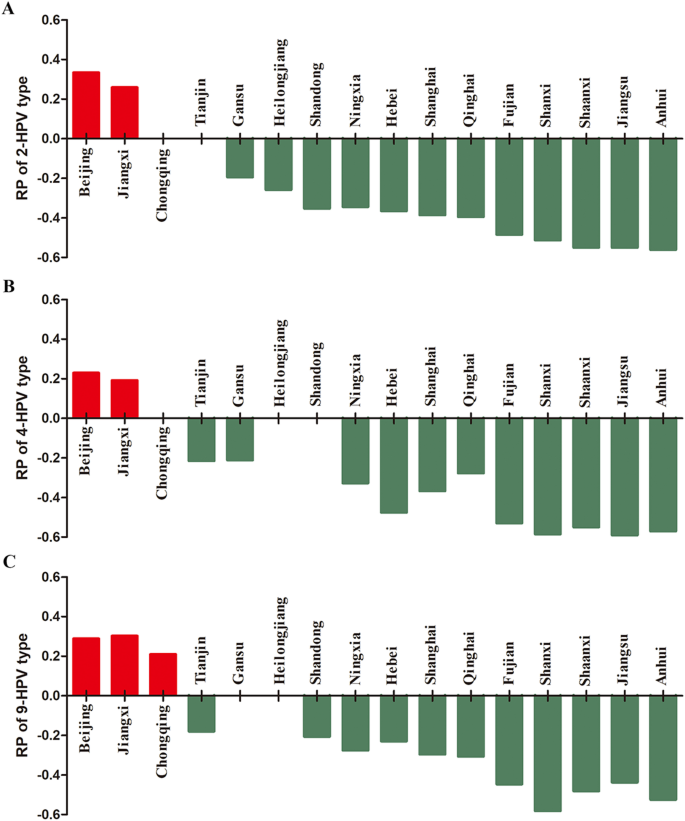
Regions in which the prevalence of HPV types targeted by the bivalent, quadrivalent, and nine-valent HPV vaccine increased by more than 1.5 times (the logarithm of the ratios were positive numbers and represented by red columns) and decreased by 2/3 (the logarithm of the ratios were negative numbers and represented by green columns) in 2017–2021 than in 2010–2016. RP: logarithm of ratio of the prevalence between these two periods. 2-HPV type, 4-HPV type and 9-HPV type: HPV types targeted by the bivalent, quadrivalent, and nine-valent HPV vaccine, respectively
HPV16, 18, 6, 11, 31, 33, 45, 52 and 58 (9-HPV type) are the HPV types targeted by the nine-valent HPV vaccine. The prevalence of HPV genotypes covered by the nine-valent HPV vaccine was 15.94%, and that of the non-vaccine-covered high-risk genotype was 10.12% in 2017–2021. Although 66.67% (20/30) of the regions had a significantly lower prevalence of the 9-HPV type in 2017–2021 than in 2010–2016 (P < 0.05), no difference was found in the national prevalence of the 9-HPV type between these two periods (P > 0.05) (Fig. 4E and F). Beijing, Jiangxi and Chongqing were the top 3 regions with the greatest increases in the prevalence of the 9-HPV type by more than 1.5 times in 2017–2021 than in 2010–2016 (Fig. 5C, Table S8).
The impact of detection methods on changes in HPV infection prevalence between 2010-2016 and 2017–2021
Given the varying sensitivities of different methods for HPV genotyping and their potential impact on estimated HPV infection prevalence, we stratified included studies by methodology and re-evaluated differences in total HPV infection prevalence, HR-HPV, LR-HPV, 2 -HPV type, 4 -HPV type, 9 -HPV type, and the top 5 common HPV types in 2017–2021 (Table S9). Methods were categorized into three groups based on their frequency of use in the literature: Polymerase chain reaction (PCR) – reverse dot blot hybridization (RDBH), PCR-flow-through hybridization (FTH), and all other methods, including PCR-based assays, hybrid capture, gene chip assays, and flow cytometry-based fluorescence methods and so on. Comparative analysis across these categories revealed consistent trends in HPV51 and HPV53 prevalence between the two time periods, irrespective of detection methodology. However, for prevalences of the total HPV, HR-HPV, LR-HPV, vaccine-targeted genotypes (2 -HPV type, 4 -HPV type, 9 -HPV type), and the five most common HPV types, observed changes exhibited marked methodological variability. These findings suggest that detection methods can influence the assessment of HPV infection prevalence, highlighting the need for standardized approaches when interpreting trends over time.