CDC6 expression profiles across cancers: tumor versus normal tissue comparison
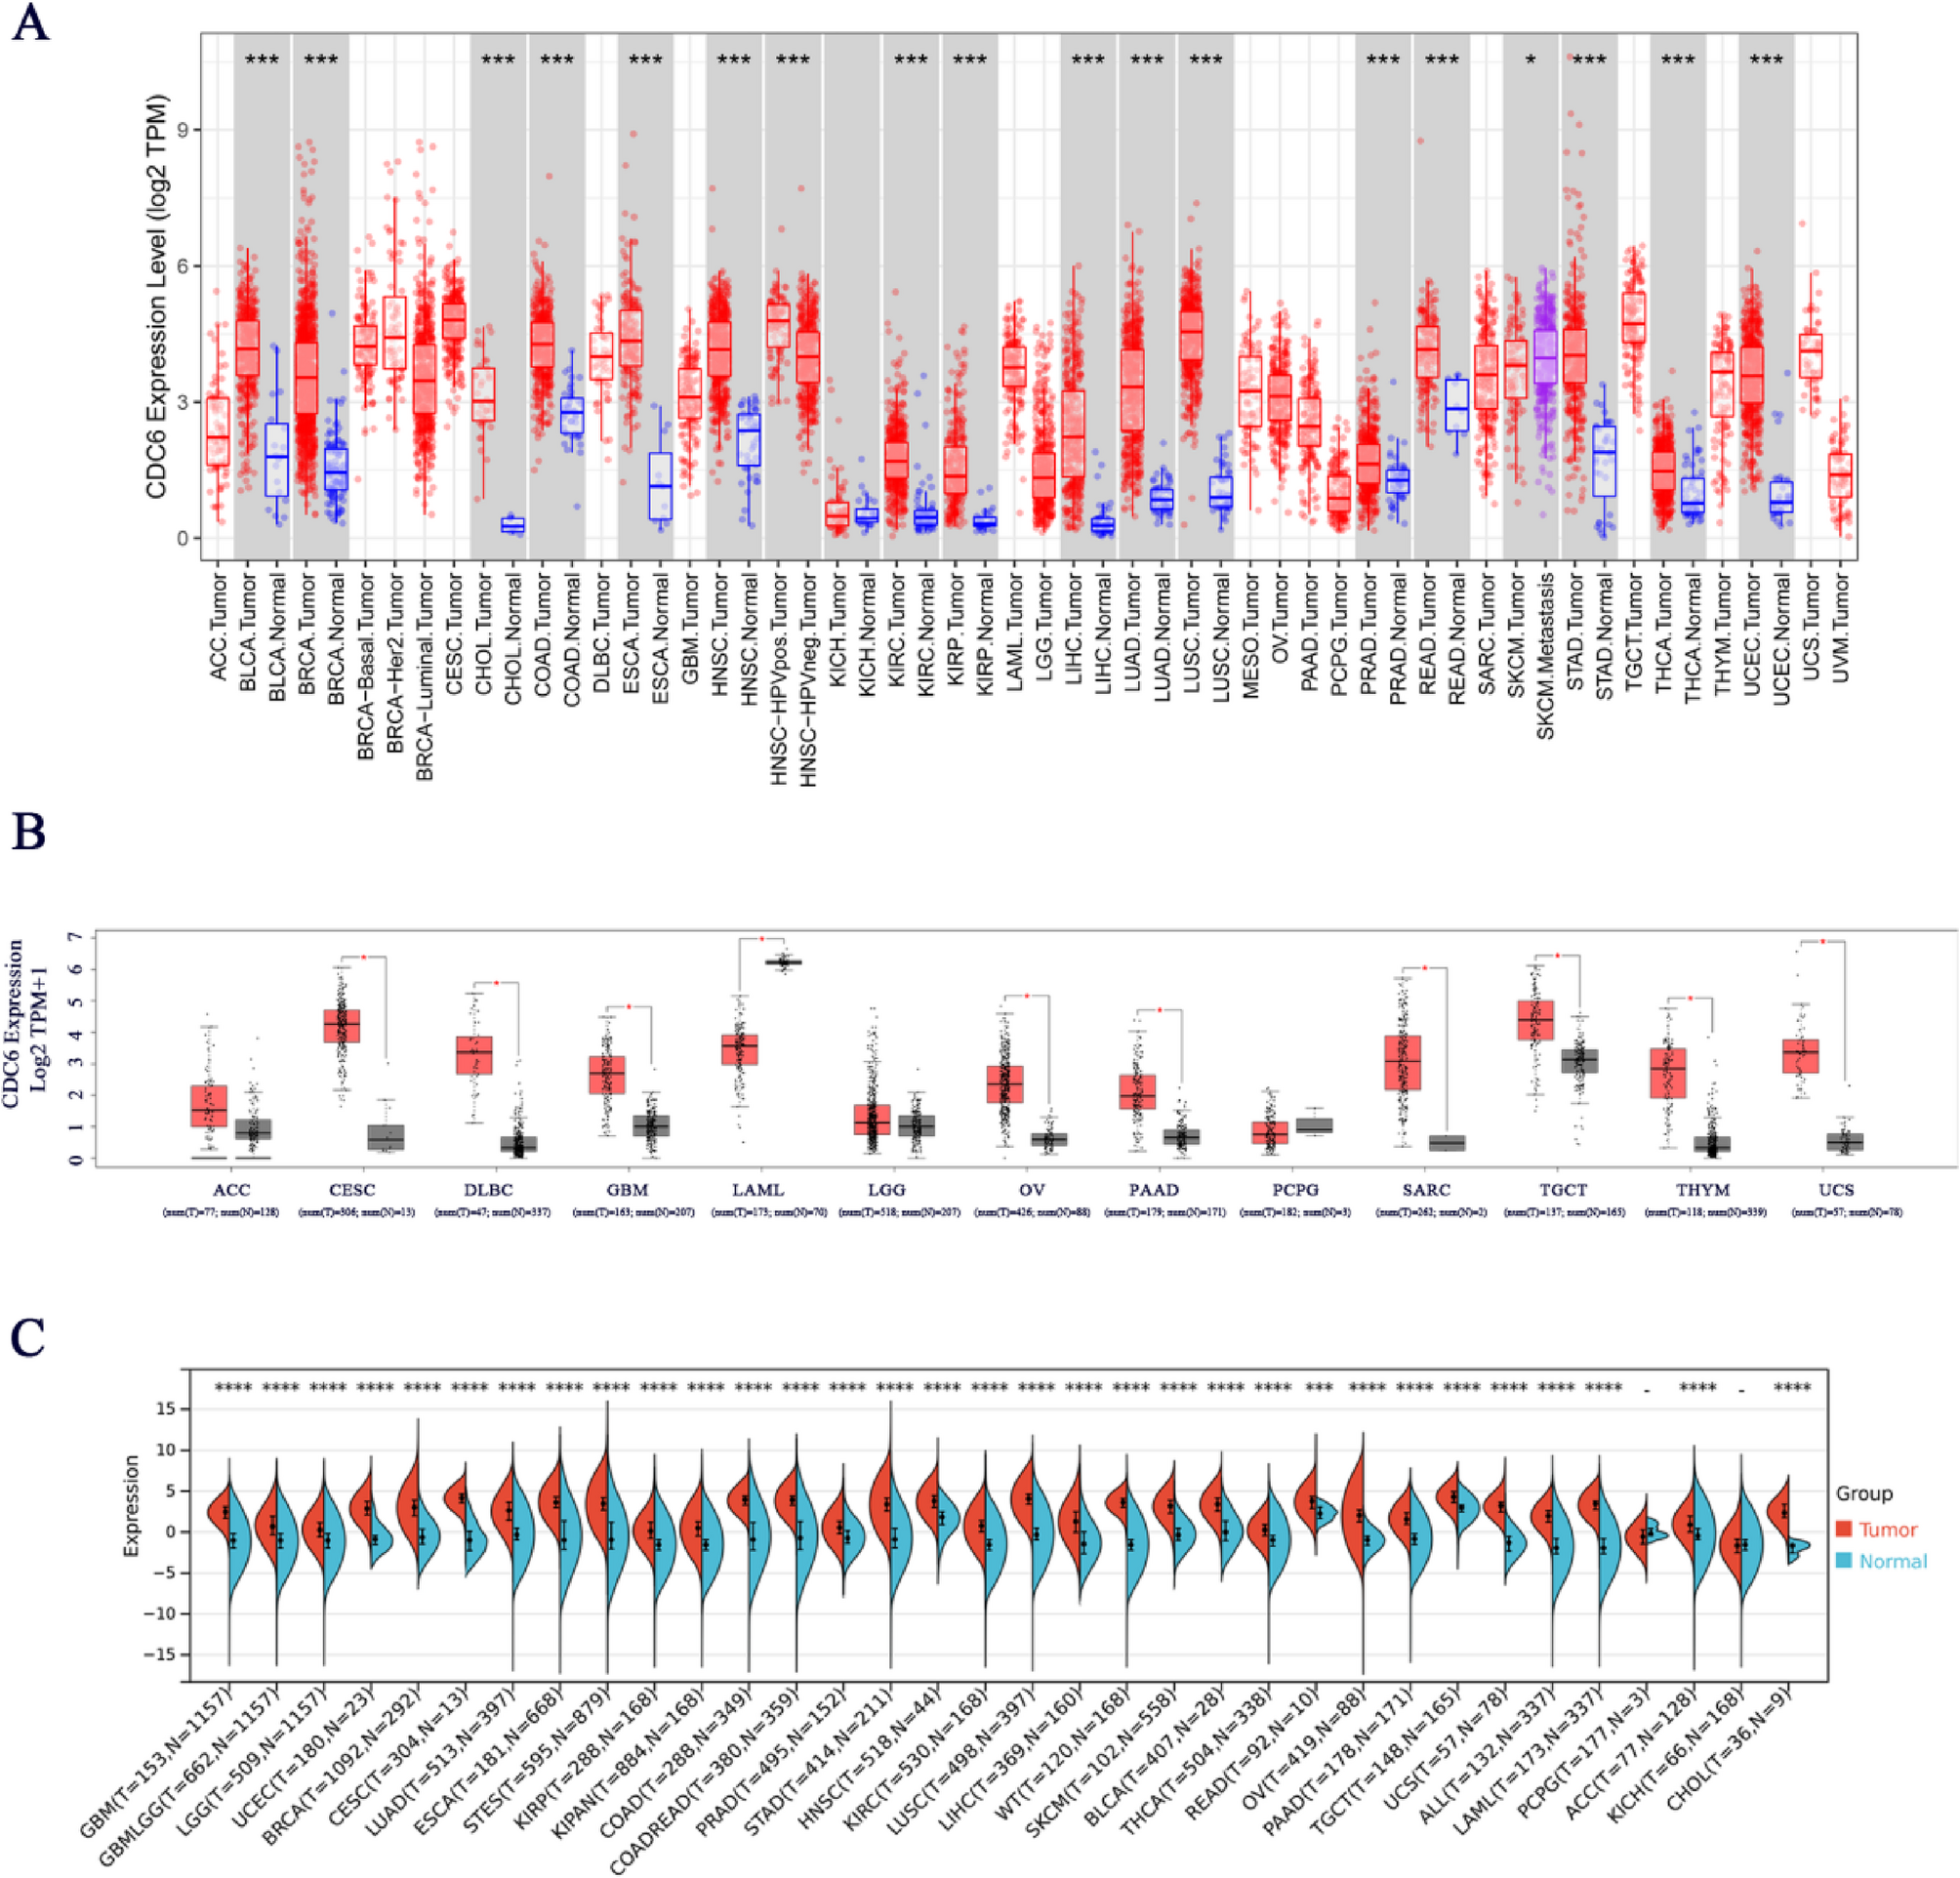
To comprehensively evaluate CDC6 expression across diverse cancer types, we initially analyzed the TCGA dataset using the TIMER 2.0 database. Our findings revealed significant upregulation of CDC6 expression in a wide range of malignancies, including BLCA, BRCA, CHOL, COAD, ESCA, HNSC, KIRC, KIRP, LIHC, LUAD, LUSC, PRAD, READ, STAD, THCA and UCEC. Notably, our analysis identified a statistically significant differential expression pattern of CDC6 in melanoma metastasis (Fig. 1A), suggesting its potential involvement in metastatic progression. To address the absence of normal control data in the TIMER 2.0 database for ACC, CESC, DLBC, GBM, LAML, LGG, OV, PAAD, PCPG, SARC, TGCT, THYM and UCS tumor types, we performed a complementary analysis using the GEPIA database, which integrates comprehensive datasets from both TCGA and GTEx. This analysis demonstrated marked upregulation of CDC6 expression in CESC, DLBC, GBM, OV, PAAD, SARC, TGCT, THYM and UCS, while revealing significant downregulation in LAML (Fig. 1B).
Cdc6 expression across various cancers. (A) CDC6 expression in different human cancers and normal tissues according to the TIMER 2.0 database. Statistical significance was indicated as *P < 0 0.05, **P < 0.01 and ***P < 0 0.001. Red, cancer tissues. Blue, normal tissues. (B) In the TCGA project, for the types of ACC, CESC, DLBC, GBM, LAML, LGG, OV, PAAD, PCPG, SARC, TGCT, THYM and UCS, we used the corresponding normal tissues from the GTEx database as controls. Red, cancer tissues. Black, normal tissues. * p < 0.05. (C) CDC6 expression in different human cancers and normal tissues according to the Sangerbox database. Red, cancer tissues. Blue, normal tissues. * p < 0.05, ** p < 0.01, *** p < 0.001
To further validate and expand these findings, we conducted a comprehensive pan-cancer analysis of CDC6 expression across 33 distinct cancer types and their corresponding adjacent normal tissues using the Sangerbox database. This analysis confirmed significant CDC6 overexpression in GBM, GBMLGG, LGG, UCEC, BRCA, CESC, LUAD, ESCA, STES, KIRP, KIPAN, COAD, COADREAD, PRAD, STAD, HNSC, KIRC, LUSC, LIHC, WT, SKCM, BLCA, THCA, READ, OV, PAAD, TGCT, UCS, ALL, LAML, ACC and CHOL (Fig. 1C). Importantly, the CDC6 expression profiles obtained from both Sangerbox and TIMER2.0 databases exhibited remarkable consistency across various tumor types, reinforcing the robustness of our findings.
To extend our investigation to the protein level, we systematically analyzed CDC6 expression in BRCA, COAD, LIHC, LUAD and PRAD compared to their corresponding normal tissues using the Human Protein Atlas (HPA) database (Fig. 2A and E). This analysis revealed distinct protein expression patterns across these cancer types, consistent with our transcriptomic findings. Furthermore, to elucidate the functional implications of CDC6 dysregulation, we investigated its subcellular localization through the HPA database (Figs. 2F-I). The results demonstrated that CDC6 predominantly localizes to the nucleoplasm and nucleolus, a finding that aligns with previous reports and suggests its potential role in nuclear processes [4]. Collectively, these multi-level analyses provide compelling evidence that CDC6 expression is dysregulated across multiple tumor types, with the most of cancers exhibiting significantly higher expression levels compared to normal tissues.
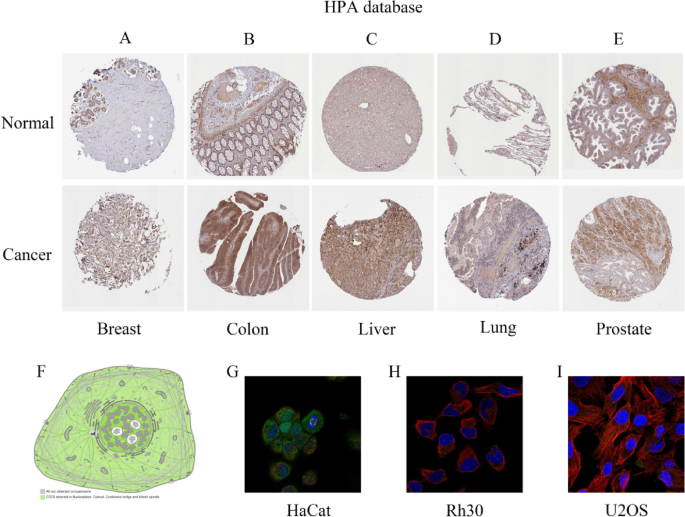
Protein expression levels and subcellular localization of CDC6 based on the HPA database. The immunohistochemical images of CDC6 protein expression in (A) Breast; (B) Colon; (C) Liver; (D) Lung; (E) Prostate. (F–I) Simulated plots and immunofluorescence plots of the subcellular localization of CDC6
Building on these findings, we further explored the association between CDC6 expression and tumor stages across various cancer types. Our analysis revealed a significant correlation between CDC6 expression levels and the tumor stages of ACC, BRCA, ESCA, HNSC, KICH, KIRC, KIRP, LIHC, LUAD, LUSC, MESO, STAD and TGCT (Fig. 3A-M). To validate these observations, we utilized the GEPIA2 database to analyze CDC6 expression in relation to major pathological stages. The results confirmed a consistent association between CDC6 expression and the stages of ACC, BRCA, KICH, KIRP, LIHC, LUAD, OV and UCS (Fig. 4A-H). These findings collectively suggest that CDC6 expression levels are closely linked to the clinical progression of these cancers and may serve as a potential biomarker for determining pathological staging in these malignancies.
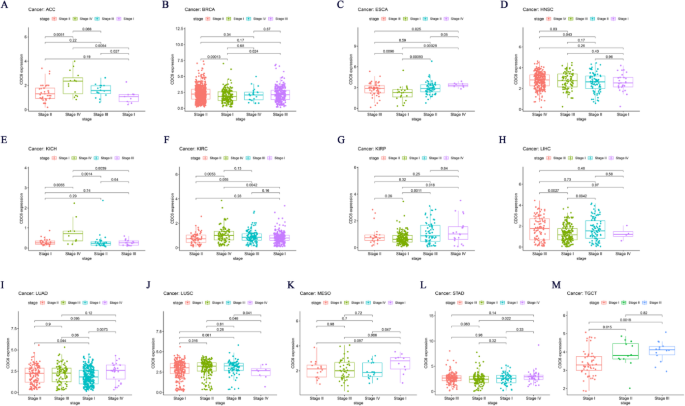
Association between CDC6 expression and tumor stage. (A) ACC; (B) BRCA; (C) ESCA; (D) HNSC; (E) KICH; (F) KIRC; (G) KIRP; (H) LIHC; (I) LUAD; (J) LUSC; (K) MESO; (L) STAD; (M) TGCT
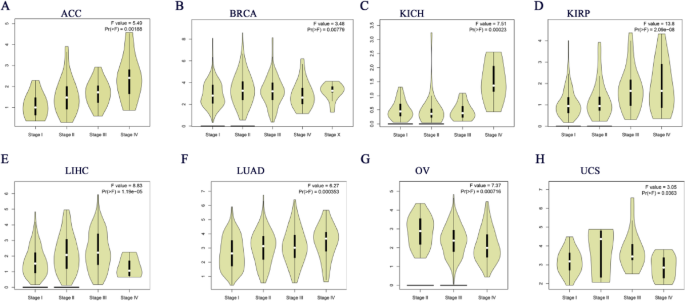
Major pathological stages of CDC6 expression based on the GEPIA2 database. (A) ACC; (B) BRCA; (C) KICH; (D) KIRP; (E) LIHC; (F) LUAD; (G) OV; (H) USC
Prognostic implications of CDC6 expression across diverse cancer types
To comprehensively evaluate the prognostic significance of CDC6 in cancer patients, we performed a detailed survival analysis using the Sangerbox platform, examining its association with multiple survival metrics, including overall survival (OS), disease-specific survival (DSS), disease-free interval (DFI) and progression-free interval (PFI). Cox regression analysis of OS demonstrated that elevated CDC6 expression was significantly correlated with poorer prognosis in GBMLGG, LGG, KIPAN, KIRP, ACC, LIHC, KICH, PAAD, LUAD, MESO, LAML, PRAD, SKCM.
and ALL, highlighting its role as a potential risk factor in these cancers. Interestingly, high CDC6 expression exhibited a protective effect in THYM and READ (Fig. 5A).
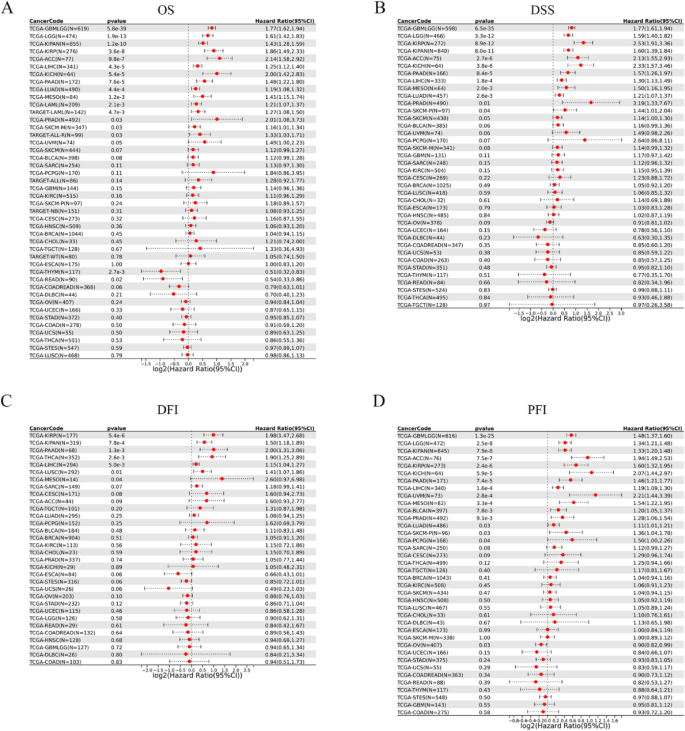
The relationship between CDC6 expression and patient prognosis based on Snager box database. (A) OS; (B) DSS; (C) DFI; (D) PFI
Further analysis revealed that high CDC6 expression was associated with worse DSS in GBMLGG, LGG, KIRP, KIPAN, ACC, KICH, PAAD, LIHC, MESO, LUAD,
PRAD and SKCM-P (Fig. 5B). Similarly, elevated CDC6 expression was identified as a risk factor for DFI in KIRP, KIPAN, PAAD, THCA, LIHC, LUSC and MESO (Fig. 5C). In the analysis of PFI, higher CDC6 expression was linked to poor prognosis in GBMLGG, LGG, KIPAN, ACC, KIRP, KICH, PAAD, LIHC, UVM, MESO, BLCA, PRAD, LUAD, SKCM-P and PCPG, while it appeared to be a protective factor in OV (Fig. 5D). These findings collectively underscore the tumor-specific prognostic implications of CDC6 expression, with its role varying significantly across different cancer types.
In conclusion, our results demonstrate that CDC6 serves as a potential prognostic biomarker in multiple cancers, with its expression levels exhibiting distinct associations with patient outcomes depending on the tumor type.
CDC6 expression correlates with immune infiltration levels
To explore the relationship between CDC6 expression and immune cell infiltration in the tumor microenvironment, we analyzed the association between CDC6 levels and tumor-infiltrating lymphocytes (TILs), which are known to independently predict sentinel lymph node status and cancer survival. Using the CIBERSORT algorithm, we assessed the correlation between CDC6 expression and immune cell infiltration across multiple cancer types. Our analysis revealed that CDC6 expression was significantly associated with immune cell infiltration in most cancer types (Fig. 6A). Specifically, CDC6 levels showed a positive correlation with the infiltration of B cells, macrophages, T cells, neutrophils, and dendritic cells (Fig. 6B). These findings suggest that CDC6 may play a multifaceted role in modulating the immune response within the tumor microenvironment, potentially influencing tumor immunity in a cancer type-specific manner.
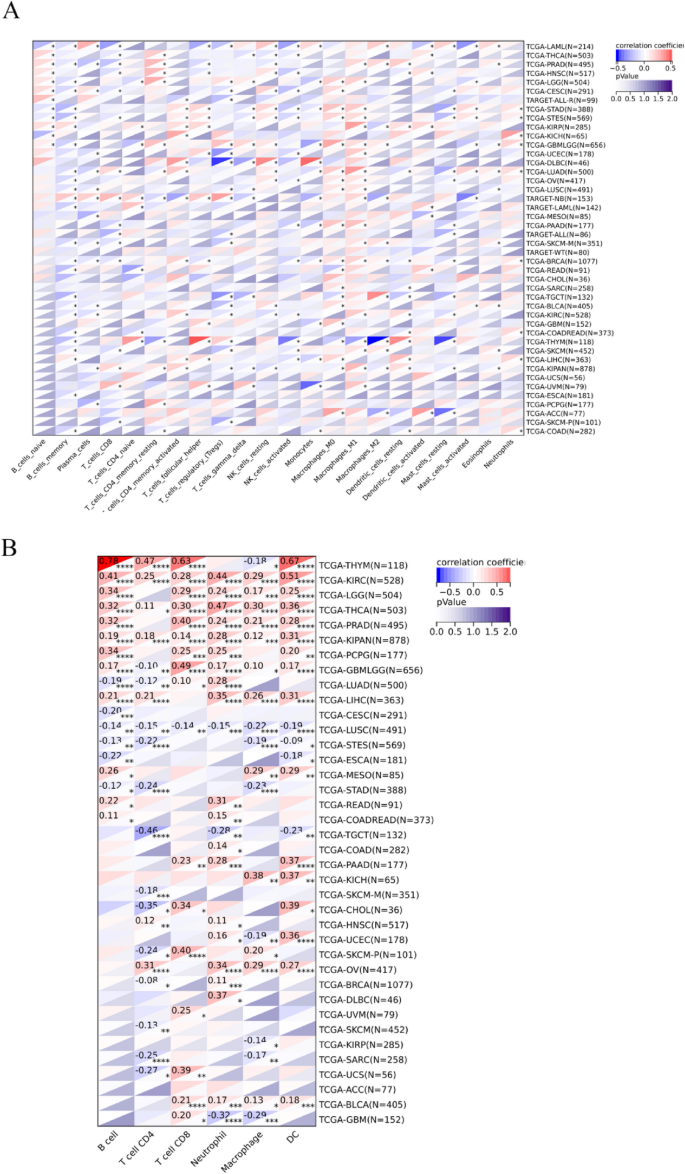
CDC6 expression was found to be significantly correlated with the levels of infiltration of various immune cells from the SangerBox database. (A) CIBERSORT. (B) TIMER. * p < 0.05, ** p < 0.01 and *** p < 0.001
CDC6 expression demonstrates significant associations with ICP genes, TMB, MSI and neoantigens in pan-cancer analysis
Immune checkpoint (ICP) genes play a significant role in the tumor infiltration of immune cells and immunotherapy responses. Immune checkpoint proteins are key regulators of immunity by activating over suppressing critical immune regulatory signaling pathways. Thus, ICP proteins are critical for the maintenance of self-tolerance and immune responses. Furthermore, immune checkpoint-related genes play a key role in the immune escape mechanisms of tumors. Therefore, we analyzed the correlation between expression levels of CDC6 and the ICP genes to determine the role of CDC6 in immunotherapy. The data demonstrated that CDC6 expression correlated with immune-related genes in most tumors such as DLBC, UVM, KIPAN, KIRC, LIHC, OV, GBMLGG, LGG, KICH, MESO, PRAD, THCA, PAAD, READ, LAML, STAD, STES, ESCA, LUSC, ALL, GBM, ACC, WT, COAD, COADREAD, LUAD, BLCA, BRCA, UCS, HNSC, PCPG, SKCM, KIRP, UCEC, CHOL, CESC, SARC, THYM, NB and TGCT (Fig. 7A). Therefore, CDC6 could be a promising target for tumor therapy.
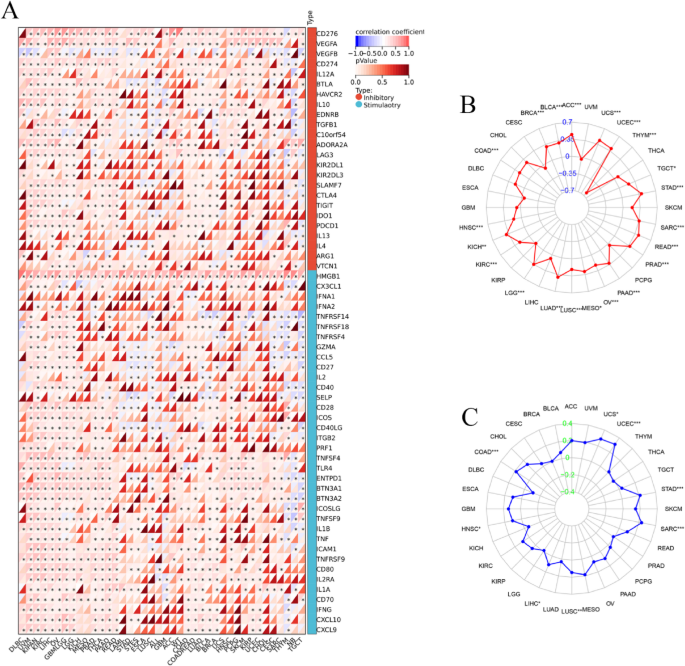
Association between CDC6 expression and tumor immunity biomarkers. (A) The relationship between CDC6 expression and immune checkpoint (ICP)genes in pan-cancer. Each small rectangular module represents co-expression of immune-related genes and CDC6 in various cancers; color in the upper left corner represents the correlation coefficient (Cor); the asterisk and color in the lower right corner represents the P value; (B) TMB; (C) MSI. *P < 0.05; **P < 0.01; ***P < 0.001
Tumor mutational burden (TMB), microsatellite instability (MSI), and neoantigen load have been widely recognized as biomarkers predictive of immunotherapy response in cancer. To explore whether CDC6 expression may serve a similar role, we systematically analyzed its association with TMB and MSI across multiple tumor types using TCGA data. Our analysis revealed significant positive correlations between CDC6 expression and TMB in diverse malignancies, including BRCA, BLCA, ACC, UCS, UCEC, TGCT, STAD, SARC, READ, PRAD, PAAD, OV, MESO, LUSC, LUAD, LGG, KIRC, KICH, HNSC and COAD (Fig. 7B). Conversely, a significant negative correlation was observed between CDC6 expression levels and TMB in THYM. Furthermore, CDC6 levels showed a positive association with MSI status in eight cancer types: COAD, HNSC, LIHC, LUSC, SARC, STAD, UCEC and UCS (Fig. 7C). These findings suggest that elevated CDC6 expression may serve as a novel predictive biomarker for immunotherapy efficacy in these specific cancer types, potentially reflecting enhanced tumor immunogenicity through its association with established markers of immunotherapy response.
Epigenetic regulation and genomic alterations of CDC6
Using the UALCAN platform, we systematically analyzed CDC6 promoter methylation levels across multiple cancer types. DNA methylation status was quantified by beta values (0: unmethylated; 1: fully methylated), with hypermethylation (β = 0.5–0.7) and hypomethylation (β = 0.25–0.3) defined by established cutoffs. Notably, tumor tissues exhibited significantly elevated CDC6 promoter methylation in COAD, ESCA, HNSC, KIRC, LUSC, PAAD and SARC compared to normal controls. Conversely, BLCA and PRAD demonstrated marked CDC6 hypomethylation in tumor versus normal tissues (Fig. 8).
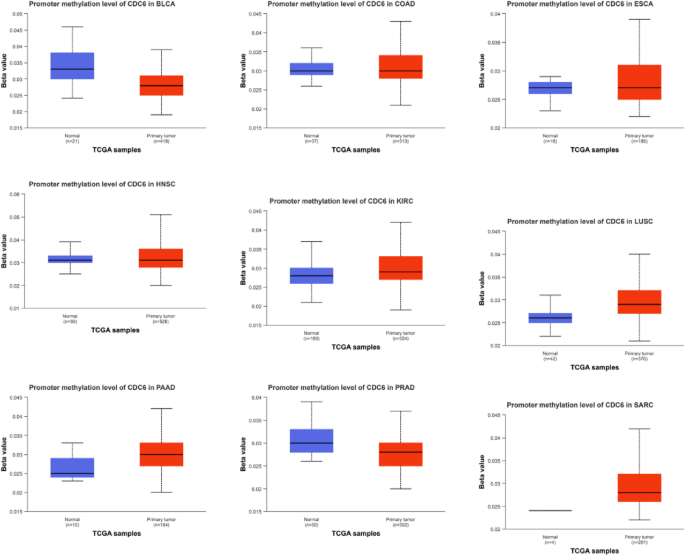
The promoter methylation level of CDC6 in cancers
Analysis of CDC6 mutation spectra in 10,953 TCGA tumors through cBioPortal revealed distinct patterns of genomic alterations across cancer types. Gene amplification emerged as the predominant alteration type, with particularly high frequency in: Esophageal adenocarcinoma (8.24%), Stomach adenocarcinoma (7.95%), Breast invasive carcinoma (5.26%) and Uterine carcinosarcoma (3.51%) (Fig. 9). These findings highlight the potential oncogenic role of CDC6 amplification in these aggressive cancers.
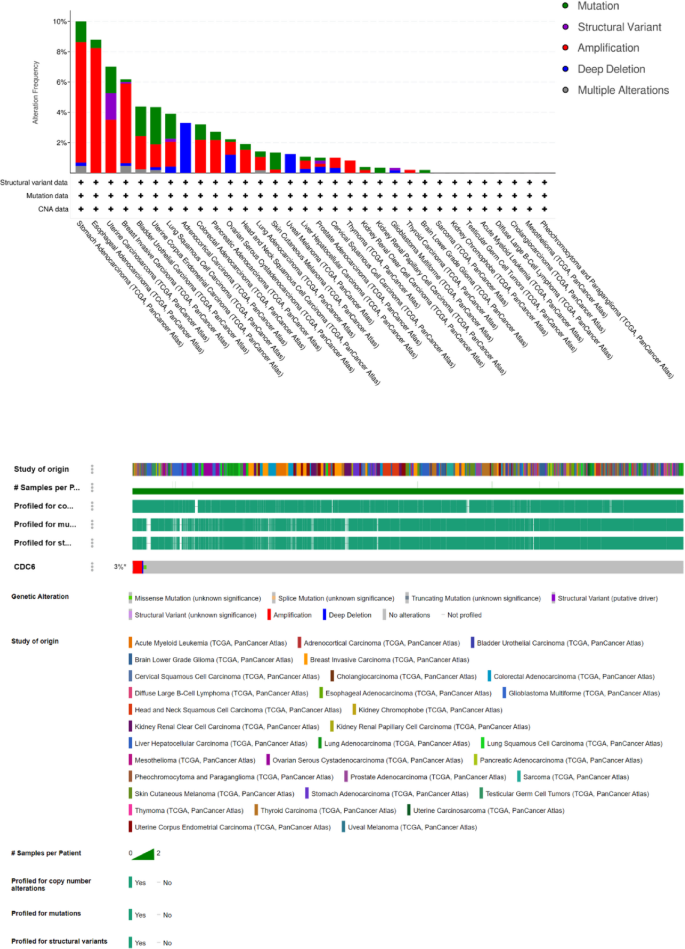
Mutation of CDC6. Alteration frequency and OncoPrint visual summary of alterations in a query of CDC6 from cBioPortal
Functional association between CDC6 and cutaneous melanoma (SKCM)
Gene Set Enrichment Analysis (GSEA) revealed significant functional associations between CDC6 and SKCM pathogenesis. KEGG pathway analysis identified the top five CDC6-associated pathways: allograft rejection, arachidonic acid metabolism, complement and coagulation cascades, graft-versus-host disease and linoleic acid metabolism (Fig. 10A). Complementary gene ontology (GO) analysis demonstrated striking enrichment in skin biology processes, with the most significant terms being: cornification, keratin filament, keratinization, keratinocyte differentiation and skin development (Fig. 10B). These results implicate CDC6 in both immunomodulatory pathways and epidermal differentiation mechanisms in cutaneous melanoma.
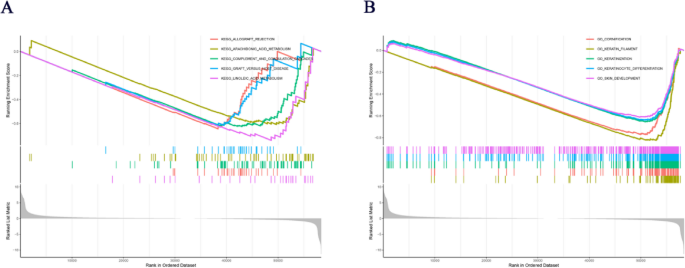
KEGG and Go analysis of CDC6 in SKCM. (A) KEGG analysis of CDC6 in SKCM. (B) GO analysis of CDC6 in SKCM
CDC6 drives melanoma progression via proliferation, migration and invasion
To evaluate the role of CDC6 in melanoma, we first examined its expression in clinical samples. Immunohistochemical analysis revealed significantly elevated levels of CDC6, MelanA and Ki67 in melanoma tumor tissues compared to adjacent normal or paracancerous tissues (Fig. 11A). To further investigate its functional impact, we performed loss-of-function studies in A375 melanoma cells. qPCR confirmed efficient knockdown of CDC6 (Fig. 11B). Functional assays demonstrated that CDC6 depletion markedly impaired melanoma cell proliferation, as evidenced by reduced colony formation (Fig. 11C) and diminished EdU incorporation (Fig. 11D). Additionally, CDC6 knockdown significantly attenuated invasive and migratory capacities in Transwell assays (Fig. 11E) and wound healing (Fig. 11F). Collectively, these findings establish CDC6 as a critical regulator of melanoma progression, promoting proliferative, migratory, and invasive behaviors.
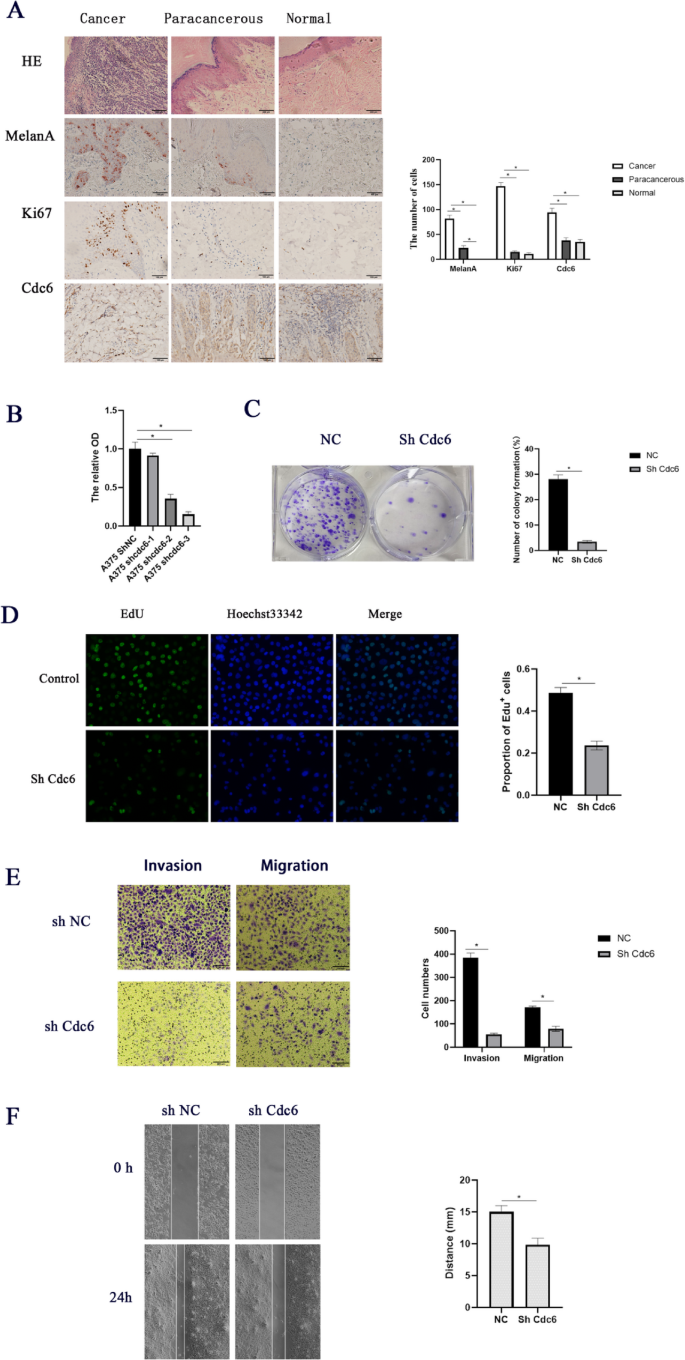
Evaluation of the ability of CDC6 to regulate SKCM tumor cell malignancy. (A) H&E staining of tissues from melanoma patients and the expression of proteins MelanA, Ki67 and Cdc6 in melanoma. (B) mRNA levels of CDC6 in transfected cells. The impact of CDC6 on the proliferation of tumor cells was assessed through colony formation (C) and EdU uptake assays (D). (E) Tumor cell migration and invasion were assessed with a Transwell assay approach. (F) Tumor cell migration following CDC6 low expression was assessed through a wound healing assay approach. *P < 0.05