Individual scenario analysis
Decreasing test sensitivity and specificity in isolation resulted in a substantial increase in total expected cases (Fig. 2A and B, Figure S3). When sensitivity was reduced from 99 to 97.5%, total cases rose by 11.7%, from 9,150 (95% CI 8,279–9,559) to 10,218 (95% CI 9,217–11,067). At 85% sensitivity, expected cases increased by 223% to 29,556 (95% CI 22,993–41,009). Decreasing test specificity also raised case numbers, but to a lesser degree. A specificity of 99% resulted in a 14.1% increase in cases to 10,444 (95% CI 9,261–11,798), and at 95% specificity, cases increased by 35.7% to 12,412 (95% CI 9,924–17,858).
A The mean total cases on day 522 with different sensitivity values; B The mean total cases on day 522 with different specificity values; C The mean total cases on day 522 with different testing rate values; D The mean total cases on day 522 with different time-to-isolation values
In contrast, increasing the testing rate and reducing time-to-isolation led to marked case reductions. A 10% testing rate increase resulted in a 47.7% case reduction from 9,150 (95% CI 8,279–9,559) to 4,782 (95% CI 4,266–5,377). Doubling of the rate yielded a 74.2% decrease to 2,359 (95% CI 645–4,396). Further increases provided no additional benefit, with excess testing slightly increasing total cases (Fig. 2C, Figure S3). A further exploration of this relationship can be found in Text S3 and Figure S4.
Reducing time-to-isolation also reduced cases. When the time to isolation is reduced to 1 day, a 47.7% reduction in cases is expected, from 9,150 (95% CI 8,279–9,559) to 4,783 (95% CI 1,773–7,853). Although reducing the time-to-isolation consistently decreased total cases, the reduction became less pronounced each time step. When time-to-isolation was as low as 30 min, which could reasonably be expected with a rapid diagnostic test, an 87.7% reduction in cases is expected to 1,122 (95% CI 474–2,023) (Fig. 2D, Figure S3).
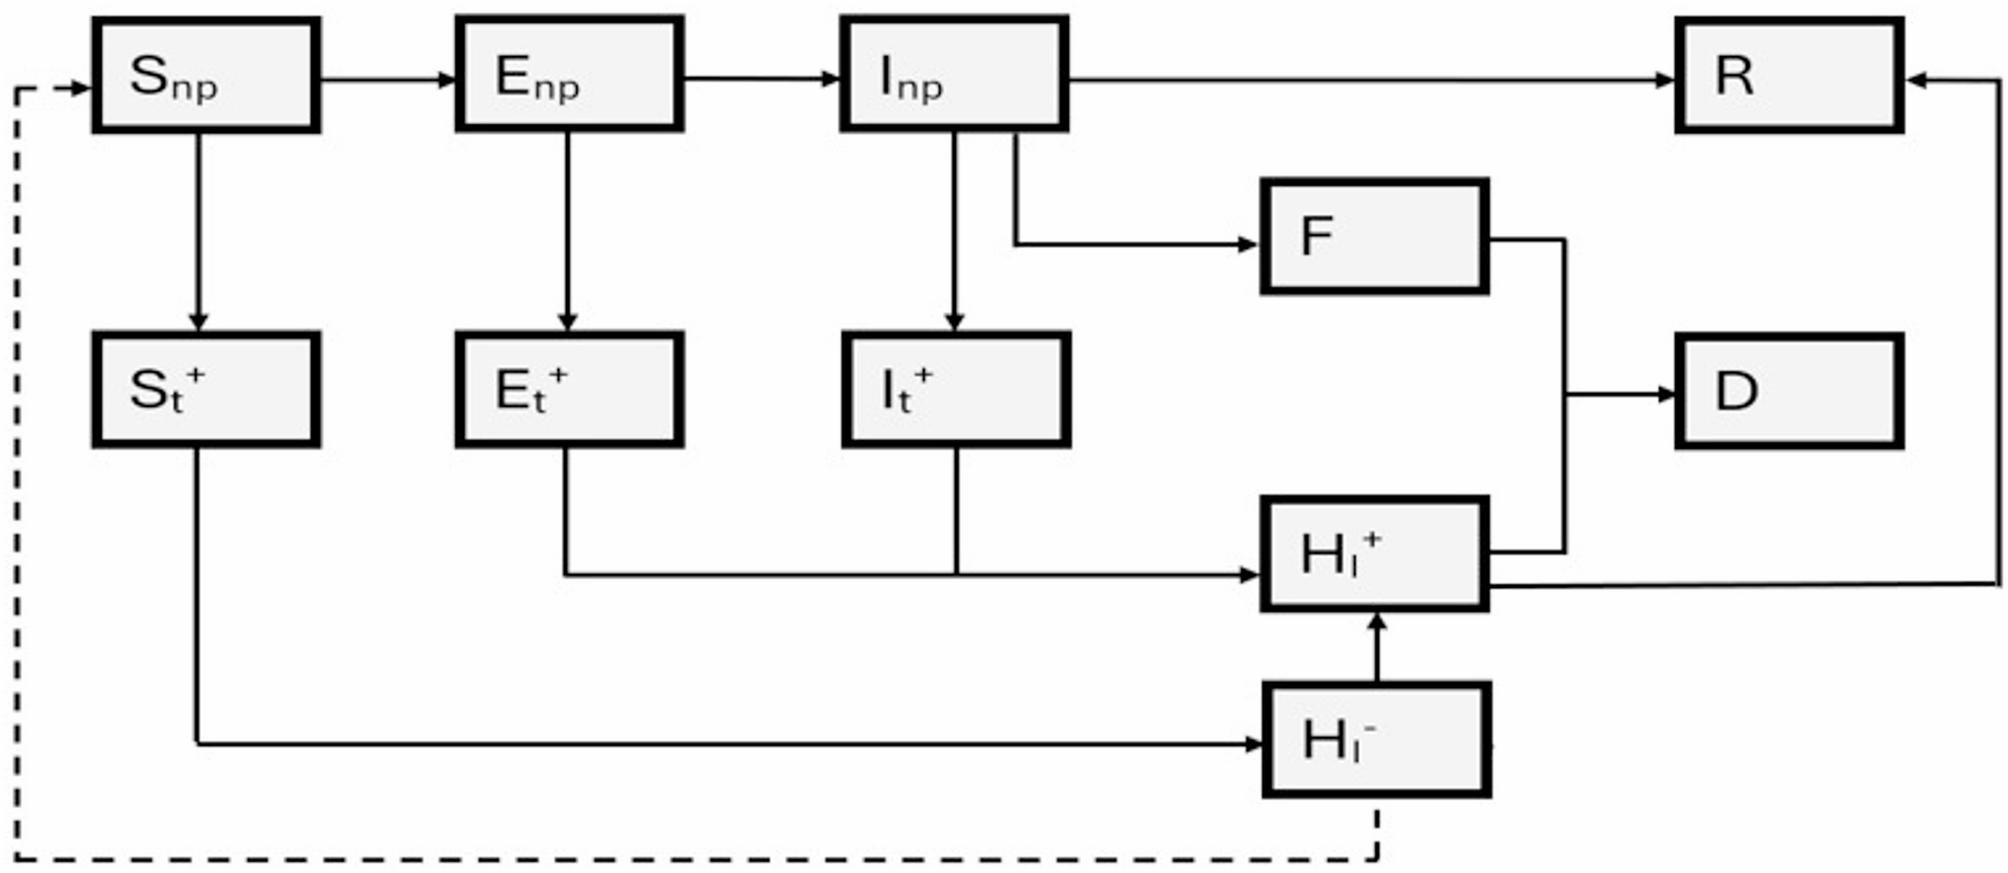
Trade-off scenarios
The trade-off between decreasing accuracy and decreasing time-to-isolation resulted in a substantial decrease in total expected cases in most tested scenarios compared to baseline. When decreasing the accuracy to an 85% sensitivity and a 95% specificity and decreasing time-to-isolation to 30 min, there was a 50.3% decrease in expected cases, from 9,150 (95% CI 8,279–9,559) to 4,548 (95% CI 1,276–9,296). The most considerable reduction was found with a 95% sensitivity, 99% specificity, and time-to-isolation of 30 min, with a reduction of 79.8% to total expected cases of 1,846 (95% CI 671–3,391). The smallest reduction and only scenario that did not decrease the mean total cases below reported WHO data was with an 85% sensitivity, a 95% specificity, and a time-to-isolation of 12 h; compared to baseline there was a 1.8% reduction in expected cases down to 8,986 (95% CI 2,803–18,301) (Figs. 3 and 4, left box). The mean and upper 95% CI of total deaths are shown in Figures S5 and S6 (left box).
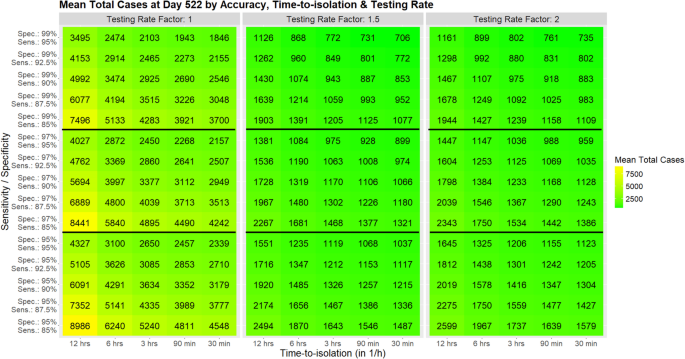
Mean total cases at day 522, as trade-off between sensitivity & specificity, time-to-isolation, and testing rate; left box testing rate: baseline, middle box testing rate: +50%, right box testing rate: +100%
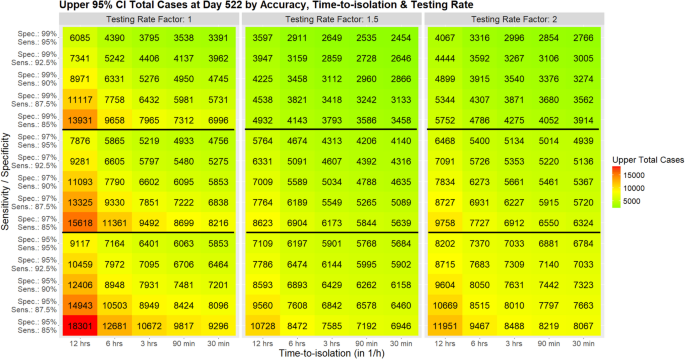
95% CI upper bound of total cases at Day 522, as trade-off between sensitivity & specificity, time-to-isolation, and testing Rate; left box testing rate: baseline, middle box testing rate: +50%, right box testing rate: +100%
The total expected cases decreased significantly more when an increased testing rate was added to the trade-off between accuracy and time-to-isolation. The most significant reduction was found with a 95% sensitivity, a 99% specificity, and a time-to-isolation of 30 min. With a testing rate of 150%, the expected cases decreased by 92.3% from 9,150 (95% CI 8,279–9,559) to 706 (95% CI 299–2,454), while a testing rate of 200% decreased the expected cases by 92.0% (expected cases 735 (95% CI 240–2,766). The smallest reduction was found with an 85% sensitivity, a 95% specificity, and a time-to-isolation of 12 h. With a testing rate of 150%, the expected cases decreased by 72.7% to 2,494 (95% CI 705–10,728), while a testing rate of 200% decreased the expected cases by 71.6% to 2,599 (95% CI 496–11,951) (Figs. 3 and 4). The mean and upper 95% CI of total deaths are shown in Figures S5 and S6.
False positives
A sub-analysis was performed to investigate the number of false positives that became infected in the hospital (Table S5). Lower specificity led to more false positives becoming infected, and higher testing rates amplified this effect. At baseline, 329 (95% CI 42–669), 4% of total cases were attributable to false positives becoming infected. In contrast, the false positives in the tested trade-off scenarios were much higher, ranging from 355 (95% CI 72–1,875) to 1,951 (95% CI 381–6,645). The percentage of mean total cases that started as false positives was also much higher, ranging from 23 to 76%.