The baseline characteristics of MAFLD and non-MAFLD groups
A total of 37,921 participants were included in the study, comprising 17,280 individuals in the MAFLD group and 14,460 in the non-MAFLD group from the Chinese population, along with 2,046 and 4,135 participants, respectively, from the U.S. population (Table 1). Both populations showed similar results. The MAFLD group was characterized by older age and higher levels of BMI, WC, FPG, TG, total cholesterol (TC), and LDL-c levels, alongside reduced levels of HDL-c compared to the non-MAFLD group. Additionally, metabolic indicators, including the ApoB/ApoA1 ratio and IR measures, were significantly higher in the MAFLD group than in the non-MAFLD group. The prevalence of hypertension and diabetes was also higher among MAFLD participants. All differences were statistically significant (all P < 0.05). Gender distribution revealed a larger proportion of males in the MAFLD group in the Chinese cohort, whereas the American cohort showed no significant gender differences.
Baseline characteristics according to tertiles of the ApoB/ApoA1 ratio
To explore the relationship between different ApoB/ApoA1 ratio levels and MAFLD, patients were categorized into three groups according to their ApoB/ApoA1 ratios (Table S1-S2). In the Chinese cohort, the distribution of participants across groups was as follows: Tertile 1 (n = 10,578), Tertile 2 (n = 10,586), Tertile 3 (n = 10,576). The average ApoB/ApoA1 ratios for these groups were 0.51 (0.44–0.56), 0.69 (0.65–0.74), and 0.92 (0.84–1.04). In the American cohort, the group distributions were: Tertile 1 (n = 2,061), Tertile 2 (n = 2,059), Tertile 3 (n = 2,061), with average ratios of 0.53 (0.46–0.59), 0.74 (0.69–0.79), and 0.99 (0.91–1.10), respectively. Similar results were observed among both Chinese and American populations, with participants in the Tertile 3 group exhibiting older age, a higher proportion of males, and comparatively lower educational levels, alongside higher rates of sedentary behavior relative to the other groups. Furthermore, the MAFLD incidence rate in the Tertile 3 group was higher, with increased levels of BMI, waist circumference, FPG, TG, TC, LDL-c, etc. Additionally, this group presented increased levels metabolic indicators, such as the ApoB/ApoA1 ratio and IR-related indicators (all P < 0.05).
Association between the ApoB/ApoA1 ratio and MAFLD
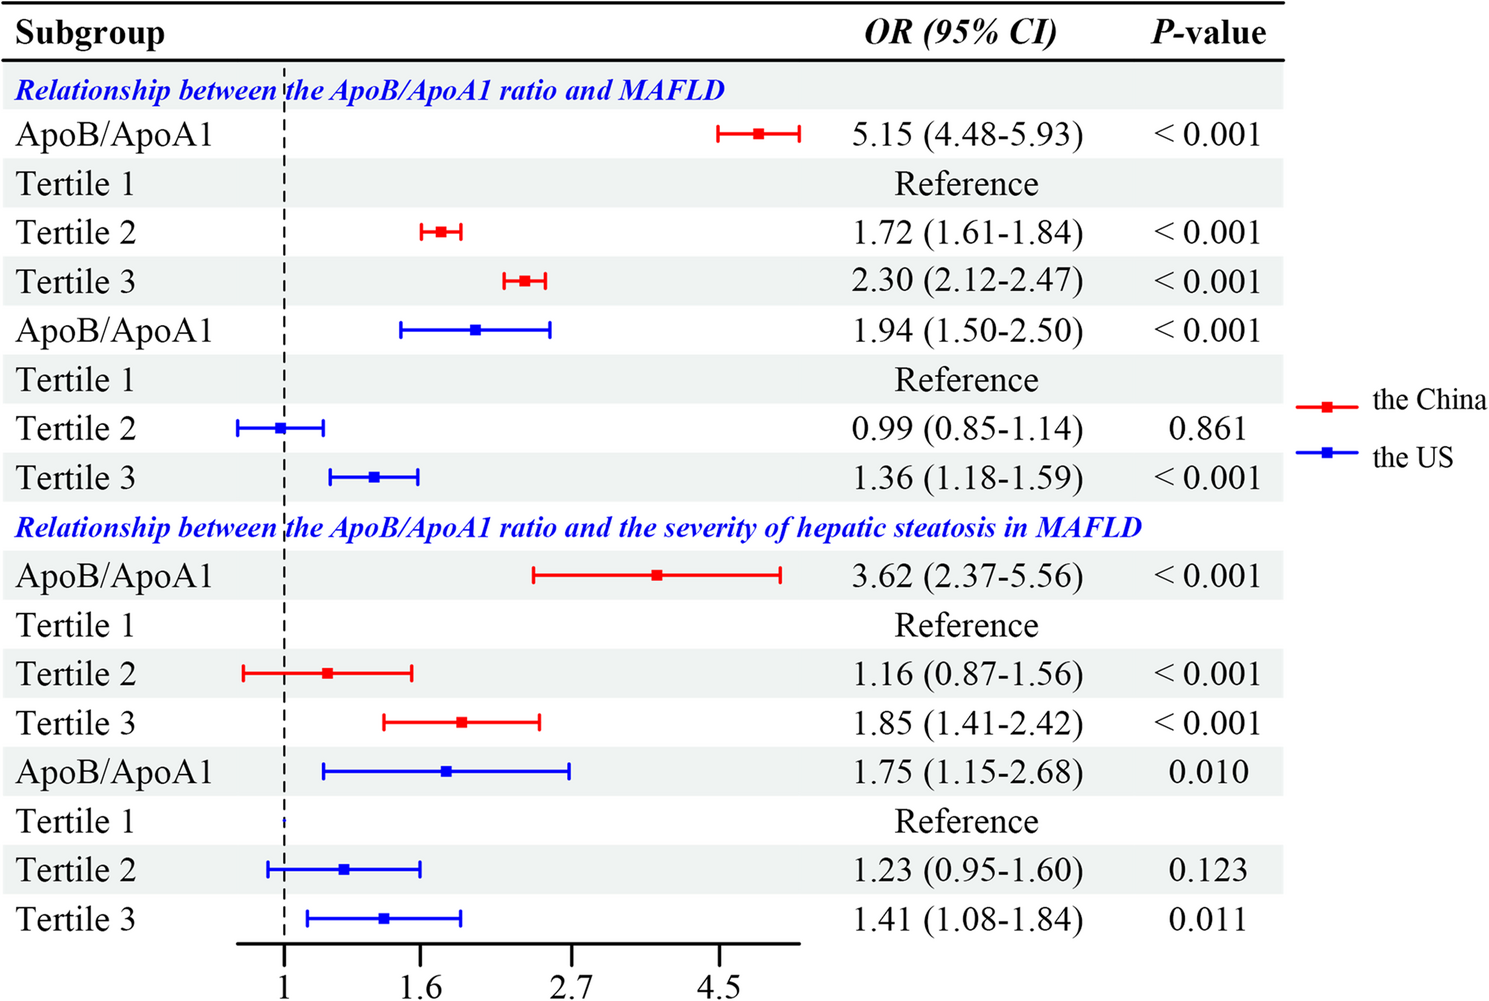
In the Chinese population, logistic regression analysis adjusted for Model II showed a significant association between the ApoB/ApoA1 ratio and MAFLD. As a continuous variable, the ApoB/ApoA1 ratio was strongly correlated with MAFLD (OR = 5.15, 95%CI: 4.48–5.93, P < 0.001). Additionally, when categorized, the risk of MAFLD in Tertile 3 was notably higher compared to Tertile 1 (OR = 2.30, 95%CI: 2.12–2.47, P < 0.001) (Fig. 1). In the American population, a similar significant relationship was found after adjusting for Model II. The continuous analysis yielded a significant correlation (OR = 1.94, 95%CI: 1.50–2.50, P < 0.001), and as a categorical variable, the risk of MAFLD in Tertile 3 was significantly greater than in Tertile 1 (OR = 1.36, 95%CI: 1.18–1.59, P < 0.001) (Fig. 1, Table S3-S4).
Association between the ApoB/ApoA1 ratio and both MAFLD and its severity. Abbreviation: ApoA1, apolipoprotein A1; ApoB, Apolipoprotein B; MAFLD, metabolic dysfunction-associated fatty liver disease; OR, odds ratio; CI, confidence interval
Association between the ApoB/ApoA1 ratio and the severity of hepatic steatosis in MAFLD
After adjusting for Model II, logistic regression revealed a significant link between the ApoB/ApoA1 ratio and hepatic steatosis severity in both Chinese and American MAFLD patients. As a continuous variable, each unit increase in the ratio was associated with a 3.62-fold rise in severe fatty liver risk in China (OR = 3.62, 95%CI 2.37–5.56, P < 0.001) and a 1.75-fold increase in the U.S. (OR = 1.75, 95%CI 1.15–2.68, P = 0.010) (Fig. 1). When analyzed as a categorical variable, transitioning from Tertile 1 to Tertile 3 led to a 1.85-fold higher risk in China (OR = 1.85, 95%CI 1.41–2.42; P < 0.001) and a 1.41-fold increase in the U.S. (OR = 1.41, 95%CI 1.08–1.84; P = 0.011) (Fig. 1, Table S3-S4).
Baseline characteristics comparison between the survival and mortality groups in MAFLD
Patients in the mortality group were older, had a higher proportion of males, and presented increased levels of BMI, WC, FPG, FINS, TC, TG, LDL-c, and metabolic indicators, including the ApoB/ApoA1 ratio and IR measures, compared to the survival group. Furthermore, mortality group exhibited elevated FIB-4 scores, a higher prevalence of diabetes and hypertension, and generally lower educational attainment (all P < 0.05) (Table S5).
Association between the ApoB/ApoA1 ratio with all-cause and cause-specific mortality of MAFLD population
After adjusting for the covariates in Model II, Table 2 illustrates the relationship between the ApoB/ApoA1 ratio and both all-cause and cause-specific mortality in MAFLD patients. The analysis of categorical variables reveals that, in the fully adjusted model, Tertile 3 is significantly linked to an increased risk of all-cause mortality compared to Tertile 1 (hazard ratio (HR) = 1.21, 95%CI: 1.02–1.44, P = 0.026), while Tertile 2 shows no significant association (HR = 1.04, 95%CI: 0.87–1.23, P = 0.678). Additionally, Tertile 3 was not significantly associated with cardiovascular-related mortality when compared to Tertile 1. However, in the context of diabetes-related mortality, Tertile 3 demonstrated a significant association with an increased risk compared to Tertile 1 (HR = 1.94, 95%CI: 1.26–2.98, P = 0.003), while Tertile 2 did not show significant results (HR = 1.29, 95%CI: 0.83–2.011, P = 0.264). When analyzing continuous variables, the fully adjusted model indicated that the ApoB/ApoA1 ratio significantly correlates with all-cause mortality (HR = 1.52, 95%CI: 1.17–1.98, P = 0.002), cardiovascular-related mortality (HR = 1.76, 95%CI: 1.12–2.77, P = 0.014), and diabetes-related mortality (HR = 2.20, 95%CI: 1.21–4.01, P = 0.010) in MAFLD patients. Furthermore, we performed Kaplan-Meier survival curves analysis. Figure 2 presents the Kaplan-Meier survival curves demonstrating the association between ApoB/ApoA1 ratio and long-term mortality risk. In the overall study population, mortality rates showed a progressive increase with ascending tertiles of the ApoB/ApoA1 ratio (all log-rank P-values < 0.001).
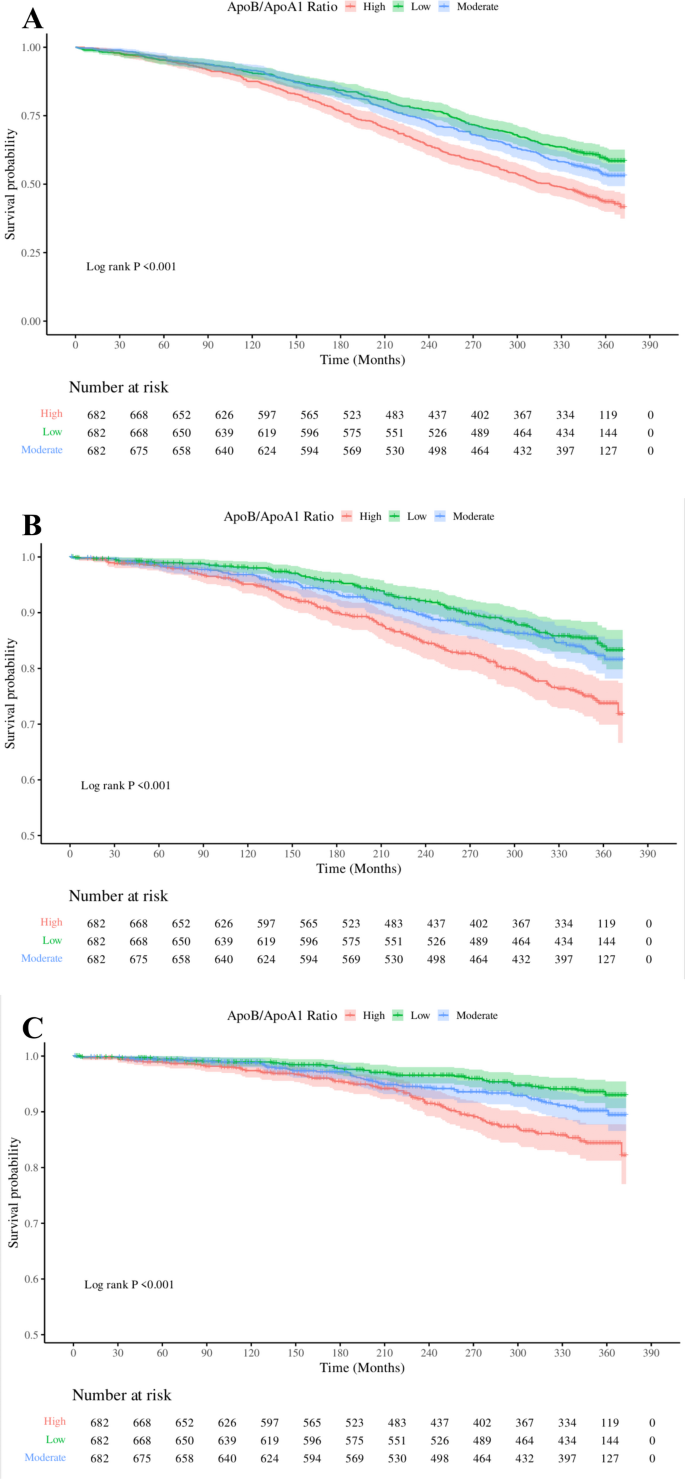
Kaplan-Meier survival curves showing associations between the ApoB/ApoA1 ratio and all-cause mortality (A), cardiovascular-related mortality (B), and diabetes-related mortality (C) in the MAFLD population. Abbreviation: ApoA1, apolipoprotein A1; ApoB, Apolipoprotein B
Non-linear trends of the ApoB/ApoA1 ratio with all-cause and cause-specific mortality of MAFLD population
Figure 3 illustrates the association between the ApoB/ApoA1 ratio and mortality in patients with MAFLD, as visualized using RCS. After adjusting for Model II, the ApoB/ApoA1 ratio demonstrated a linear association with all-cause mortality in the MAFLD population (P for non-linear = 0.396), cardiovascular-related mortality (P for non-linear = 0.248), and diabetes-related mortality (P for non-linear = 0.569). When the ApoB/ApoA1 ratio exceeds 1.17, the risk of all-cause mortality increases significantly; when the ApoB/ApoA1 ratio exceeds 1.04, the risk of cardiovascular-related mortality increases significantly; and when the ApoB/ApoA1 ratio exceeds 0.91, the risk of diabetes-related mortality increases significantly.
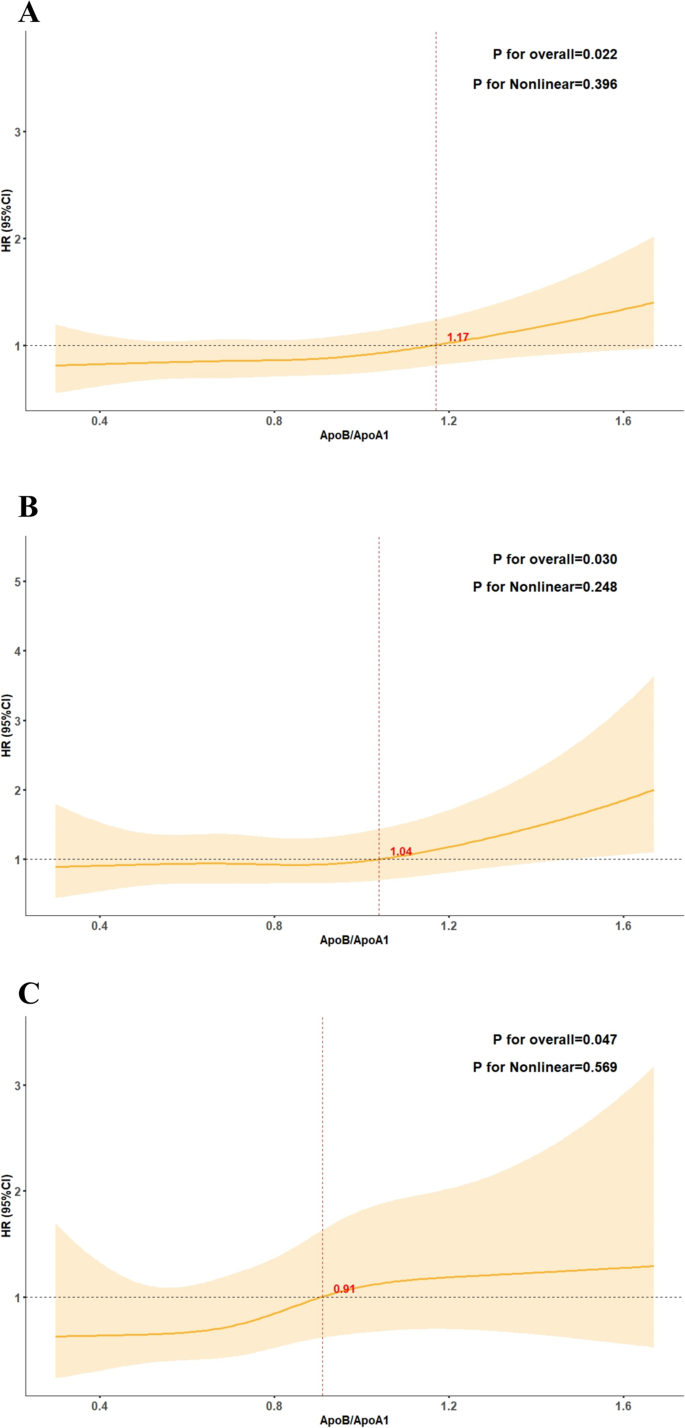
Non-linear trends of the ApoB/ApoA1 ratio with all-cause and cause-specific mortality of MAFLD population. A–C represents the relationship between ApoB/ApoA1 ratio and all-cause mortality (A), cardiovascular-related mortality (B), and diabetes-related mortality (C) in the MAFLD population. Abbreviation: ApoA1, apolipoprotein A1; ApoB, Apolipoprotein B; MAFLD, metabolic dysfunction-associated fatty liver disease; HR: hazard ratios; CI: confidence interval
Subgroup analysis of the ApoB/ApoA1 ratio and both all-cause and cause-specific mortality in MAFLD
The findings of the subgroup analyses are presented in Fig. 4. Participants were stratified by age, gender, married, low income, diabetes, hypertension, smoke, sedentary lifestyle and severe hepatic steatosis. We applied Bonferroni correction to the results of the interaction tests to minimize the impact of multiple testing. After correction, we found that smoking status significantly modified the associations between the ApoB/ApoA1 ratio and all-cause mortality (interaction P value = 0.004), after adjusting for the covariates in Model II. Specifically, among smokers, the associations of the ApoB/ApoA1 ratio with all-cause mortality (HR = 3.15, 95%CI: 1.87–5.30, P < 0.001) was significantly stronger.
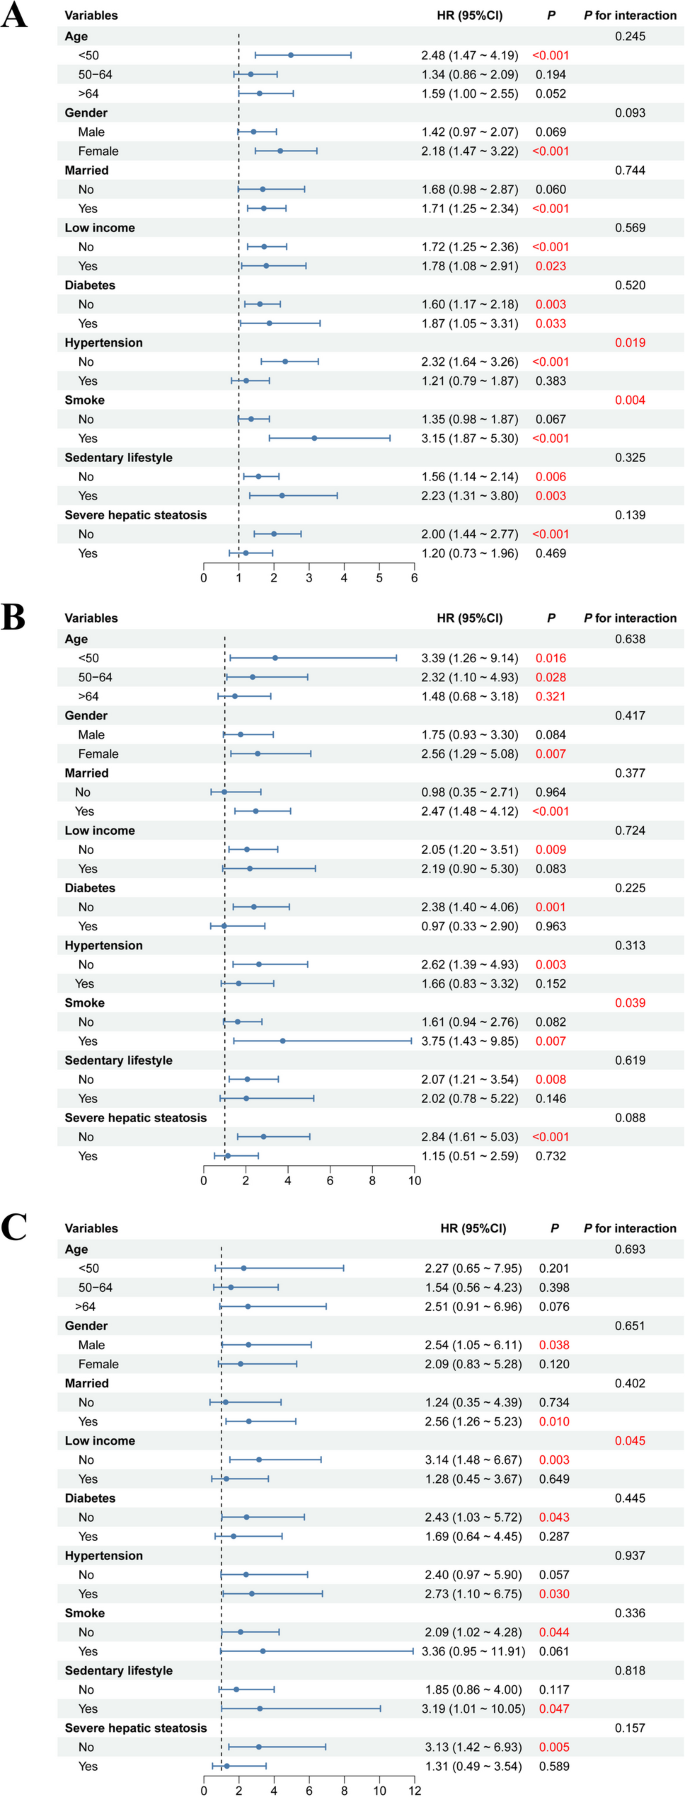
Subgroup analysis of ApoB/ApoA1 ratio and both all-cause and cause-specific mortality in MAFLD population. A-C represents the subgroup analysis between ApoB/ApoA1 ratio and all-cause mortality (A), cardiovascular-related mortality (B), and diabetes-related mortality (C) in the MAFLD population. Abbreviation: ApoA1, apolipoprotein A1; ApoB, Apolipoprotein B; MAFLD, metabolic dysfunction-associated fatty liver disease; HR: hazard ratios; CI: confidence interval
The mediating effect of IR indicators on the relationship between the ApoB/ApoA1 ratio and all-cause mortality
This study further explored the mediating role of IR indicators in the relationship between the ApoB/ApoA1 ratio and all-cause mortality through mediation effect analysis. After adjusting for covariates in Model II, the average causal mediation effect (ACME) of the ApoB/ApoA1 ratio on all-cause mortality through TyG-BMI was (ACME = 0.038, P < 0.001), while the average direct effect (ADE) of the ApoB/ApoA1 ratio on all-cause mortality was (ADE = 0.068, P = 0.043). The proportion of the mediating effect of TyG-BMI between the ApoB/ApoA1 ratio and all-cause mortality was 35.52%. Additionally, the ACME of the ApoB/ApoA1 ratio on all-cause mortality through HOMA-IR was (ACME = 0.005, P < 0.001), while the ADE of the ApoB/ApoA1 ratio on all-cause mortality was (ADE = 0.101, P = 0.010). The proportion of the mediating effect of HOMA-IR between the ApoB/ApoA1 ratio and all-cause mortality was 5.16% (Fig. 5).
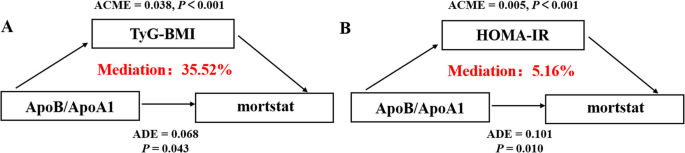
The mediating effect of insulin resistance indicators on the relationship between the ApoB/ApoA1 ratio and all-cause mortality. A The mediating effect of TyG-BMI on the relationship between the ApoB/ApoA1 ratio and all-cause mortality; (B) The mediating effect of HOMA-IR on the relationship between the ApoB/ApoA1 ratio and all-cause mortality. Abbreviations: ApoA1, apolipoprotein A1; ApoB, Apolipoprotein B; ACME, average causal mediation effect; ADE, average direct effect; TyG-BMI, triglyceride glucose-body mass index; HOMA-IR, homeostatic model assessment of insulin resistance
Sensitivity analyses
To assess the robustness of our findings, we conducted two sensitivity analyses (Table S6, S7). First, after excluding 481 participants with FIB-4 ≥ 1.3, Cox regression analysis demonstrated that compared to the T1 group, the T3 group with higher ApoB/ApoA1 ratios remained significantly associated with increased risks of all-cause mortality (HR = 1.29, 95%CI: 1.04–1.61, P = 0.022) and diabetes-related mortality (HR = 1.83, 95%CI: 1.06–3.16, P = 0.031). Second, after further excluding 598 participants with severe hepatic steatosis, the T3 group continued to show significant associations with both all-cause mortality (HR = 1.22, 95%CI: 1.07–1.49, P = 0.042) and diabetes-related mortality (HR = 1.71, 95%CI: 1.01–2.92, P = 0.048).