Demographic and baseline clinical characteristics
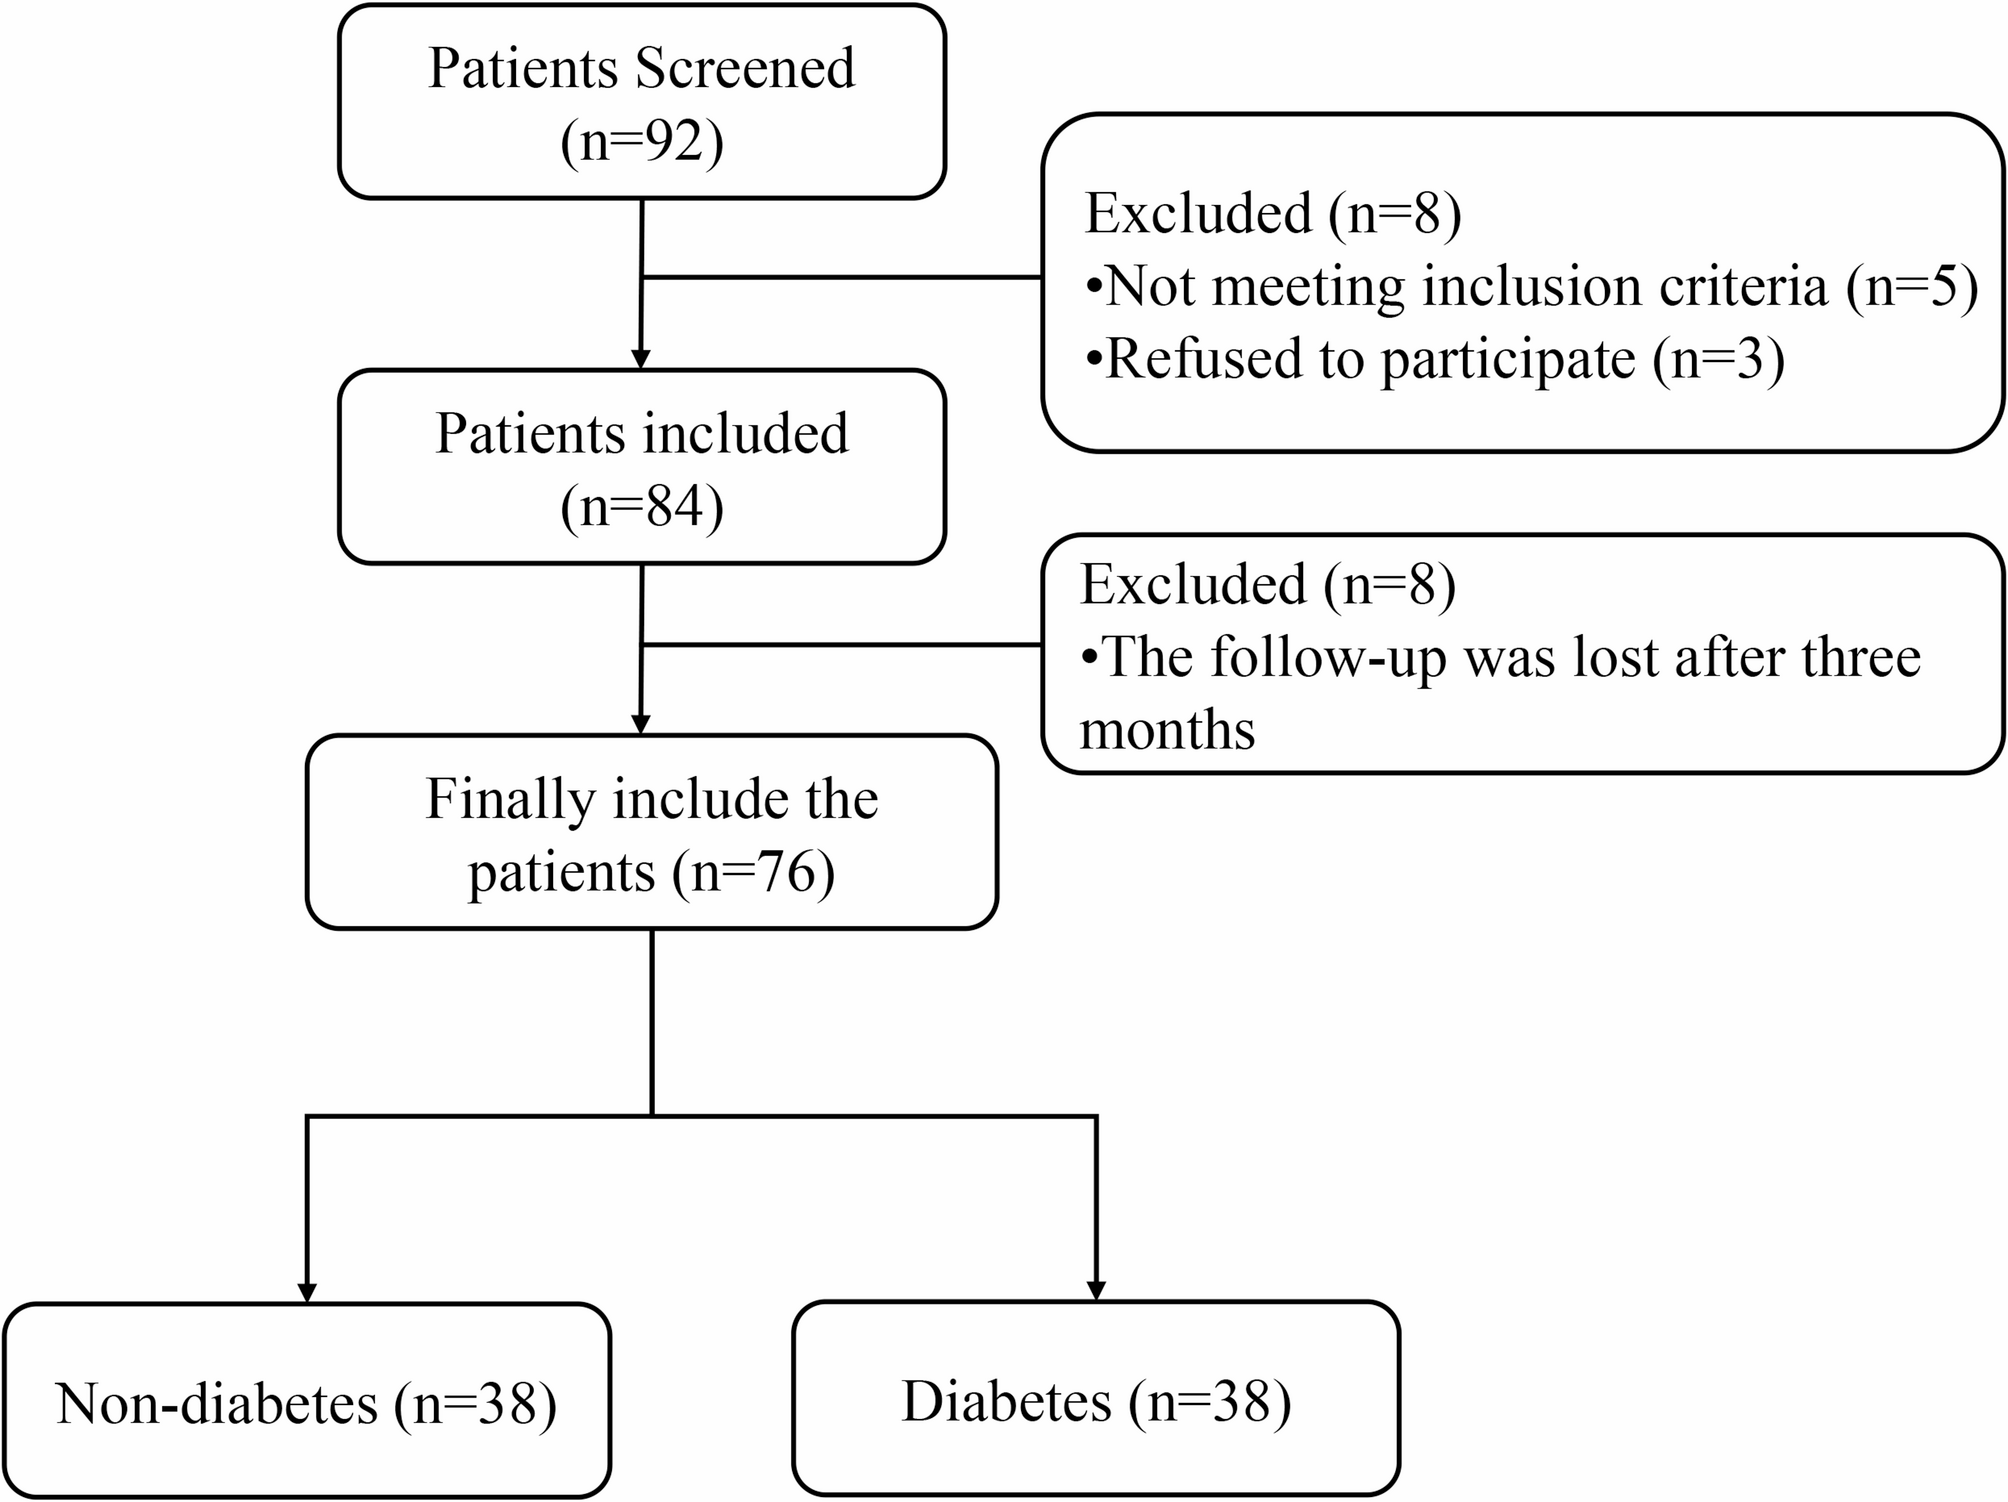
A total of 76 patients diagnosed with periodontitis were included in this study, among whom 38 had concomitant diabetes mellitus (Fig. 1). The demographic characteristics and baseline periodontal parameters of the two groups are summarized in Table 1. There was no significant difference in age between the groups: the mean age was 45.34 ± 6.00 years in the non-diabetic group and 45.63 ± 8.08 years in the diabetic group (P = 0.860). Regarding sex distribution, the non-diabetic group included 19 males and 19 females, while the diabetic group included 21 males and 17 females, showing no significant intergroup difference (P = 0.646).
A significant difference was observed in BMI distribution between the two groups (P = 0.003). In the non-diabetic group, the majority of participants were underweighted or of normal weight (n = 36), with only 2 classified as overweight or obese. In contrast, the diabetic group had a higher proportion of overweight/obese individuals (n = 12) and 26 individuals in the underweight/normal category. This finding is consistent with the well-established association between diabetes and metabolic abnormalities. Regarding smoking status, 6 participants in the non-diabetic group and 4 in the diabetic group were current smokers, with no significant difference between groups (P = 0.497). Alcohol consumption was reported by 8 participants in the non-diabetic group and 14 in the diabetic group; however, the difference did not reach statistical significance (P = 0.129).
In terms of baseline periodontal clinical parameters, both groups exhibited similar disease severity. The mean probing depth was 3.92 ± 0.91 mm in the non-diabetic group and 3.97 ± 0.85 mm in the diabetic group (P = 0.796). Mean clinical attachment loss was 5.66 ± 1.26 mm and 5.79 ± 1.32 mm, respectively (P = 0.658). Bleeding on probing scores averaged 2.18 ± 0.56 in the non-diabetic group and 2.24 ± 0.59 in the diabetic group (P = 0.692). The plaque index was 1.95 ± 0.52 in the non-diabetic group and 1.97 ± 0.37 in the diabetic group (P = 0.799). None of the baseline periodontal parameters showed statistically significant differences, indicating comparable periodontal disease severity between the two groups. This homogeneity provides a sound basis for assessing the specific effects of diabetes on local inflammatory cytokine levels and treatment outcomes.
Changes in clinical parameters
Following SRP treatment, improvements were observed in all periodontal clinical parameters among the participants. Detailed results are presented in Table 2; Fig. 2. Overall, the mean values of PD, CAL, BI, and PLI at three months post-treatment were reduced compared to baseline.
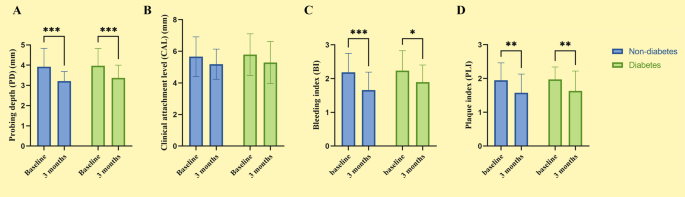
Changes in periodontal clinical parameter indicators. A: PD; B: CAL; C: BI; D: PLI
For probing depth, the mean value decreased from 3.95 ± 0.88 mm at baseline to 3.29 ± 0.56 mm at 3 months, with an average reduction of 0.66 ± 1.04 mm. Subgroup analysis revealed a more pronounced reduction in the non-diabetic group (from 3.92 ± 0.91 mm to 3.21 ± 0.47 mm, Δ = 0.71 ± 1.06 mm), whereas the diabetic group showed a slightly smaller decrease (from 3.97 ± 0.85 mm to 3.37 ± 0.63 mm, Δ = 0.61 ± 1.03 mm). However, the intergroup difference was not statistically significant (P = 0.662). As shown in Fig. 2A, both groups exhibited a significant reduction in PD after treatment (P < 0.001).
Regarding clinical attachment level, the mean CAL decreased from 5.72 ± 1.28 mm at baseline to 5.24 ± 1.15 mm at 3 months, corresponding to an average reduction of 0.49 ± 1.76 mm. Specifically, CAL in the non-diabetic group decreased from 5.66 ± 1.26 mm to 5.18 ± 0.96 mm (Δ = 0.47 ± 1.52 mm), while in the diabetic group it declined from 5.79 ± 1.32 mm to 5.29 ± 1.33 mm (Δ = 0.50 ± 1.98 mm). The degree of improvement was comparable between groups (P = 0.948). As illustrated in Fig. 2B, no significant between-group difference in CAL reduction was detected.
As for the bleeding index, the overall BI decreased from 2.21 ± 0.57 at baseline to 1.78 ± 0.53 in three months, yielding a mean reduction of 0.43 ± 0.82. A more substantial decrease was observed in the non-diabetic group (from 2.18 ± 0.56 to 1.66 ± 0.53, Δ = 0.53 ± 0.76) compared to the diabetic group (from 2.24 ± 0.59 to 1.89 ± 0.51, Δ = 0.34 ± 0.88). After three months, the difference in BI between groups approached statistical significance (P = 0.052), although the difference in improvement did not reach significance (P = 0.332). Figure 2C shows significant post-treatment reductions in BI in both groups, with a highly significant change in the non-diabetic group (P < 0.001) and a significant change in the diabetic group (P < 0.05).
For the plaque index, the overall mean value decreased from 1.96 ± 0.45 at baseline to 1.61 ± 0.57 in three months, indicating an average reduction of 0.36 ± 0.71. In the non-diabetic group, PLI declined from 1.95 ± 0.52 to 1.58 ± 0.55 (Δ = 0.37 ± 0.71), and in the diabetic group from 1.97 ± 0.37 to 1.63 ± 0.59 (Δ = 0.34 ± 0.71). No significant difference was found between groups (P = 0.872). As demonstrated in Fig. 2D, both groups showed statistically significant improvements in PLI (P < 0.01).
In diabetic patients, glycemic controls reflected by HbA1c—also showed a slight improvement after SRP. The mean HbA1c level decreased from 8.37 ± 1.06% at baseline to 8.07 ± 1.17% in 3 months, representing an average reduction of 0.30 ± 1.24% points. This finding suggests a potentially beneficial effect of non-surgical periodontal treatment on glycemic control in diabetic individuals.
Changes in cytokine levels
At baseline, no significant differences in inflammatory cytokine levels were observed between the diabetic and non-diabetic groups. For pro-inflammatory markers, the concentration of IL-1β in the diabetic group was slightly higher (3318.24 ± 741.78 pg/ml) compared to the non-diabetic group (3289.03 ± 929.39 pg/ml), but this difference was not statistically significant (P = 0.880). Similarly, TNF-α levels were 1302.37 ± 318.93 pg/ml in the diabetic group and 1278.79 ± 436.89 pg/ml in the non-diabetic group (P = 0.789). Regarding the anti-inflammatory cytokine IL-10, baseline levels were also comparable between groups, with 13.33 ± 2.37 pg/ml in the diabetic group and 13.21 ± 2.94 pg/ml in the non-diabetic group (P = 0.838) (Table 3).
Three months after SRP treatment, both groups exhibited reductions in pro-inflammatory cytokine levels to varying extents. The most notable change was observed in TNF-α concentrations. As illustrated in Fig. 3A, the non-diabetic group showed a significant reduction in TNF-α, decreasing from 1278.79 ± 436.89 pg/ml to 693.47 ± 149.69 pg/ml (Δ = 585.32 ± 462.83 pg/ml). In the diabetic group, TNF-α decreased from 1302.37 ± 318.93 pg/ml to 819.32 ± 139.08 pg/ml (Δ = 483.05 ± 376.22 pg/ml). These reductions were highly significant in both groups (P < 0.001). However, post-treatment TNF-α levels remained significantly higher in the diabetic group compared to the non-diabetic group (P < 0.001), suggesting a persistently elevated pro-inflammatory state in diabetic patients despite treatment.
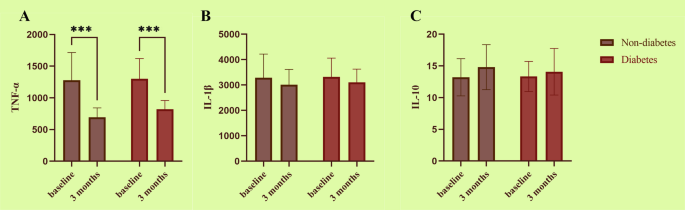
Changes in cytokine levels between the non-diabetic group and the diabetic group at baseline and after three months. A: TNF-α; B: IL-1β; C: IL-10
For IL-1β, levels in the non-diabetic group decreased from 3289.03 ± 929.39 pg/ml to 3012.45 ± 602.90 pg/ml, a reduction of 276.58 ± 1137.80 pg/ml. In the diabetic group, IL-1β declined from 3318.24 ± 741.78 pg/ml to 3101.50 ± 526.78 pg/ml (Δ = 216.74 ± 960.97 pg/ml). No statistically significant difference in the magnitude of reduction was found between groups (P = 0.805), and as shown in Fig. 3B, neither group exhibited a statistically significant within-group change in IL-1β following treatment.
Regarding the anti-inflammatory cytokine IL-10, post-treatment increases were observed in both groups. In the non-diabetic group, IL-10 levels increased from 13.21 ± 2.94 pg/ml to 14.81 ± 3.55 pg/ml (Δ = +1.60 ± 4.83 pg/ml), while in the diabetic group, levels rose from 13.33 ± 2.37 pg/ml to 14.08 ± 3.68 pg/ml (Δ = +0.75 ± 4.35 pg/ml). As shown in Fig. 3C, the increase in IL-10 was more pronounced in the non-diabetic group, although the between-group difference was not statistically significant (P = 0.422). Similarly, the absolute post-treatment IL-10 levels were slightly higher in the non-diabetic group (14.81 ± 3.55 pg/ml) than in the diabetic group (14.08 ± 3.68 pg/ml), but this difference also did not reach statistical significance (P = 0.384).
Figure 4 compares the changes in inflammatory cytokine levels between groups at baseline and three months post-treatment. Overall, although baseline values were similar, the non-diabetic group exhibited a more substantial decrease in TNF-α and a more noticeable increase in IL-10 following treatment. These findings suggest that non-diabetic individuals may have a more favorable inflammatory response to SRP.
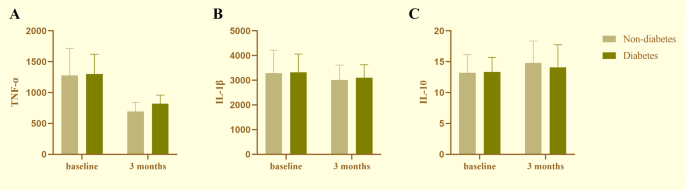
Comparison of cytokine levels between the non-diabetic group and the diabetic group. A: TNF-α; B: IL-1β; C: IL-10