Multi-omics landscape of sex differences in LUAD
Our multi-omics analysis of the landscape of LUAD drew upon two primary data sources: The CPTAC-LUAD dataset provided proteomic data—including protein abundance, phosphorylation, and acetylation—from 111 patients (38 females and 73 males) and the TCGA-LUAD dataset had transcriptomic data from 502 patients (269 females and 233 males) after exclusion of potential outliers (Methods). Both sample populations had diverse demographic and clinical characteristics, including sex, race, smoking status, and tumor stage (Fig. 2A; Table 1). The TCGA dataset had a more balanced representation of female and male samples compared to CPTAC (Fig. 2A; Supplementary Table S1). The TCGA transcriptomic dataset covered the majority of protein-coding genes, while the CPTAC proteomic dataset (Fig. 2B) was a small subset of proteins encoded by TCGA transcripts. After harmonizing gene symbols to the HGNC-approved nomenclature (Methods), we found approximately 9000 genes in TCGA for which the corresponding proteins were not present in any of the other omics. The phosphorylation and acetylation datasets included an even smaller number of proteins, reflecting the fact that PTMs, which occur as chemical changes on specific amino acid residues, affect only a subset of the proteome.
Multi-omics landscape of Sex Differences in LUAD. A. Stacked bar plot illustrating key demographic characteristics and self-reported smoking status of individuals with LUAD as documented in the CPTAC and TCGA datasets. B. UpSet plot representing the overlap of protein-coding genes represented across four omics dimensions: RNA expression, protein abundance, protein phosphorylation, and protein acetylation. All gene symbols have been aligned with the HGNC approved nomenclature (Methods). C. Visualization of the representative sex-biased KEGG pathways (adjusted p-value < 0.05, determined by GSEA or ORA) derived from multi-omics differential analysis. Pathways predominantly associated with females are marked in red, while those related to males are in blue. Pathways shared by both sexes are depicted in green
We used limma [28] to analyze transcriptomics and proteomics data (excluding Y chromosome genes), comparing male and female samples, and adjusting for age, race, smoking status, and tumor stage; we then performed gene set enrichment analysis (GSEA) using KEGG pathway annotation to identify sex differences within these datasets (Methods). To identify robust sex-biased pathways, we intersected the results from each omics layer; however, we only observed a small number of shared pathways (Fig. 2C). The modest number of shared pathways between the various data sources may be due to (1) the known weak correlation between gene expression and protein abundance [29, 30], (2) the decreasing number of assayed genes or proteins as we move from RNA to protein abundance to protein modification, and (3) the limited overlap between the genes represented in different datasets (Fig. 2B). Among the shared pathways found to be enriched across omics in males with LUAD were cell proliferation-related pathways, particularly cell cycle pathways. Females showed greater enrichment in cancer-related signaling pathways, including Notch, Hippo, and Wnt (Fig. 2C). Metabolic pathways were enriched in female protein abundance but in male protein acetylation, consistent with acetylation’s known inhibitory effects on metabolic processes [31,32,33]. A comprehensive list of the sex-biased pathways identified in each omics category is provided in Supplementary Table S2−7.
Sex-biased protein signaling network
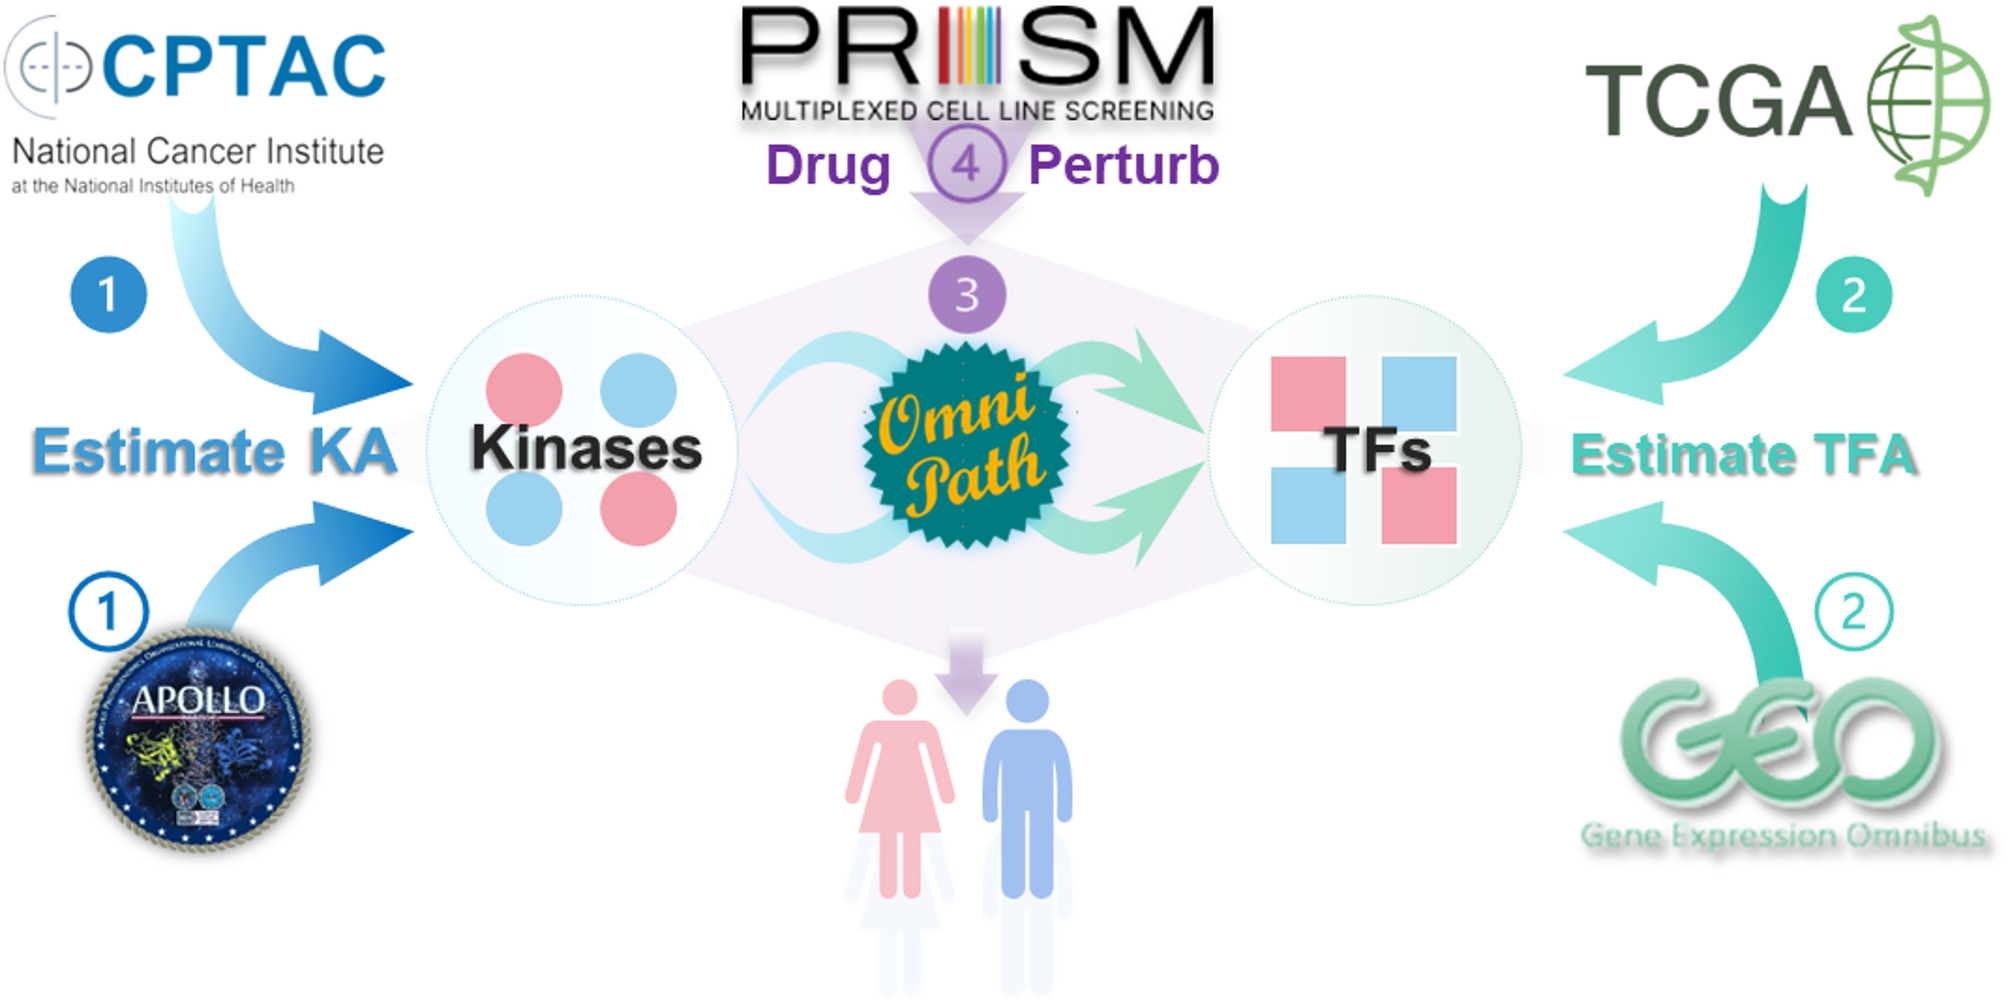
We used TIGER [23] to infer transcription factor activity in each individual in the TCGA study population. TIGER is a Bayesian matrix decomposition method that uses prior knowledge of TF-gene binding to decompose gene expression matrices, enabling the estimation of both gene regulatory networks and TF activities [23]. We also adapted TIGER to estimate kinase activity, replacing the input gene expression matrix with a protein phosphorylation matrix and substituting the TF-gene binding prior with a kinase-substrate binding prior from the OmniPath database [24]. Simultaneously, we used the PTM-SEA [34] algorithm to estimate kinase activity. PTM-SEA is a modified version of the GSEA algorithm designed to perform site-specific signature analysis [35]. It uses the PTM signatures database (PTMsigDB) to score PTM site-specific signatures, such as those for protein phosphorylation, directly from a protein phosphorylation matrix [34]. The use of two different algorithms (TIGER and PTM-SEA) to analyze the same dataset (phosphorylation) allowed us to combine the two results to get a robust kinase activity estimation (Methods).
In our TF activity analysis, NFKB1 and NR3C1 emerged as key TF drivers in female and male patients, respectively (Fig. 3A). NFKB1, also known as nuclear factor kappa-light-chain-enhancer of activated B cells, is crucial in regulating the immune response to infection [36]. NR3C1, the glucocorticoid receptor, mediates glucocorticoids’ effects, significantly influencing inflammation and immune responses [37]. In using TIGER and PTM-SEA for kinase activity estimation, we identified two pivotal kinases, AURKA and MAPK14, as playing vital roles in female and male patients, respectively (Fig. 3B). AURKA (Aurora kinase A) is a serine/threonine kinase critical for mitosis and cellular proliferation, frequently dysregulated in cancers and contributing to their progression [38]. MAPK14 (p38 alpha) is a key MAPK family member involved in tumor biology, regulating survival, proliferation, metastasis, and therapy response, as well as stress and inflammation signaling [39].
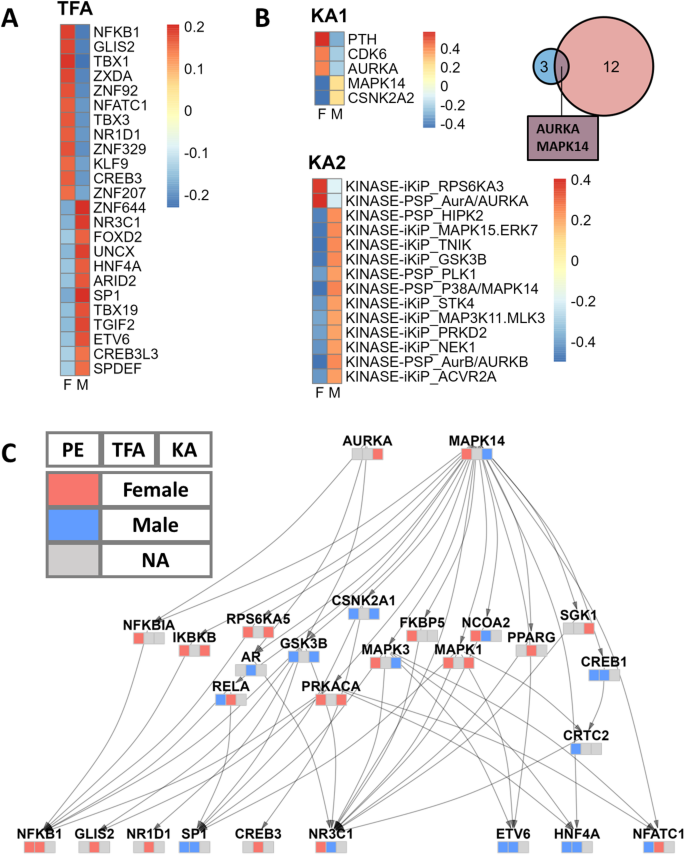
Sex-Biased Protein Signaling Network. A. Sex differences in TF activity, analyzed using the TIGER method. TFs of interest were selected based on the Limma differential analysis with an adjusted p-value less than 0.05. Color indicates the average TF activity of female and male patients. B. Sex differences in kinase activity were identified using TIGER (KA1) and PTM-SEA (KA2) analyses. KA1 identified five kinases with an adjusted p-value cutoff of < 0.25, while KA2 identified fourteen kinases with an adjusted p-value cutoff of < 0.1. The Venn diagram illustrates the intersection of kinases from both analyses. Heatmap color indicates the average kinase activity of female and male patients. C. The sex-biased protein signaling network, constructed using the OmniPath PPI network database, links the kinases of interest to the TFs of interest. Each node is annotated with a heatmap indicating the direction of change in protein expression (left), TF activity (middle), and kinase activity (right). A red tile indicates higher levels in females, a blue tile indicates higher levels in males, and a gray tile indicates that the gene information is missing in this channel. PE: Protein Expression; TFA: Transcription Factor Activity; KA: Kinase activity
To integrate TF activity results from TCGA with kinase activity results from CPTAC, we curated a focused signaling network using the OmniPath protein interaction database [24] (Fig. 3C). The network, constructed with the OmniPathR package (version 3.8.0), connects the two sex-biased kinases we identified (AURKA and MAPK) to all the sex-biased TFs. To balance comprehensiveness with sparsity and interpretability, we included paths up to three steps in length. Notably, the network highlighted the androgen receptor (AR) as a significant sex-biased intermediate node, consistent with the role of steroid sex hormones in LUAD. Over-representation analysis (ORA) on the network nodes revealed significant over-representation of cancer-related KEGG signaling pathways, such as MAPK, Wnt, mTOR signaling, and PD-1 checkpoint, along with distinctly sex-biased pathways like the estrogen signaling pathway (Supplementary Figure S1; Supplementary Table S8).
It is worth noting that when labeling the nodes by their protein expression and TF/kinase activity, we observed instances where information was missing or conflicting, emphasizing the complexity of biological systems and the necessity of a multi-omics approach. For instance, while AURKA’s protein expression is below the detection threshold and therefore missing, our method effectively identified it as displaying female-biased kinase activity.
Sex-biased survival outcomes are associated with immune response
To investigate whether sex differences in protein signaling networks might explain the better survival outcomes observed in females with LUAD, we performed survival analysis using sex-biased signaling proteins (those in Fig. 3C) and patient survival data from CPTAC. We began with an over-representation analysis of the previously identified sex-biased signaling proteins using the Gene Ontology Biological Processes (GO-BP) database, and found 22 significantly enriched GO terms (adjusted p-value < 0.05; Supplementary Table S9). For each GO term, we computed an overall GO term score as the average protein abundance of the associated proteins. We then fit a Cox PH model for each GO term score, including sex and GO term scores as the main effects and testing their interaction term, while adjusting for age, race, smoking status, and tumor stage (Methods). Our analysis revealed that the top five most significantly sex-associated GO term scores (sex*score interaction term) are all immune-related, including scores for “regulation of defense response” (p-value = 0.02) and “inflammatory response” (p-value = 0.04). These scores were associated with better survival outcomes in females but showed little to no significant impact in males (Supplementary Figure S2).
A limitation of the survival analysis using the CPTAC data is the absence of certain protein abundance measurements and incomplete treatment information. To partially address this, we conducted an additional survival analysis using TCGA data, focusing on the target genes of our protein signaling network by constructing a kinase-TF-gene tripartite network. We first selected the top 200 target genes from the nine transcription factors shown in Fig. 3C, based on their node indegrees (the sum of TIGER absolute edge strengths). We then repeated the GO term over-representation and Cox PH model analyses for each of the significant GO terms (Supplementary Table S10). Consistent with the results on CPTAC, the most significant GO terms associated with sex differences in survival outcomes (sex*score interaction term; p-value < 0.05) were immune-related (Supplementary Figure S3A). The concordant findings between the CPTAC analysis (examining upstream signaling proteins) and TCGA analysis (examining downstream target genes) indicate a critical role for immune responses in driving sex-biased survival outcomes and emphasize the strength of our multi-omics analysis.
Lastly, to identify which immune cells are most associated with sex‑biased survival outcomes, we downloaded TCGA‑LUAD immune cell deconvolution data from the TIMER2.0 [40] website and repeated the same Cox PH model analysis for each immune cell concentration (as above). We identified CD4 + naïve T cell, CD8 + T cell, Monocyte, Macrophage, and M2‑macrophage as significantly associated with sex‑biased survival outcomes (Supplementary Figure S3B). Specifically, higher CD8 + T‑cell abundance was associated with a lower hazard among males, higher monocyte abundance with a higher hazard among males, and higher CD4 + naïve T-cell abundance with a lower hazard among females—findings broadly consistent with prior reports [41,42,43,44]. Surprisingly, we found that higher M2-macrophage abundance was associated with a lower hazard among males. This finding is in contradiction to the established pro-tumorigenic role of M2 macrophages in many solid tumors [45, 46] and suggests a male-specific function that requires further study.
Sex-biased regulation of histone acetylation
In cancer, aberrant histone acetylation can lead to the inactivation of tumor suppressors or the activation of oncogenes [47,48,49]. Histone acetyltransferases (HATs) and histone deacetylases (HDACs), the key regulators of histone acetylation, have also been implicated in driving sex differences in both normal tissues and cancers [50,51,52]. Recently, Saha and colleagues reported that Panobinostat, an HDAC inhibitor, may exhibit greater efficacy in males with LUAD because in their gene regulatory network models, its target, CDKN1A, is estimated to be under weaker regulatory control in males and thus more easily perturbed [15]. Nevertheless, the differential roles of HATs and HDACs in regulating histone acetylation and altering downstream transcription between males and females with LUAD remain poorly understood.
CPTAC provides detailed information on histone acetylation, offering an unparalleled opportunity to investigate the sex-biased, histone-associated regulatory effects in LUAD. We used Least Absolute Shrinkage and Selection Operator (LASSO) regression with the CPTAC data to infer a network involving HATs and HDACs and site-specific histone acetylation levels. Specifically, we treated each histone acetylation site as the dependent variable and the set of HAT and HDAC proteins as a multivariate set of predictors, then applied LASSO regression with bootstrap to fit a penalized linear model (Methods).
We observed distinct sex-biased patterns of histone acetylation characterized by numerous positive relationships (positive LASSO coefficients) between the abundance of HATs and various acetylation sites (Fig. 4). The EP300 gene encodes p300, an HAT that plays a role in regulating cell proliferation and differentiation. We found that EP300 has a positive relationship with three specific histone acetylation sites exclusively in the female group. This is consistent with reports of sex-biased EP300 activity in LUAD [53] suggesting that EP300 may play a role in female-specific epigenetic regulation. In contrast to the female-specific role for EP300, both HAT1 and NCOA1 have a male-specific positive relationship with histone acetylation sites, indicating they may help determine sex-biased disease processes in individuals with LUAD.
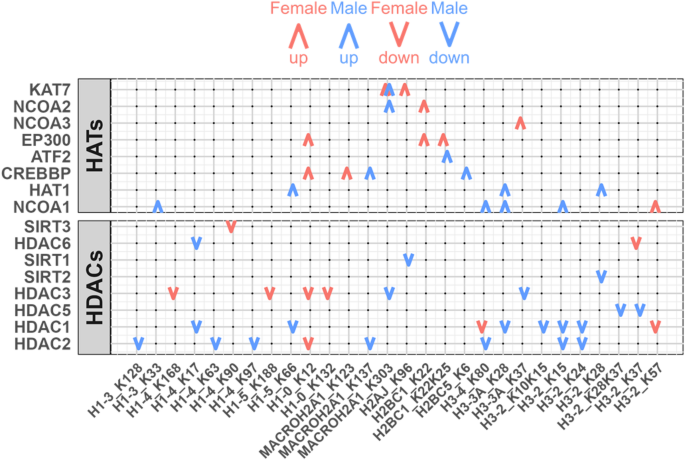
Sex-Biased Regulation of Histone Acetylation. Regulation of histone acetylation sites by HATs and HDACs. Red and blue colors represent females and males. Upward and downward arrows represent positive and negative conditional associations between regulators and histone acetyl sites. LASSO regression with bootstrap was used to select significant associations (Methods)
HDACs, known for their role in reducing acetylation levels [54] also showed sex-biased patterns. As expected, in both sexes we found negative relationships (those with negative LASSO coefficients) between HDAC abundance and histone acetylation levels (Fig. 4). However, the magnitude of these negative relationships was more pronounced in the male group (Supplementary Figure S4; Wilcoxon signed rank test, p-value < 0.05), suggesting increased HDAC-mediated deacetylation activity in males. This finding aligns with previous reports of greater efficacy of HDAC inhibitors in males [15] and underscores the need for further functional and mechanistic investigations into HDACs to define their mechanistic role in LUAD development and, as described below, to understand whether HDAC inhibitors might exhibit sex biases in therapeutic effectiveness.
Sex-biased molecular signatures of clinically actionable proteins
The signaling network model we deduced (Fig. 3C) captures sex-biased patterns with key nodes that suggest potential sex-specific therapeutic strategies. We used the PRISM drug screening database [27] to search for small molecule drugs that might have differential inhibitory effects on male and female LUAD cell lines. We used the Wilcoxon Rank Sum Test to identify drugs targeting nodes in our signaling network with sex-biased small molecule responses. Specifically, sixteen drugs targeting seven proteins demonstrated statistically significant inhibition of either male or female LUAD cell lines (p-value < 0.05; Fig. 5A). We did not adjust p-values in this exploratory analysis, as our goal was to identify a broad range of candidate drugs with potential sex-biased effects. However, we provided both unadjusted and adjusted p-values in Supplementary Table S11. The actual efficacy of these drugs should be rigorously validated through well-designed experimental studies.
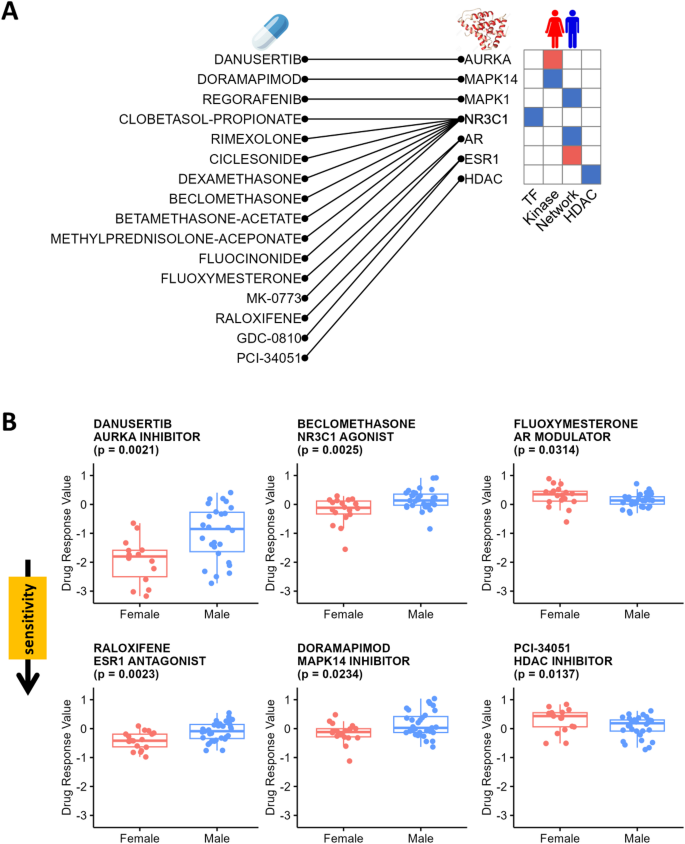
Sex-Biased Molecular Signatures of Clinically Actionable Proteins. A. The mapping of sex-biased small-molecule drugs to their associated clinically actionable proteins (left), alongside the observed sex biases in these clinically actionable proteins across various analyses (right). TFs and kinases are identified through activity analysis; network analysis uncovers intermediate proteins connecting kinases to TFs; HDAC analysis highlights sex-biased HDACs. B. Validation of sex-biased therapies using the PRISM drug screening database. Boxplots show drug response values for male and female LUAD cell lines treated with Danusertib, Beclomethasone, Fluoxymesterone, Raloxifene, Doramapimod, and PCI-34,051, analyzed using Wilcoxon Rank Sum Test. The p-values were not adjusted
Danusertib, an aurora kinase inhibitor, displayed one of the most differences between the sexes (p-value = 0.0021; Fig. 5B)in our analysis with greater inhibitory effects in female LUAD cell lines than in male cell lines, consistent with higher AURKA activities in females. Treatment with NR3C1 agonists, including Beclomethasone (p-value = 0.0025; Fig. 5B) and seven other synthetic corticosteroids (Supplementary Figure S5), exhibited higher sensitivity for female cell lines, consistent with our models’ conclusions that males have stronger NR3C1 activity. We also found that sex steroid hormone receptors, including AR and ESR1, were differentially targeted by several modulators, agonists, and destabilizers (p-values < 0.05; Fig. 5B; Supplementary Figure S6). MAPK14 and MAPK1 inhibitors also have a sex-biased effect (p-values < 0.05; Fig. 5B; Supplementary Figure S7). These drug screening results are all consistent with the sex-biased TF and kinase activities identified through our signaling network analysis.
Because we observed sex differences in relationships between HDACs and histone acetylation sites, we also tested HDAC inhibitors for sex-biased responses and identified one compound, PCI-34,051, exhibiting a statistically significant higher sensitivity treatment effect in male LUAD cell lines compared to females (p-value = 0.0137; Fig. 5B).
As a methodological note, we emphasize that these compounds were all found through our integrative network and histone acetylation analyses. Due to the limited throughput of proteomic data, identifying these proteins via simple differential expression proved challenging (Supplementary Figure S8). This underscores the clinical relevance of sex-biased molecular signatures and the efficacy of systems biology approaches in addressing complex biological questions.
Independent validation of our results
We analyzed LUAD gene expression from GSE68465 (214 females and 209 males) and protein phosphorylation data from the APOLLO-LUAD project (42 females and 45 males); sample numbers reflect those remaining after filtering outliers (Methods). However, in analyzing differential gene expression, protein abundance, and protein phosphorylation, we found discrepancies between our discovery and validation datasets (Supplementary Figure S9). For instance, the Spearman correlation of limma’s t-statistics between CPTAC-LUAD and APOLLO-LUAD for the protein phosphorylation was notably low, a pattern that was also evident in the differential protein and gene expression levels (Spearman correlations = −0.086, −0,017, and − 0.056, respectively; Supplementary Figure S9A). This low concordance between CPTAC-LUAD and APOLLO-LUAD complicates the validation of driver proteins but may be due to the relatively small sample sizes in APOLLO and the imbalance between males and females in CPTAC. Indeed, with larger sample sizes, we saw better correlation between differential gene expression in TCGA-LUAD and GSE68465 (Supplementary Figure S9B; Spearman correlation = 0.34).
Although the above explorative analysis showed consistent discrepancies between CPTAC and APOLLO, we reconstructed the signaling network using the validation dataset (APOLLO and GSE68465) to assess whether the mechanisms observed in the discovery dataset (CPTAC and TCGA) hold true. Indeed, key regulators, including AURKA, NR3C1, and AR, exhibited sex-biased activities in the validation dataset (p-values = 0.03, 0.07, and 0.02, respectively; Supplementary Figure S10), supports some of the findings in the discovery phase, but discrepancies between datasets remained (Supplementary Figure S9-10). Nonetheless, TIGER integrates multi-gene signatures representing known TF or kinase binding events, allowing it to infer robust activity levels despite dataset inconsistency. Our validation results further reinforce the role of AURKA, NR3C1, and AR as pivotal sex-biased network elements and also provide support for the PRISM drug findings reported above.