Trends in SGLT-2 inhibitor prescriptions by purpose
Supplementary Fig. 2 illustrates the trend of the average monthly prescription volume by year, categorized according to the purpose of SGLT-2 inhibitor prescriptions. Of the 6787 patients analyzed, 5805 (85.5%) were prescribed SGLT-2 inhibitors for DM, 550 (8.1%) for CKD, and 432 (6.4%) for HF. Prescriptions have been rapidly increasing since 2018, with the number of prescriptions in 2023 being approximately 7.4 times higher than in 2018. Additionally, both CKD and HF prescriptions exhibited a marked rise from 2020 onward.
Baseline characteristics and prevalence of erythrocytosis
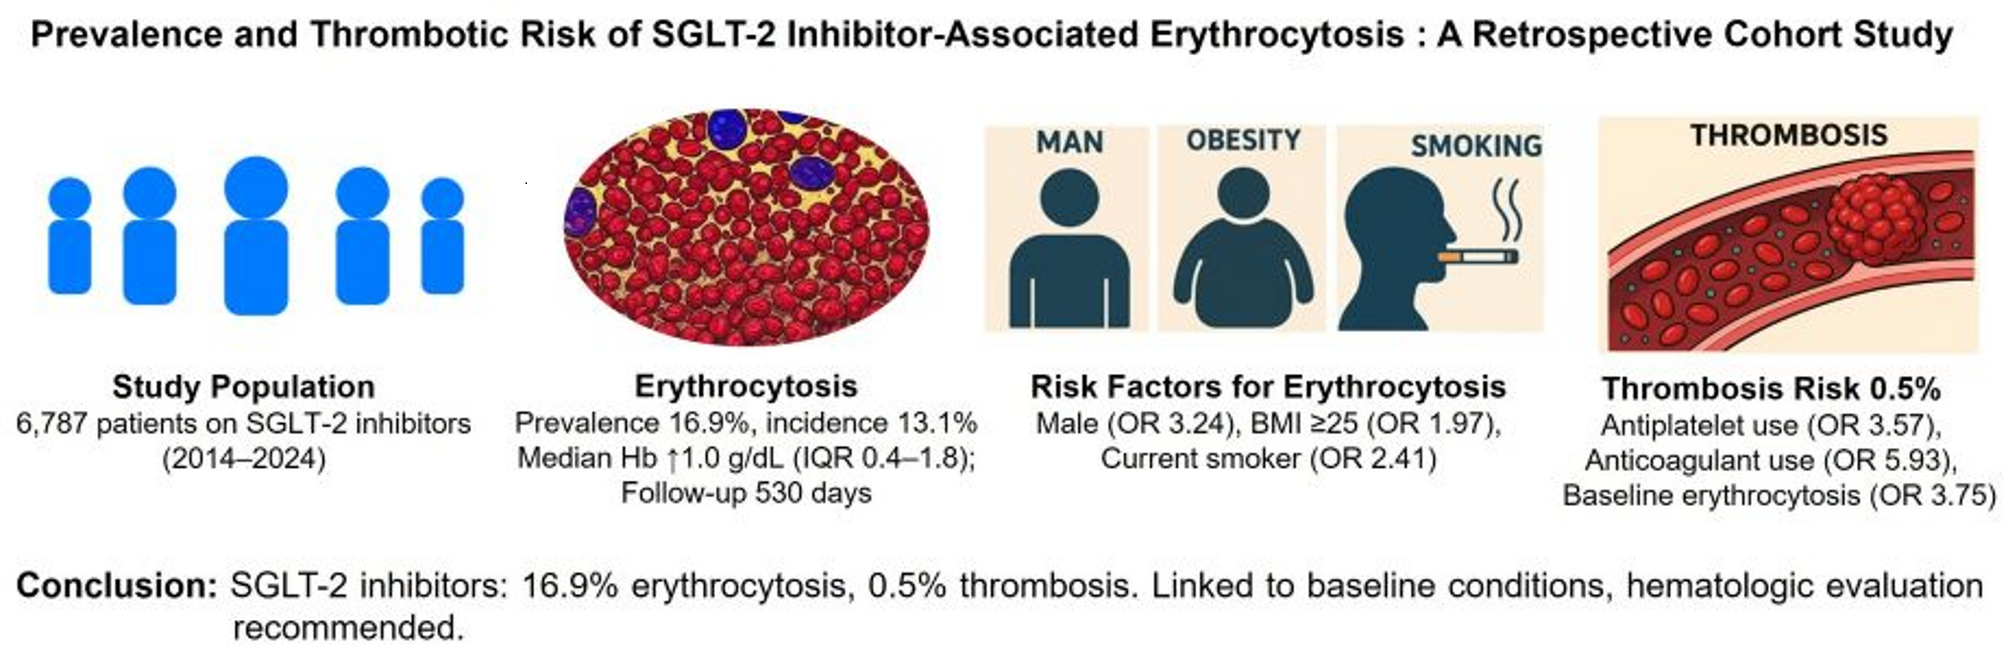
Among the 6787 patients included in this retrospective study at Bundang Seoul National University Hospital, 1145 (16.9%) developed erythrocytosis after initiating SGLT-2 inhibitor therapy, while 5642 (83.1%) did not. The median follow-up was 530 days (IQR, 277–981 days) for the overall cohort and 773 days (IQR, 445–1305 days) for the erythrocytosis subgroup. Table 1 summarizes the baseline characteristics of the study population, stratified by the presence of erythrocytosis. Patients with erythrocytosis were significantly younger, with only 11.2% being ≥ 70 years of age compared to 37.5% in the non-erythrocytosis group (p < 0.001). Males were more prevalent in the erythrocytosis group (88.9% vs. 60.0%, p < 0.001). A higher proportion of patients with erythrocytosis had a BMI ≥ 25 kg/m2 (63.9% vs. 48.1%, p < 0.001). Regarding comorbidities, DM was more frequent in patients with erythrocytosis (89.9% vs. 85.4%; p < 0.001). In contrast, comorbidities including hypertension (HTN), dyslipidemia (DL), HF, CKD, coronary artery disease (CAD), cerebrovascular accident (CVD), peripheral artery disease (PAD), and chronic obstructive pulmonary disease (COPD), were more prevalent in the non-erythrocytosis group (all p < 0.001).
Current smoking (40.0% vs. 15.7%) and alcohol consumption (35.2% vs. 19.5%) were more prevalent in the erythrocytosis group (both p < 0.001). SGLT-2 inhibitor type did not differ (p = 0.590), with dapagliflozin most common (57.2%). Antiplatelet use was less frequent in the erythrocytosis group (36.3% vs. 41.9%; p = 0.001), while anticoagulation was similar (12.1% vs. 11.4%, p = 0.516). Baseline erythrocytosis was significantly more common in the erythrocytosis group than in the non-erythrocytosis group (26.6% vs. 1.2%; p < 0.001). In the analysis excluding patients with baseline erythrocytosis (n = 372), the incidence of erythrocytosis was 13.1% (n = 840/6415).
Multivariable analysis of risk factors for erythrocytosis
To address the potential impact of baseline erythrocytosis, a sensitivity analysis was performed by excluding patients with baseline erythrocytosis (n = 372). The remaining cohort (n = 6415) was analyzed for erythrocytosis risk factors. Multivariable analysis identified several risk factors for erythrocytosis (Table 2). Male sex (OR 3.24, 95% CI 2.47–4.26), BMI ≥ 25 kg/m2 (OR 1.97, 95% CI 1.63–2.39), and current smoking (OR 2.41, 95% CI 1.96–2.96) were strongly associated with increased risk (all p < 0.001). Conversely, age ≥ 70 years (OR 0.46, 95% CI 0.35–0.59), HTN (OR 0.71, 95% CI 0.58–0.86), DL (OR 0.67, 95% CI 0.55–0.81), and CKD (OR 0.51, 95% CI 0.40–0.66) were associated with reduced risk. PAD, and COPD also showed protective effects (Table 2).
Effect of SGLT-2 inhibitors on hematologic parameters
Figure 1 illustrates the changes in Hb and Hct from baseline to peak levels in the total cohort. The median Hb increase for the entire cohort was 1.0 g/dL (IQR, 0.4–1.8 g/dL, p < 0.001), and the median Hct increase was 3.5% (IQR, 1.4–5.7%, p < 0.001). The median time to peak Hb was 210 days (IQR, 109–434 days) following SGLT-2 inhibitor initiation. Compared to baseline Hb and Hct, peak Hb and Hct showed a statistically significant increase, indicating a significant hematologic response to SGLT-2 inhibitor therapy, consistent with the known erythropoietic effects of these agents. Figure 2 shows that the change in Hb levels significantly differs based on the purpose of treatment (p < 0.05). CKD patients showed a median Hb increase of 0.9 (IQR, 0.3–1.6), while DM patients had a median increase of 1.0 (IQR, 0.4–1.7). HF patients exhibited the highest median Hb increase at 1.3 (IQR, 0.5–2.1). This indicates that HF patients experienced the most significant rise in Hb levels, whereas CKD patients showed the lowest increase. Patients without baseline erythrocytosis exhibited significantly greater Hb changes compared to those with erythrocytosis (p < 0.05). The median Hb change was 1.1 (IQR, 0.4–1.8) in patients without erythrocytosis, whereas it was 0.3 (IQR, -0.4–0.8) in those with erythrocytosis (Fig. 3). Table 3 summarizes the hematologic parameters at baseline and peak levels for the total cohort (n = 6787), stratified by sex. Significant sex differences were observed in both baseline and peak Hb and Hct levels, with males consistently exhibiting higher values than females.
Changes in hematologic parameters from baseline to peak levels
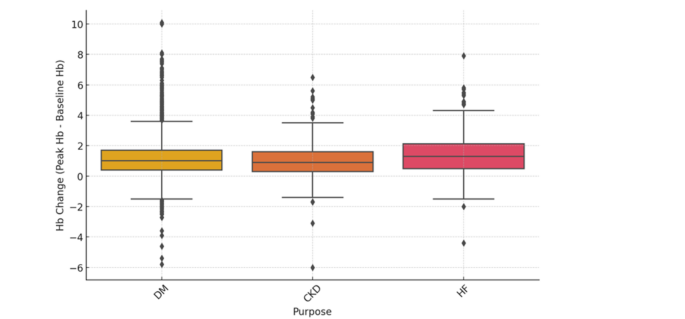
Hemoglobin change across different purposes
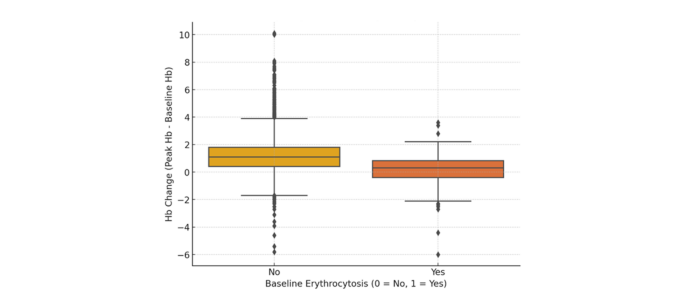
Hemoglobin change by baseline erythrocytosis status
Among patients with erythrocytosis (n = 1145), the median hemoglobin increase was 1.4 g/dL (IQR, 0.8–2.2), and the median hematocrit increase was 4.7% (IQR, 2.7–6.8). The median time to peak hemoglobin was 361 days (IQR, 161–634). Serial Hb changes were assessed over 12 months in 769 patients receiving SGLT-2 inhibitors with at least 12 months of Hb follow-up data (Fig. 4). Hb levels rose rapidly within the first 3 months, followed by a more gradual increase, maintaining an overall upward trend over the 12-month period.
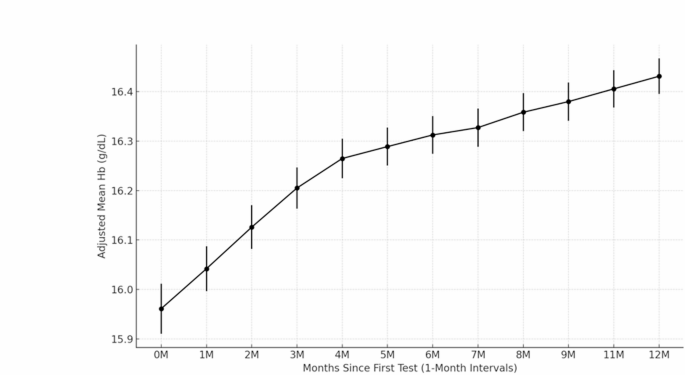
12-month hemoglobin trends
Of the 6787 patients, 4756 (70.1%) continued treatment, 944 (13.9%) were lost to follow-up or referred out, and 1087 (16.0%) discontinued treatment. Among the 983 patients with known reasons for discontinuation (excluding 104 patients with unknown reasons), the most common were poor DM control (34.7%), side effects other than erythrocytosis (32.2%), and diabetes medication reduction (14.3%), with erythrocytosis accounting for only 5 (0.5%) discontinuations.
Among patients who developed erythrocytosis while using SGLT-2 inhibitors, hematology consultations occurred in 18 (1.6%) patients, with median serum erythropoietin (EPO) levels of 12.5 mIU/mL (range 7.1–17.61 mIU/mL, reference 2.59–18.50 mIU/mL). Of these, 10 (55.6%) underwent JAK2 mutation testing, 4 (22.2%) had bone marrow examinations, 2 (11.1%) received phlebotomy, and 2 (11.1%) were prescribed aspirin. Four patients discontinued SGLT-2 inhibitors: two due to erythrocytosis (one resolved spontaneously, and one improved with phlebotomy) and two due to well-controlled diabetes (Supplementary Fig. 3).
Thrombosis risk factors
Among the 6787 patients, 0.5% (33 patients) developed thrombosis during the treatment period with SGLT-2 inhibitors (Table 4). HF was more common in the thrombosis group (33.3% vs. 19.5%, p = 0.046), as were antiplatelet use (63.6% vs. 40.8%, p = 0.008), anticoagulant use (36.4% vs. 11.4%, p < 0.001), and baseline erythrocytosis (15.2% vs. 5.4%, p = 0.032). Other factors, including age ≥ 70 years, sex, BMI, eGFR, most comorbidities (e.g., DM, HTN. CAD), smoking, and alcohol use, showed no significant differences between groups.
Antiplatelet agent use (OR 3.57, 95% CI 1.60–7.97, p = 0.002), anticoagulant use (OR 5.93, 95% CI 2.60–13.57, p < 0.001), and baseline erythrocytosis (OR 3.75, 95% CI 1.41–9.96, p = 0.008) were significantly linked to an increased risk of thrombosis in multivariable analysis (Table 5).
Among 33 patients, five patients had erythrocytosis at the time of the thrombosis event and had experienced at least one episode of erythrocytosis within the preceding six months. Notably, all five patients exhibited arterial thrombosis without any venous thrombosis events. However, these five patients also had underlying conditions (atrial fibrillation, severe coronary calcification, large artery atherosclerosis) associated with their thrombosis events, making it unlikely that the thrombosis events were directly related to erythrocytosis. Thrombotic events occurred in 1.8% (n = 21) of the erythrocytosis group, compared with 0.2% (n = 12) in the non-erythrocytosis group (p < 0.001). Within the erythrocytosis group, peak Hb levels were stratified into tertiles: low (16.1–16.9 g/dL), medium (16.9–17.5 g/dL), and high (17.5–22.0 g/dL). Thrombosis rates were 1.4% (n = 6), 2.2% (n = 8), and 2.0% (n = 7), respectively (p = 0.649), suggesting no clear dose–response relationship between Hb levels and thrombosis.