Patient’s baseline characteristics
The study included 3,352 patients, with a predominance of males (70.7%) and a mean age of 68.90 ± 11.88 years (Table 1). The mean weight was 85.17 ± 23.30 kg. Comorbidities were prevalent, including congestive heart failure (50.0%), hypertension (41.7%), diabetes (47.6%), and chronic pulmonary disease (21.4%). AKI was present in 80.3% of patients, while sepsis was observed in 42.7%. The mean severity scores were as follows: APSIII (42.42 ± 19.70), SAPSII (37.88 ± 12.91), SOFA (5.98 ± 3.57), and Charlson Comorbidity Index (6.03 ± 2.80). Invasive ventilation was required in 57.2% of cases. Medication use included aspirin (90.6%), antihypertensives (92.9%), and statins (18.6%). Laboratory findings revealed a mean hemoglobin level of 12.21 ± 2.22 g/dL, platelet count of 223.17 ± 80.10 × 10⁹/L, and elevated creatinine (1.53 ± 1.61 mg/dL) and BUN (25.94 ± 18.13 mg/dL). Coagulation and electrolyte profiles were within expected ranges, with an INR of 1.28 ± 0.56 and serum sodium of 138.08 ± 4.19 mEq/L.
SHR according to quartile groups
Patients were stratified into quartiles (Q1 [< 0.872, n = 839], Q2 [0.872–1.034, n = 838], Q3 [1.034–1.286, n = 837], Q4 [> 1.286, n = 838]) based on SHR levels, with significant differences observed across multiple clinical and laboratory parameters (Table 1). The proportion of male patients decreased from 71.8% in Q1 to 66.1% in Q4 (P = 0.001), while no significant age or weight differences were noted. Notably, higher SHR quartiles (Q3–Q4) exhibited increased prevalence of acute kidney injury (84.6% in Q4 vs. 79.7% in Q1, P < 0.001), sepsis (49.8% vs. 40.4%, P < 0.001), and congestive heart failure (61.3% vs. 42.8%, P < 0.001). Additionally, hypertension was more frequent in Q1 (46.0%) compared to Q4 (33.4%, P < 0.001), whereas diabetes showed a U-shaped distribution (highest in Q1 [50.1%] and Q4 [56.7%], P < 0.001). Disease severity scores, including APSIII, SAPSII, SOFA, Charlson Comorbidity Index, and OASIS, demonstrated a progressive increase from Q1 to Q4, with Q4 patients presenting the highest illness severity (all P < 0.001). Medication analysis revealed declining statin (19.7% in Q1 vs. 15.2% in Q4, P = 0.009) and aspirin use (95.0% vs. 87.4%, P < 0.001), but higher corticosteroid administration in Q4 (14.1% vs. 9.2%, P < 0.001). Laboratory findings further highlighted metabolic disturbances in higher SHR groups, with Q4 exhibiting lower hemoglobin (11.80 vs. 12.38 g/dL, P < 0.001), RBC count (3.91 vs. 4.18 × 10¹²/L, P < 0.001), and sodium levels (136.72 vs. 139.20 mEq/L, P < 0.001). Conversely, creatinine (1.77 vs. 1.44 mg/dL), BUN (30.15 vs. 23.97 mg/dL), INR (1.34 vs. 1.25), and potassium (4.36 vs. 4.17 mEq/L) were significantly elevated in Q4 (all P < 0.001). These findings collectively suggest that elevated SHR is associated with greater comorbidity burden, heightened disease severity, and adverse metabolic profiles, underscoring its potential prognostic utility in clinical risk stratification.
All-cause mortality outcome based on SHR quartile groups
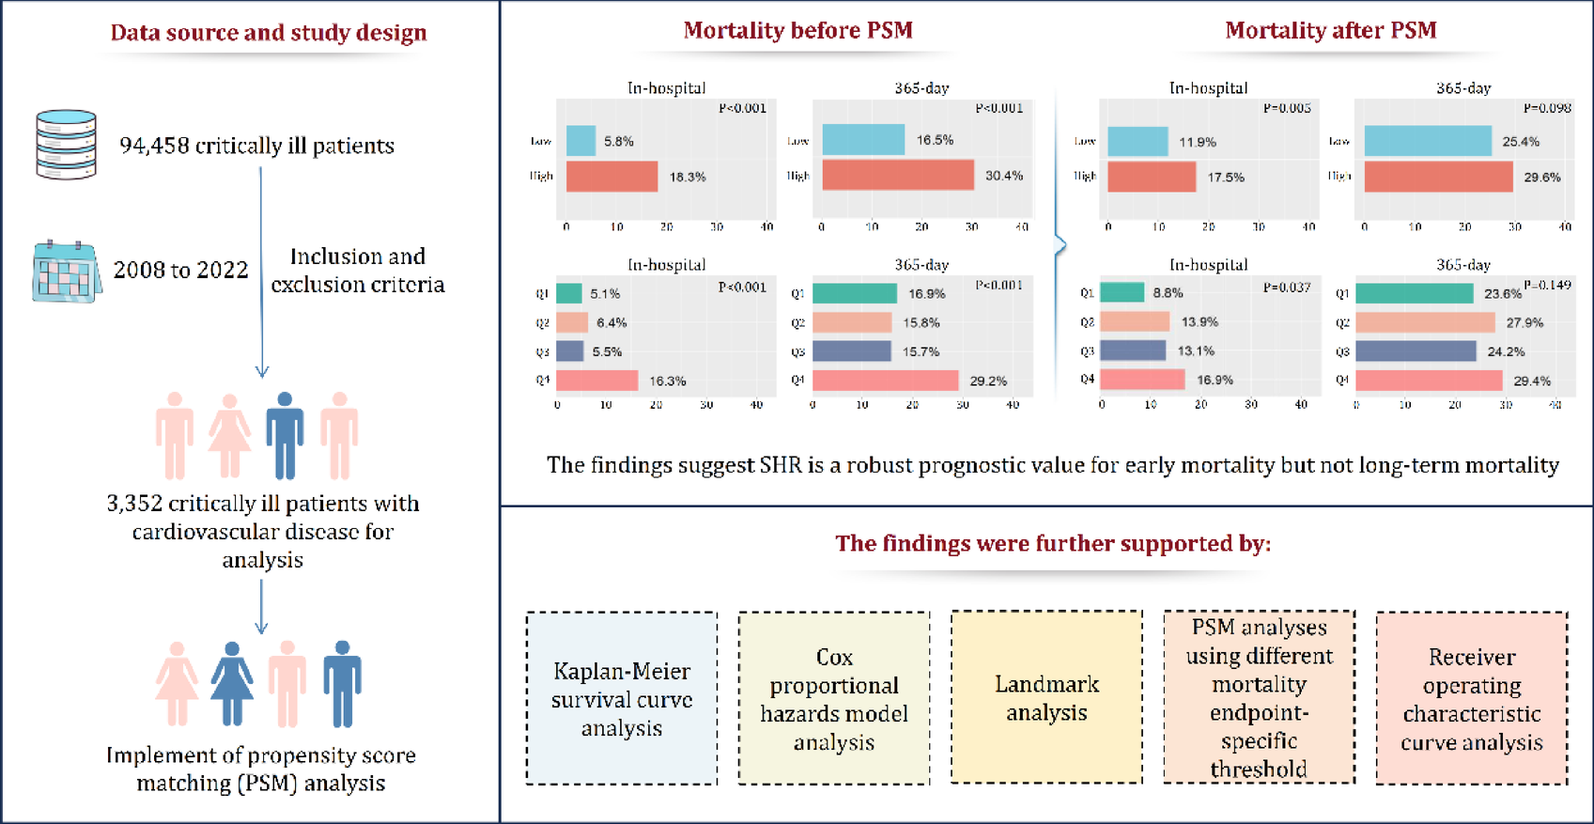
Patients stratified by SHR quartiles demonstrated significant differences in mortality outcomes across all time points (Supplementary Materials Table S3). The highest mortality rates were consistently observed in Q4 (highest SHR group), with a relatively similar mortality rate among Q1 to Q3. In detail, in-hospital mortality was markedly higher in Q4 (16.3%) compared to Q1–Q3 (5.1–6.4%, P < 0.001). This pattern persisted through all follow-up periods, with 28-day mortality (16.3% vs. 5.6–7.9%, P < 0.001), 90-day mortality (22.3% vs. 10.8–11.1%, P < 0.001), and 365-day mortality (29.2% vs. 15.7–16.9%, P < 0.001) all showing similar graded associations. In addition, the length of ICU stay followed a comparable trend, with Q4 patients requiring significantly longer ICU care (mean 4.95 days) than those in lower quartiles (range 3.59–4.08 days, P < 0.001). These findings demonstrate a clear significant association between increasing SHR levels and worsening short- and long-term mortality outcomes, as well as greater ICU resource utilization. In addition, the Kaplan-Meier survival analysis (Fig. 2) confirmed these findings, showing progressively worse survival curves in Q4 across the entire follow-up period (log-rank, P < 0.001). The survival differences between quartiles became particularly pronounced, with the Q4 group maintaining the highest mortality risk throughout the first year of follow-up. Regarding early mortality, the Kaplan-Meier survival analysis (Fig. 3) also demonstrated progressively worse survival outcome from Q1 to Q4 in 14-day mortality and 28-day mortality (log-rank, P < 0.001).
Kaplan-Meier survival curves for the entire follow-up duration by SHR quartiles before PSM. Long-term survival analysis showing significantly different mortality risks across SHR quartiles (log-rank P < 0.001), with Q4 (highest SHR) demonstrating the worst survival outcomes. The curves represent the complete follow-up period while the 90- and 365-day endpoints remains the primary analytical focus
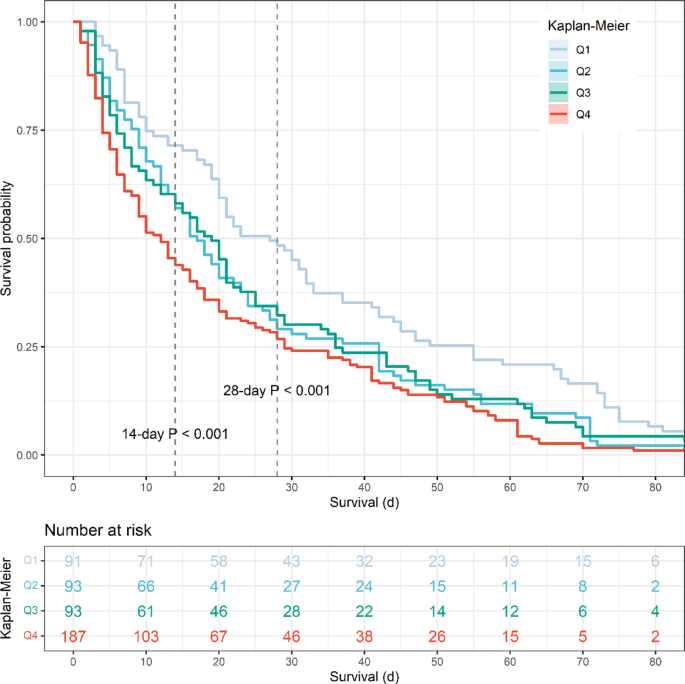
Early mortality analysis by SHR quartiles before PSM. Kaplan-Meier curves demonstrating progressively worse 14-day and 28-day survival outcomes from Q1 to Q4 (log-rank P < 0.001), highlighting the acute prognostic value of elevated SHR
Cox proportional hazard model analysis of SHR for all-cause mortality
The association between stress hyperglycemia ratio (SHR) and all-cause mortality was evaluated using Cox proportional hazard models across multiple time points (Table 2). Three progressively adjusted models were constructed to examine this relationship. In the unadjusted Model 1, continuous SHR demonstrated strong associations with all mortality endpoints, with HRs decreasing over time: in-hospital mortality (HR 2.265, 95% CI 1.865–2.750), 28-day (HR 2.286, 1.891–2.764), 90-day (HR 2.071, 1.739–2.466), and 365-day mortality (HR 1.942, 1.648–2.288) (all P < 0.001). Quartile analysis revealed a significant association, with Q4 (highest SHR) showing significantly elevated risks compared to Q1 (reference) across all time points (in-hospital HR 3.618; 365-day HR 2.028; all P < 0.001). Significant positive trends were observed for all mortality outcomes (P for trend < 0.001). After adjustment for demographic and clinical variables in Model 2, the associations remained significant though slightly attenuated. Continuous SHR maintained strong predictive value (in-hospital HR 1.936, 95% CI 1.576–2.377; 365-day HR 1.679, 1.412–1.997; all P < 0.001). The Q4 group continued to demonstrate substantially higher mortality risk (in-hospital HR 3.172; 365-day HR 1.801; all P < 0.001), with persistent significant trends (all P < 0.001). In the fully adjusted Model 3 incorporating severity scores and laboratory parameters, continuous SHR remained independently predictive of mortality, though with further attenuation of effect sizes (in-hospital HR 1.445, 95% CI 1.145–1.822, P = 0.002; 365-day HR 1.289, 1.065–1.561, P = 0.009). The Q4 group maintained significant associations for in-hospital (HR 2.164, P = 0.001) and 28-day mortality (HR 2.243, P < 0.001), but the relationships became non-significant for longer-term endpoints (90-day P = 0.061; 365-day P = 0.164). Trend tests remained significant for in-hospital through 90-day mortality (P < 0.04). These results demonstrate that elevated SHR is an independent predictor of all-cause mortality, with the strongest associations observed for early mortality outcomes. The attenuation in the fully adjusted model (Model 3) indicates that part of SHR’s predictive power relates to its association with illness severity and metabolic derangements.
RCS curve analysis
The RCS analysis was performed to evaluate the relationship between SHR and mortality outcomes. The results demonstrated a significant overall association between SHR and in-hospital mortality (P < 0.001, Fig. 4A), 28-day mortality (P < 0.001, Fig. 4B), 90-day mortality (P < 0.001, Fig. 4C), and 365-day mortality (P < 0.001, Fig. 4D). Furthermore, the nonlinearity tests were also statistically significant for all outcomes (all P < 0.001), except for 28-day mortality, which showed a marginally higher P-value (P = 0.002) but remained below the significance threshold. The RCS curves revealed a U-shaped relationship between SHR and mortality risk, with the lowest risk observed at moderate SHR levels and a sharp increase in mortality at both low and high extremes. This pattern was consistent across all time points, suggesting that both excessively low and high SHR values are associated with poorer clinical outcomes. To further confirm the U-shaped curve, this study further refined the SHR grouping by dividing the continuous SHR variable into sextiles (S1 [< 0.810, n = 560], S2 [0.810–0.923, n = 559], S3 [0.923–1.034, n = 558], S4 [1.034–1.176, n = 558], S5 [1.176–1.440, n = 558], S6 [> 1.440, n = 559]) (Supplementary Material Table S4). This more granular stratification revealed a clear U-shaped mortality pattern across all time points, with both the lowest (S1) and highest (S6) SHR groups demonstrating elevated mortality risks compared to S2 groups (the lowest mortality group). For example, the nadir of mortality risk consistently occurred in S2 (e.g., 3.9% in-hospital mortality) with progressive risk increases toward both extremes (5.5% in S1 and 20.2% in S6 for in-hospital mortality). This pattern was consistently observed for 28-day, 90-day, and 365-day mortality outcomes, robustly confirming the RCS-derived U-shaped relationship.
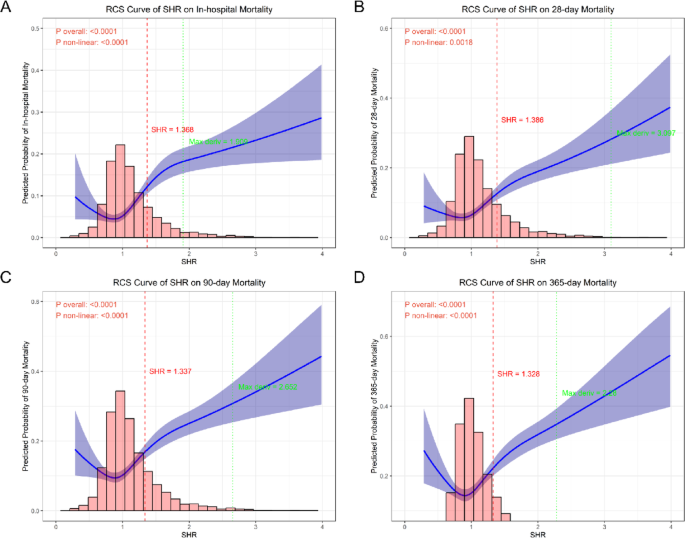
Restricted cubic spline analysis of SHR-mortality relationships. Nonlinear associations between continuous SHR values and mortality risk at (A) in-hospital, (B) 28-day, (C) 90-day, and (D) 365-day timepoints, demonstrating U-shaped relationships (all nonlinearity P < 0.001) with identified optimal thresholds (dashed vertical lines)
Further threshold analysis identified optimal cutoff values of SHR for predicting mortality outcomes: 1.368 for in-hospital mortality, 1.386 for 28-day mortality, 1.337 for 90-day mortality, and 1.328 for 365-day mortality. These thresholds demonstrated consistent discriminative capacity across different time points, with the mean cutoff of 1.355. Notably, all identified thresholds fell within the range where the RCS curves began to exhibit a steep upward trajectory, corresponding to the inflection points where mortality risk increased substantially. This finding reinforces the clinical relevance of monitoring SHR levels, as values exceeding these thresholds may warrant intensified monitoring or therapeutic intervention.
PSM analysis
Based on the mean optimal SHR cutoff value for mortality prediction, Patients were stratified into SHR-low ( ≦ 1.355) and SHR-high (> 1.355) groups. Prior to PSM, significant baseline imbalances were observed between the two groups (Table 3). Multiple clinical characteristics showed statistically significant differences (P < 0.05), including gender (P = 0.013), age (P = 0.005), and key comorbidities such as AKI (P < 0.001), sepsis (P < 0.001), and congestive heart failure (P < 0.001). Disease severity scores also differed significantly, with higher values in the SHR-high group for APSIII (P < 0.001), SAPSII (P < 0.001), and SOFA (P < 0.001). Laboratory parameters including platelet count, RBC, creatinine, BUN and electrolytes all showed significant variations (all P < 0.05). SMD before PSM ranged up to 0.414 for sodium, with 71.43% (25/35) variables exceeding the 0.1 threshold for meaningful imbalance.
Following PSM (Table 4), the analysis included 670 well-matched pairs with excellent balance achieved across all measured characteristics. All baseline variables showed no significant differences between groups (P-values ranging from 0.237 to 1.000), and SMD values improved substantially to below 0.1 (range 0.002–0.065) (Fig. 5). To elaborate, key severity markers demonstrated particularly good balance, including APSIII (SMD = 0.013), SOFA (SMD = 0.002), and Charlson index (SMD = 0.037). The matching process successfully balanced demographic factors, comorbidities, and laboratory values, with all post-matching SMD values below the 0.1 threshold, indicating negligible differences between groups. These results demonstrate that while significant confounding by disease severity existed in the original cohort, particularly for metabolic and organ dysfunction markers, the PSM effectively created comparable groups for subsequent analysis. The excellent post-matching balance (all P > 0.05 and SMD < 0.1) validates the robustness of the matching algorithm and provides a solid foundation for unbiased assessment of SHR’s association with clinical outcomes. This methodological approach effectively mitigates selection bias and enables more reliable causal inference regarding the prognostic impact of SHR levels in this patient population. In addition, the distribution of propensity scores (Supplementary Materials Figure S1 and Supplementary Materials Figure S2) further demonstrated that the matching procedure successfully created overlapping distributions between SHR-low and SHR-high groups, with nearly identical density curves and complete coverage within the region of common support. This indicates that the propensity score model was properly specified and that comparable patients were effectively matched across the full range of clinical characteristics.
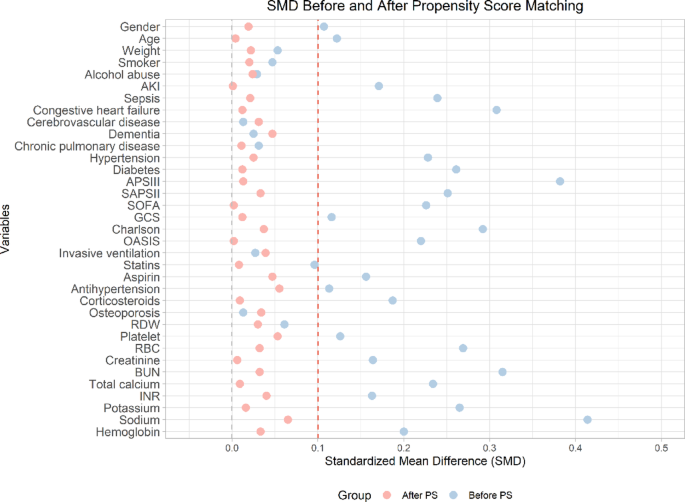
Standardized mean differences before and after PSM. Covariate balance assessment showing reduction in standardized mean differences (SMD) for all 35 clinical variables after propensity score matching (all post-match SMD < 0.1), confirming successful balance between SHR-high and SHR-low groups
SHR and all-cause mortality outcome after PSM analysis
Before PSM (Supplementary Materials Table S5), the high SHR group (n = 695) showed significantly higher mortality rates compared to the low SHR group (n = 2,657) across all time points (All P < 0.001) and longer ICU stays (5.16 vs. 3.81 days, P < 0.001). After PSM (Supplementary Materials Table S6), the cohorts were balanced (n = 670 per group), and mortality disparities persisted but were attenuated: in-hospital mortality (P = 0.005) and 28-day mortality (P = 0.005) remained higher in the high SHR group, while 90-day (P = 0.053) and 365-day (P = 0.098) differences lost statistical significance. ICU stay differences also diminished (5.11 vs. 4.61 days, P = 0.135). The results suggest that while high SHR is associated with worse outcomes, PSM adjustment reduces the magnitude of the associations for long-term mortality outcome. However, the persistent early mortality gap suggests SHR maintains a prognostic value for early mortality outcomes after adjusting for potential clinical confounders.
Furthermore, we performed a landmark analysis with a 28-day survival threshold (landmark time) following PSM. After excluding 197 cases of early mortality, we analyzed long-term outcomes in the remaining cohort of 1,143 patients (low SHR group: n = 590; high SHR group: n = 553). The results demonstrated no significant differences in 365-day mortality (low SHR: 15.3% vs. high SHR: 14.6%, p = 0.838), 90-day mortality (8.0% vs. 7.2%, p = 0.722), or ICU length of stay (4.21 vs. 4.88 days, p = 0.063), reinforcing that SHR does not independently predict long-term mortality even after accounting for early deaths. These findings, detailed in Supplementary Materials Table S7, confirm the robustness of our primary analysis by focusing on survivors beyond the acute phase. In addition, to further validate the above associations between SHR and mortality, we conducted additional threshold analyses using alternative SHR cut-off values, with the optimal predictive thresholds of 1.368 for in-hospital mortality (Supplementary Materials Table S8), 1.386 for 28-day mortality (Supplementary Materials Table S9), and 1.328 for 365-day mortality (Supplementary Materials Table S10), respectively. These results consistently confirmed that SHR retains robust prognostic value for early mortality outcomes—particularly in-hospital mortality—after PSM adjustment, but its predictive significance diminishes for long-term mortality. For example, when the cut-off value was the optimal predictive thresholds of 1.368 for in-hospital mortality, the in-hospital mortality rate was still significantly higher in the high-SHR group (18.2%) compared to the low-SHR group (11.8%, P = 0.002), while the difference in 365-day mortality between groups (30.0% vs. 25.6%, P = 0.091) still did not reach statistical significance.
To further validate that a high SHR is associated with short-term mortality but has limited predictive value for long-term mortality, we conducted an analysis based on SHR quartiles after PSM. The baseline comparison across the four groups also demonstrated excellent balance in all measured clinical characteristics (Supplementary Materials Table S11). The all-cause mortality outcomes by SHR quartiles after PSM (Supplementary Materials Table S12) revealed that patients in the highest SHR quartile (Q4) had significantly increased in-hospital mortality (16.9% vs. 8.8–13.9% in Q1–Q3, P = 0.037), with a comparable trend observed for 28-day mortality (16.9% vs. 9.9–13.5%, P = 0.065). Although Q4 showed numerically higher rates for both 90-day (22.8%) and 365-day mortality (29.4%) compared to lower quartiles, these differences were not statistically significant (both P > 0.25). These results indicate that elevated SHR maintains its strongest association with early mortality outcomes even after PSM adjustment, while its predictive capacity diminishes with longer-term follow-up.
After PSM, Cox proportional hazard models were also used to evaluate the association between SHR and mortality outcomes in balanced cohorts (Table 5). Three models with progressive adjustments were analyzed. In the unadjusted Model 1, continuous SHR remained significantly associated with all mortality endpoints, though with attenuated effect sizes compared to pre-matched analyses: in-hospital mortality (HR 1.461, P = 0.001), 28-day (HR 1.637, P < 0.001), 90-day (HR 1.457, P < 0.001), and 365-day mortality (HR 1.466, P < 0.001). Binary SHR (high vs. low) showed similar associations, with the strongest effect for in-hospital mortality (HR 1.560, P = 0.005) and diminishing significance over time (90-day HR 1.309, P = 0.045; 365-day HR 1.234, P = 0.087). Quartile analysis revealed that Q4 maintained significantly elevated risks for in-hospital (HR 2.117, P = 0.007) and 28-day mortality (HR 1.859, P = 0.020), but not for longer-term outcomes. A significant positive trend was observed for in-hospital and 28-day mortality (P for trend ≤ 0.012). The results of Model 2 and Model 3 remained largely consistent with Model 1 across all adjustment levels, with elevated SHR maintaining significant associations with mortality outcomes, particularly for short-term endpoints. In addition, the Kaplan-Meier survival analysis (Supplementary Materials Figure S3) confirmed these findings, showing similar survival curves from Q1 to Q4 across the entire follow-up period (log-rank, P = 0.252). Notably, regarding early mortality, the Kaplan-Meier survival analysis (Supplementary Materials Figure S4) demonstrated progressively worse survival outcome from Q1 to Q4 in 14-day mortality and 28-day mortality (log-rank, P = 0.002).
Improvement in prediction performance for all-cause mortality after addition of SHR
Our analysis demonstrated that incorporating SHR significantly enhanced the predictive performance of established severity scores for mortality outcomes (Table 6). Prior to PSM, the addition of SHR led to statistically significant improvements in all mortality timepoints (in-hospital (Fig. 6), 28-day (Supplementary Materials Figure S5), 90-day (Supplementary Materials Figure S6), and 365-day (Supplementary Materials Figure S7) when combined with OASIS, SAPSII, and SOFA scores (all P < 0.01). The most notable improvements were observed for in-hospital mortality prediction, with AUC increases from 0.708 to 0.742 for OASIS (+ 0.034), 0.760 to 0.788 for SAPSII (+ 0.028), and 0.793 to 0.817 for SOFA (+ 0.024).
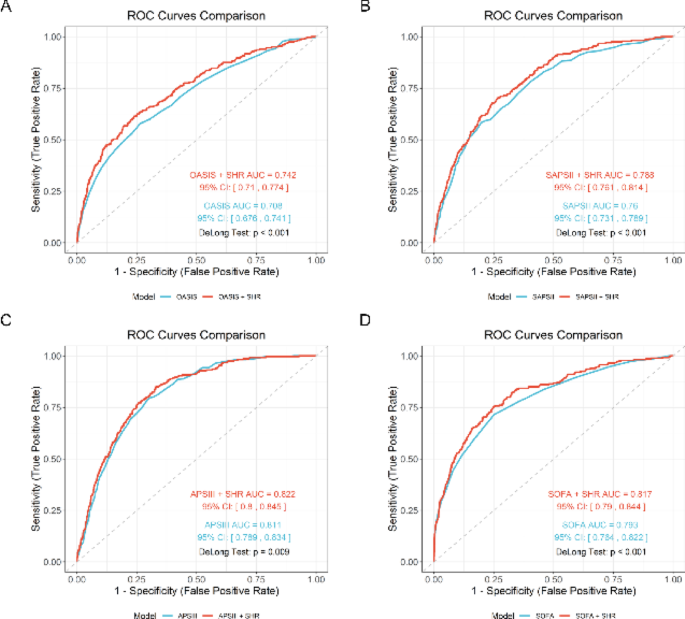
ROC analysis for in-hospital mortality prediction before PSM. Receiver operating characteristic curves demonstrating incremental predictive value of adding SHR to conventional severity scores including OASIS (A), SAPSII (B), APSIII (C), SOFA (D) for in-hospital mortality, with significant AUC improvements. OASIS, Oxford Acute Severity of Illness Score; SAPSII, Simplified Acute Physiology Score II; APSIII, Acute Physiology Score III; SOFA, Sequential Organ Failure Assessment
Following PSM, the incremental value of SHR remained statistically significant but was more modest in magnitude. Significant improvements persisted primarily for short-term mortality predictions: in-hospital (OASIS: +0.012, P = 0.009; SAPSII: +0.007, P = 0.039; SOFA: +0.010, P = 0.002) (Supplementary Materials Figure S8) and 28-day mortality (OASIS: +0.014, P = 0.023; SAPSII: +0.011, P = 0.040; SOFA: +0.013, P = 0.006) (Supplementary Materials Figure S9). The SOFA score maintained the most consistent improvement across all timepoints even after PSM (365-day mortality: +0.009, P = 0.012). But, incorporating SHR did not enhance the predictive performance of OASIS and SAPSII for 90-day mortality prediction (Supplementary Materials Figure S10) and 365-day (Supplementary Materials Figure S11) mortality prediction. Notably, the addition of SHR to APSIII showed limited incremental value regardless of PSM status, with only borderline significant improvement for in-hospital mortality before matching (AUC: 0.811 to 0.822, P = 0.009) and no significant improvement after matching (P = 0.126). These results suggest that SHR provides complementary prognostic information that enhances conventional severity scores, particularly for short-term mortality prediction. The persistent improvement after rigorous PSM adjustment indicates that SHR captures unique pathophysiological aspects not fully accounted for by existing scoring systems.