The overall distribution of HPV infection among 3580 male patients
This study investigated the distribution patterns of 27 HPV genotypes in 3,580 male patients from the plateau region of Southwest China between 2014 and 2024. The patients’ages ranged from 10 to 85 years, with a mean age of 33.50 ± 12.45 years. Among them, 7.21% (258/3,580) were from the urology department, while 92.79% (3,322/3,580) were from the dermato-venereology department. The HPV infection rate was higher in patients from the dermato-venereology department (51.96%, 1,726/3,322) than in those from the urology department (28.68%, 74/258) (Table 1). The clinical diagnoses included asymptomatic (17.57%), rash (6.76%), warts (40.42%), neoplasm (3.83%), urinary inflammation (5.42%), and other diagnoses (26.01%). Compared with HPV-negative individuals, HPV-positive patients had a higher proportion of neoplasms and warts but a lower proportion of rash, urinary inflammation, asymptomatic, and other diagnoses. Moreover, HPV-positive patients were more frequently observed in the younger (< 20 years) and older (50–59 years and ≥ 60 years) age groups (Table 1). Furthermore, patients with co-infections were more commonly found in the younger (< 20 years) and older (≥ 60 years) age brackets compared with those with single infections (Table 1).
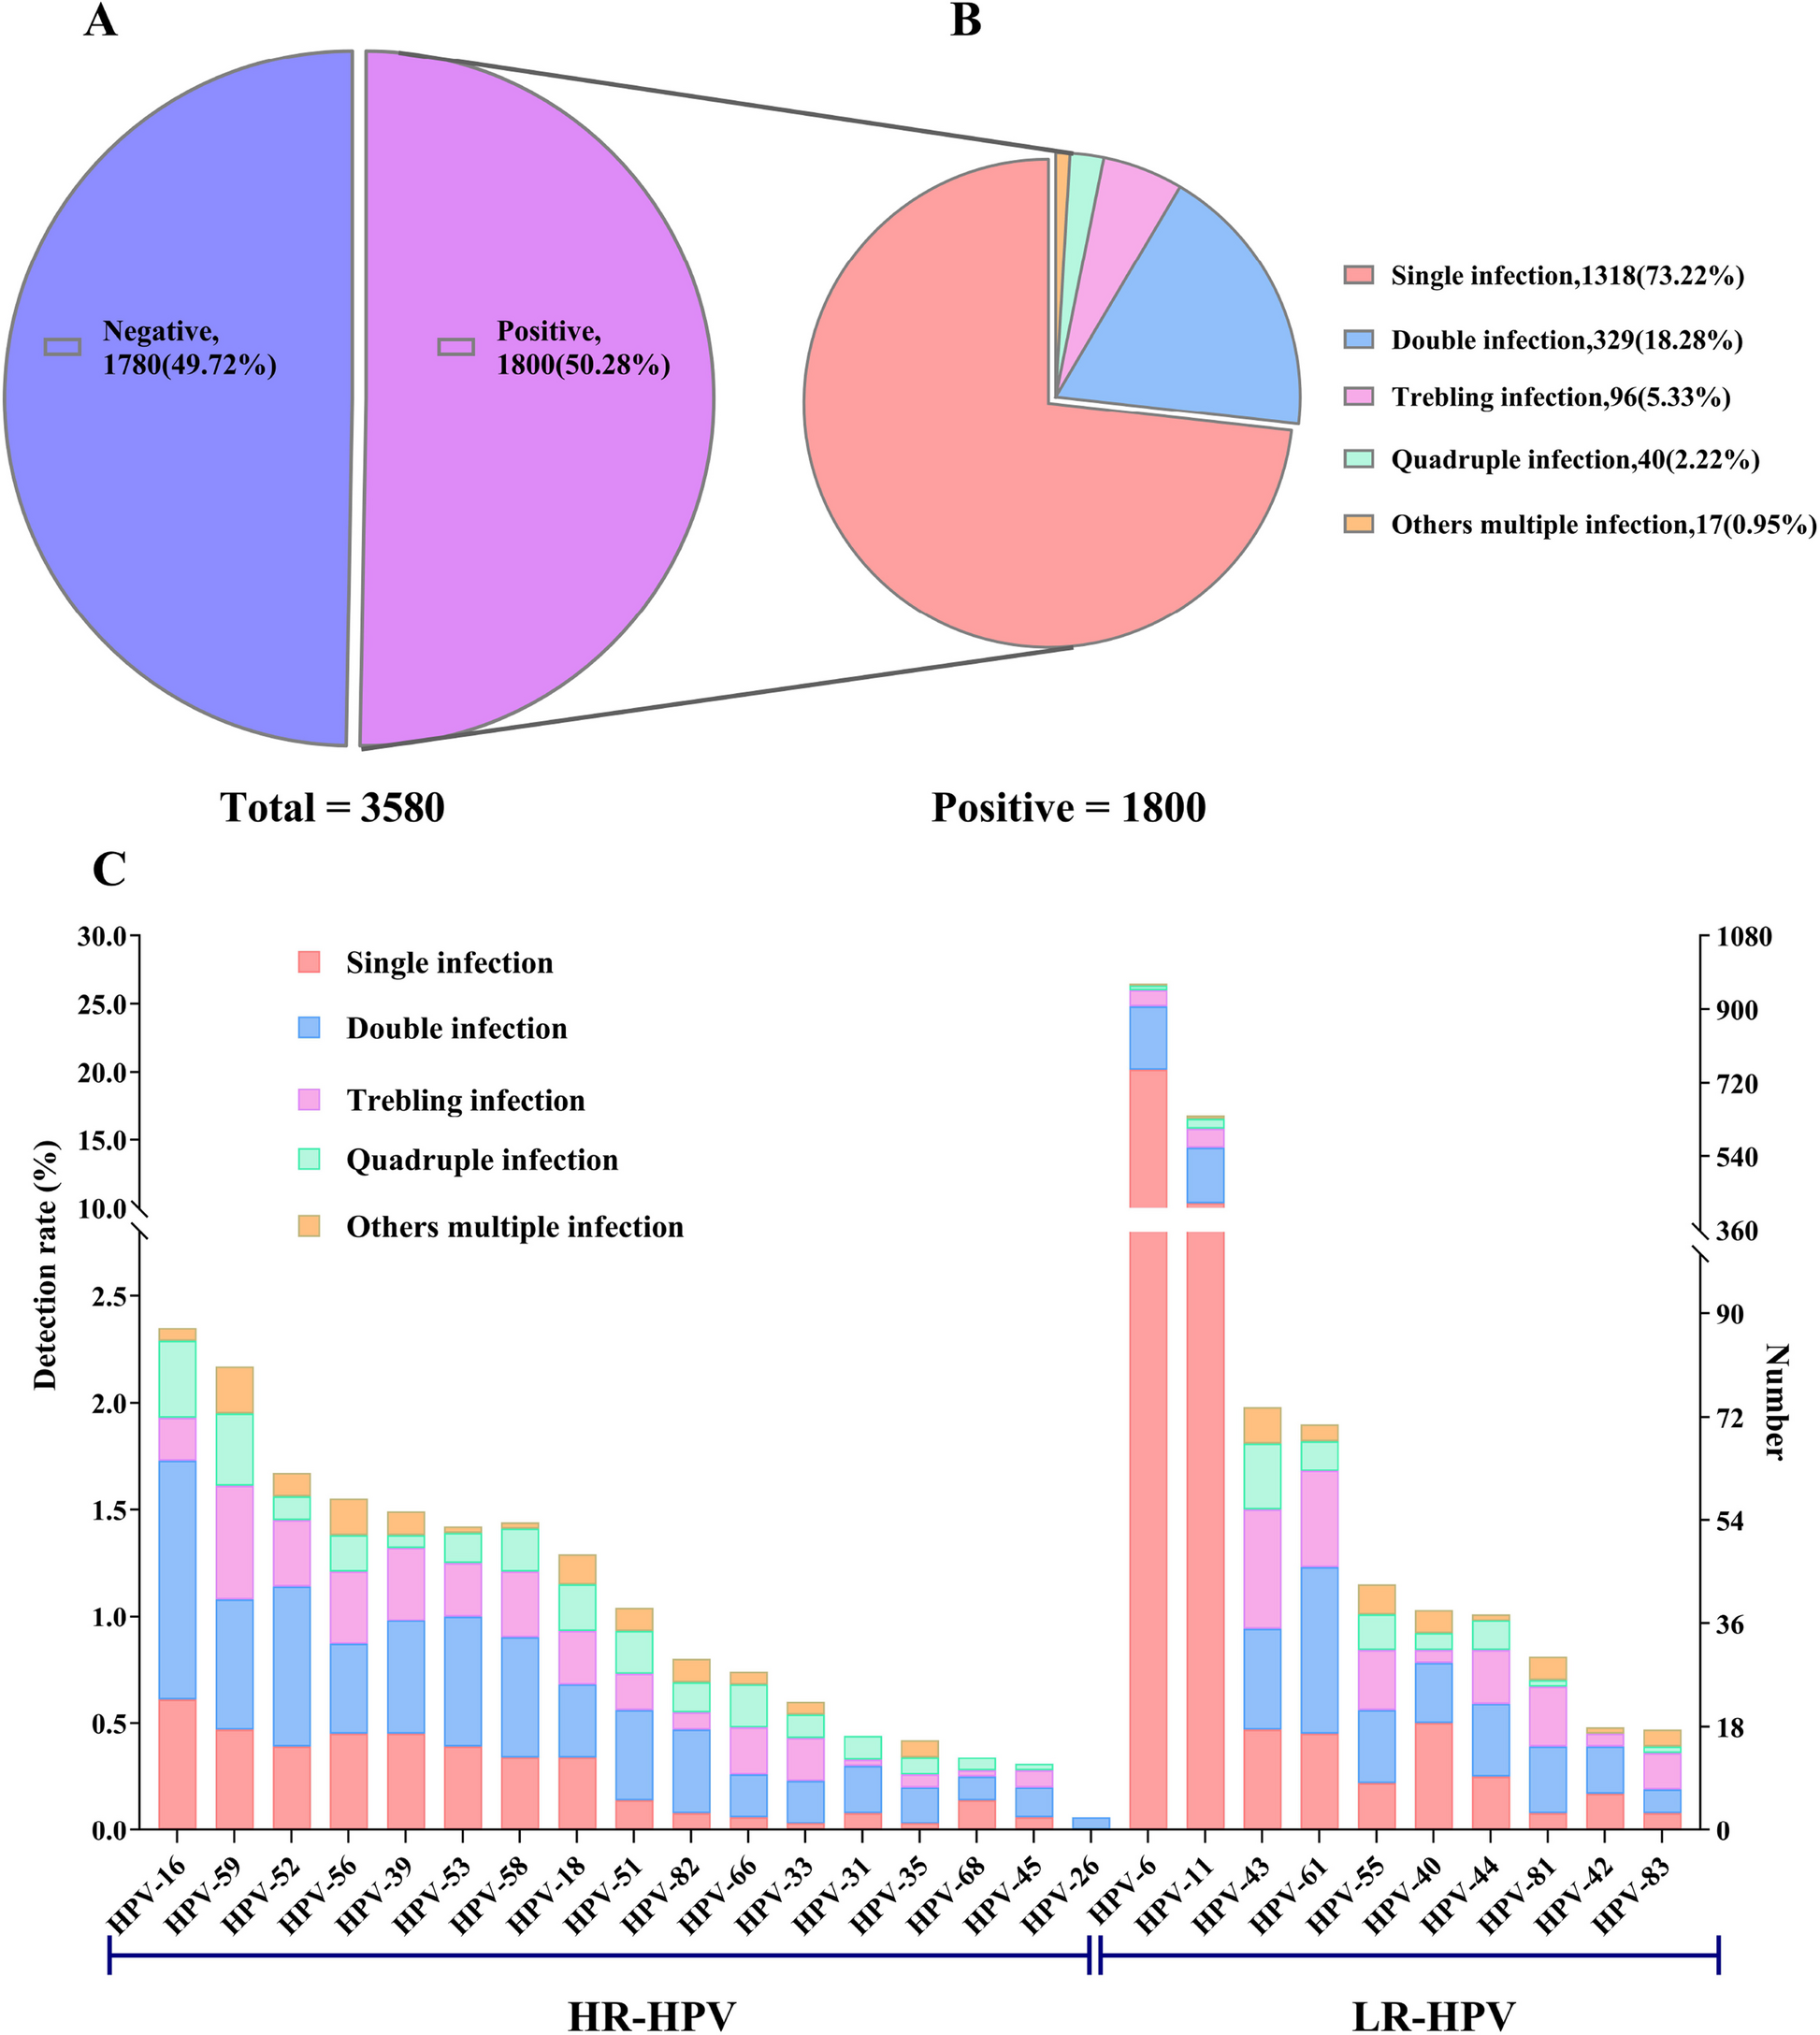
The overall HPV detection rate was 50.28% (1,800/3,580, 95% CI: 48.64% – 51.92%) (Fig. 1A). Among infected individuals, single, double, triple, quadruple, and other multiple infections accounted for 73.22% (1,318/1,800), 18.28% (329/1,800), 5.33% (96/1,800), 2.22% (40/1,800), and 0.95% (17/1,800), respectively (Fig. 1B). The most frequently detected HR-HPV genotypes were HPV16 (2.35%), HPV59 (2.18%), HPV52 (1.68%), HPV56 (1.54%), HPV39 (1.48%), HPV53 (1.42%), HPV58 (1.42%), HPV18 (1.28%), HPV51 (1.03%), and HPV82 (0.81%). The most prevalent LR-HPV genotypes were HPV6 (26.45%), HPV11 (16.82%), HPV43 (1.98%), HPV61 (1.90%), and HPV55 (1.15%) (Fig. 1C, Table 2).
The distribution of 27 HPV genotypes. A The number and detection rate of HPV infections among all patients. B The number and proportion of single and co-infections among all positive cases. C The number and detection rate of single and co-infections for each HPV subtype
The age specificity of HPV infections
Among all patients, the highest proportion of patients was in the 20–29 years (37.91%, 1,357/3,580) and 30–39 years (28.77%, 1,030/3,580) age groups, followed by the 40–49 years group (15.22%, 545/3,580). On the other hand, the proportions in the < 20 years, 50–59 years, and ≥ 60 years groups were lower, at 7.18% (257/3,580), 6.56% (235/3,580), and 4.36% (156/3,580), respectively (Table 1). The age-specific HPV infection rates exhibited a”U-shaped”bimodal pattern. The infection rate decreased from a peak of 64.98% (167/257) in the < 20 years group to 49.01% (665/1,357) in the 20–29 years group and further declined to 46.02% (474/1,030) in the 30–39 years group and 46.61% (254/545) in the 40–49 years group, forming a trough. The rate then increased to 55.32% (130/235) in the 50–59 years group, reaching a second peak of 70.51% (110/156) in the ≥ 60 years group (Table 1).
Prevalence of single and multiple HPV infections
Among all patients, the infection rates for single, double, triple, quadruple, and other multiple infections were 36.82% (1,318/3,580), 9.19% (329/3,580), 2.68% (96/3,580), 1.12% (40/3,580), and 0.47% (17/3,580), respectively. Among the 27 HPV genotypes tested, all except HPV6 and HPV11 were more commonly detected in co-infections (Fig. 1C, Fig. 3B). The prevalence of multiple infections varied significantly across age groups: 27.34% (70/257) in the < 20 years group, 13.55% (184/1,357) in the 20–29 years group, 11.36% (117/1,030) in the 30–39 years group, 8.99% (49/545) in the 40–49 years group, 6.81% (16/235) in the 50–59 years group, and 29.49% (46/156) in the ≥ 60 years group (Table 1). Among different clinical diagnoses, the rates of multiple infections were highest in patients with warts (20.59%, 298/1,447) and neoplasms (20.44%, 28/137), followed by those with other diagnoses (10.31%, 96/931), rash (9.09%, 22/242), and urinary inflammation (7.22%, 14/194). These rates were 5.39, 5.35, 2.70, 2.38, and 1.89 times higher than that observed in asymptomatic individuals (3.82%, 24/629) (Table 1,). A chord diagram depicting pairwise combinations of HPV types in co-infections identified the five most frequent pairs: HPV6 & HPV11, HPV11 & HPV16, HPV11 & HPV59, HPV6 & HPV43, and HPV11 & HPV43 (Fig. 2D).
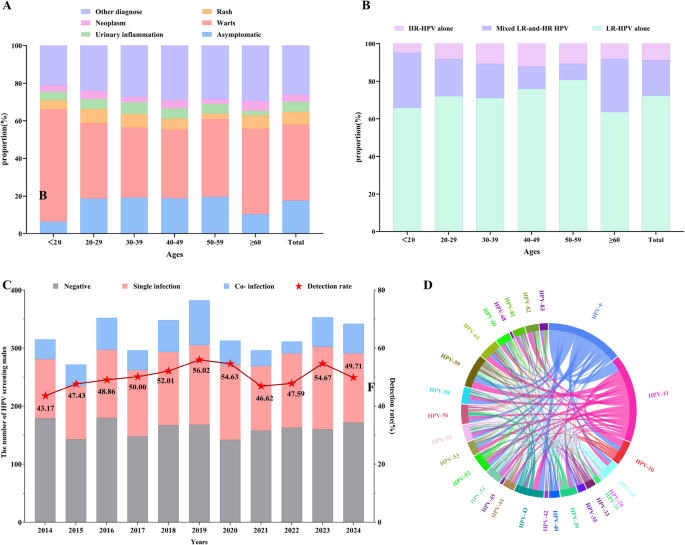
A The proportion of each diagnosis within different age groups. B The proportion of low-risk (LR) and high-risk (HR) HPV in different age groups. C The number and detection rate of HPV infections across different years. D Chord diagram illustrating co-infections between any two of the 27 HPV genotypes
The distribution of HR-HPV and LR-HPV infections among 1800 positive individuals
Among 1800 HPV-positive individuals, the proportions of LR-HPV alone, HR-HPV alone, and mixed LR- and HR-HPV infections were 71.00% (1,278/1,800), 9.83% (177/1,800), and 19.17% (345/1,800), respectively (Fig. 2B). Further analysis revealed that in individuals under 60 years old, the proportion of HR-HPV(including both HR-HPV alone and mixed LR- and HR-HPV) exhibited a progressive decline with increasing age: 34.13% (57/167) in the < 20 years group, 27.97% (186/665) in the 20–29 years group, 28.90% (137/474) in the 30–39 years group, 24.02% (61/254) in the 40–49 years group, and 19.23% (25/130) in the 50–59 years group. However, a marked increase to 36.36% (40/110) was observed in the ≥ 60 years group. These findings demonstrate that individuals in both the youngest (< 20 years) and oldest (≥ 60 years) age groups exhibit the highest rate of HR-HPV infection (Fig. 2B). The frequency of LR-HPV infections accounted for 74.16% (1,865/2,512), whereas that of HR-HPV infections constituted 25.84% (647/2,512) (Table 2).
The trend of HPV infection in males from 2014 to 2024
Between 2014 and 2024, the overall HPV infection rate remained relatively high. From 2014 to 2019, the prevalence showed a steady upward trend, increasing from 43.17% (136/315) in 2014 to 47.43% (129/272) in 2015, 48.86% (172/352) in 2016, 50.00% (148/296) in 2017, and 52.01% (181/348) in 2018. The highest infection rate was observed in 2019, reaching 56.02% (214/382), after which it fluctuated between 46.62% and 54.67% (Fig. 2C).
Over the past 11 years, HPV6 remained the most common genotype, with prevalence fluctuating between 23.65% and 31.25%. The prevalence of HPV11 initially increased before declining. It increased from 3.49% (11/315) in 2014 to 6.99% (19/272) in 2015, then rapidly increased to 15.63% (55/352) in 2016, 20.95% (62/296) in 2017, and 20.69% (72/348) in 2018. The highest prevalence was recorded in 2019 at 26.96% (103/382), which was 7.72 times higher than in 2014. From 2020 to 2024, the prevalence of HPV11 gradually declined to 14.62%, maintaining its position as the second most common genotype (Fig. 3E). Among all patients, the infection rate of HPV6 and/or HPV11 accounted for 41.98% (1,503/3,580). Among individuals with warts, the infection rate of HPV6 and/or HPV11 was 71.32% (1,032/1,447) (Table 2).
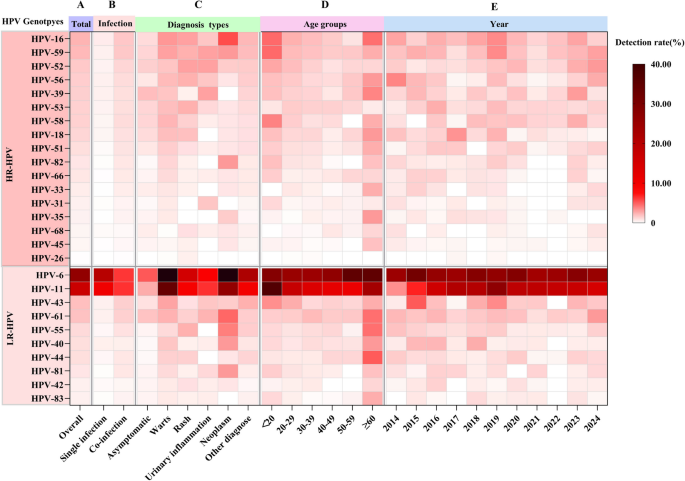
Heatmap of the detection rate of 27 HPV genotypes in males across different grouping modes. A Overall distribution. B Distribution of single and co-infections. C Distribution across different clinical manifestations and diagnostic groups. D Distribution across various age groups. E Distribution trend from 2014 to 2024
The prevalence of HPV in different clinical manifestations and diagnoses groups
The HPV detection rates varied by clinical diagnosis, ranked from highest to lowest as follows: warts (76.99%, 1,114/1,447), neoplasms (67.15%, 92/137), other diagnoses (39.10%, 364/931), rash (30.17%, 73/242), urinary inflammation (24.23%, 47/194), and asymptomatic individuals (17.49%, 110/629) (Table 2).
The prevalence of specific HPV genotypes differed across diagnostic groups. The five most common genotypes among different groups were: (1) Asymptomatic: HPV6 (4.45%), HPV11 (2.23%), HPV39 (1.75%), HPV61 (1.59%), HPV52 (1.27%); (2) Warts: HPV6 (43.19%), HPV11 (30.13%), HPV16 (2.90%), HPV59 (2.63%), HPV43 (2.56%); (3) Rash: HPV6 (13.22%), HPV11 (7.85%), HPV16 (2.48%), HPV52 (2.48%), HPV53, HPV55, HPV56, HPV59 (2.07%); (4) Urinary inflammation: HPV6 (7.37%), HPV11 (5.67%), HPV39 (2.58%), HPV52 (2.58%), HPV59 (2.58%); (5) Neoplasms: HPV6 (38.69%), HPV11 (24.09%), HPV16 (5.11%), HPV61 (4.38%), HPV55 (3.65%); and (6) Other diagnoses: HPV6 (20.84%), HPV11 (9.56%), HPV43 (2.36%), HPV16 (2.15%), HPV59 (2.04%) (Table 2). HPV6 and HPV11 were the most commonly detected genotypes across all diagnostic categories. However, the detection rates of the same genotype varied significantly between diagnostic groups. For example, the detection rates of HPV6, HPV11, and HPV16 in individuals with warts, neoplasms, rashes, urinary inflammation, and other conditions were several to more than ten times higher than the asymptomatic individuals (Table 2, Fig. 3C).
Evaluation of the effectiveness of three human papillomavirus vaccines
In China, three HPV vaccines are currently available: the bivalent vaccine (targeting HPV16 and HPV18), the quadrivalent vaccine (targeting HPV6, HPV11, HPV16, and HPV18), and the nonavalent vaccine (targeting HPV6, HPV11, HPV16, HPV18, HPV31, HPV33, HPV45, HPV52, and HPV58). Their respective coverage rates were 5.18%, 66.84%, and 73.17%, with a statistically significant difference (P < 0.05; Fig. 4).
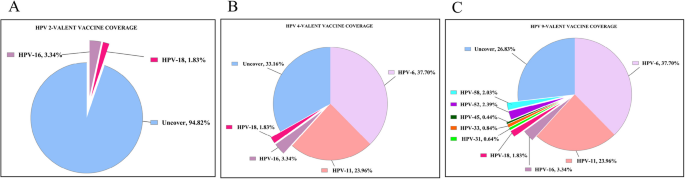
The coverage rate of HPV genotypes by the bivalent, quadrivalent, and nine-valent HPV vaccines currently used in China