Heart rate variability across sensory conditions
HR
A one-way repeated-measures ANOVA revealed a significant main effect of condition on HR, F(4, 156) = 22.74, p < 0.001, partial η² = 0.487. The control condition had the highest mean HR (83.12 ± 6.53 bpm), followed by the tactile condition (77.16 ± 5.28 bpm) and visual condition (74.52 ± 5.76 bpm). The olfactory condition (71.32 ± 4.19 bpm) and tactile-olfactory condition (69.88 ± 4.97 bpm) showed the lowest HR values (Fig. 3), demonstrating the effectiveness of multisensory engagement in reducing physiological stress.
HR under five sensory stimulation conditions (bpm, beats per minute). Asterisks indicate significant differences based on Bonferroni-adjusted pairwise comparisons: p < 0.05 (*), p < 0.01 (**)
Post hoc pairwise comparisons with Bonferroni correction revealed several significant differences in HR across sensory conditions. HR in the control condition was significantly higher than in the visual (ΔM = 8.60, p < 0.001), tactile (ΔM = 5.96, p = 0.037), olfactory (ΔM = 11.80, p < 0.001), and tactile-olfactory conditions (ΔM = 13.24, p < 0.001). The tactile-olfactory condition showed significantly lower HR compared to control (ΔM = − 13.24, p < 0.001), tactile (ΔM = − 7.28, p < 0.001), and marginally lower HR than the visual condition (ΔM = − 4.64, p = 0.060), though this last difference did not reach statistical significance. No significant difference was found between the tactile-olfactory and olfactory conditions (ΔM = − 1.44, p = 1.000). HR in the olfactory condition was significantly lower than in control (ΔM = − 11.80, p < 0.001) and tactile (ΔM = − 5.84, p = 0.002), but not significantly different from the visual condition (ΔM = − 3.20, p = 0.385). Additionally, no significant difference was observed between the visual and tactile conditions (ΔM = − 2.64, p = 0.869). Among all conditions, the tactile-olfactory stimulus elicited the lowest HR, followed by olfactory and visual stimuli, while the control condition consistently produced the highest HR values. These findings highlight the superior physiological calming effects of combined tactile and olfactory stimulation relative to single-sensory or no-stimulus conditions.
LF/HF
Statistical analysis revealed significant differences in the LF/HF ratio across the five sensory conditions F(4, 156) = 55.09, p < 0.001, partial η² = 0.697. The descriptive statistics showed that the control condition had the highest mean LF/HF ratio (2.62 ± 0.59), while the tactile-olfactory stimuli exhibited the lowest ratio (0.89 ± 0.45) (see Fig. 4), suggesting heightened vagal activity and greater relaxation in the latter condition.
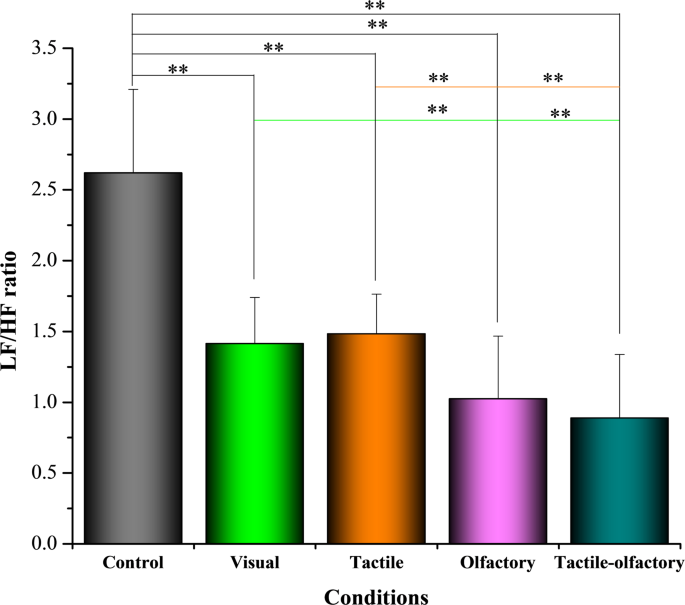
Mean LF/HF ratio under five sensory stimulation conditions. Asterisks indicate statistically significant differences based on Bonferroni-adjusted pairwise comparisons: p < 0.01 (**)
Further analysis identified significant pairwise differences. The control condition showed significantly elevated LF/HF ratios compared to all other conditions (p < 0.001), including visual (ΔM = 1.205), tactile (ΔM = 1.138), olfactory (ΔM = 1.595), and tactile-olfactory (ΔM = 1.731). The tactile-olfactory condition demonstrated significantly lower LF/HF ratios compared to the visual (ΔM = − 0.526, p = 0.001), tactile (ΔM = − 0.593, p < 0.001), and olfactory conditions (ΔM = − 0.136, p = 1.000); however, the difference with olfactory was not statistically significant. Additionally, tactile stimulation yielded significantly higher LF/HF values than olfactory (ΔM = 0.457, p = 0.005). These results underscore the superior effectiveness of tactile-olfactory stimuli in promoting autonomic balance through enhanced parasympathetic activation and reduced sympathetic dominance.
SDNN
Figure 5 illustrates the distribution of SDNN values for each condition. A one-way ANOVA revealed significant differences in SDNN values across the five sensory conditions F(4, 156) = 20.12, p < 0.001, partial η² = 0.456. The descriptive statistics indicated that the control condition yielded the lowest average SDNN (41.99 ± 6.06), while the tactile-olfactory stimuli demonstrated the highest average SDNN (64.96 ± 10.17). This result suggests that the combination of tactile-olfactory stimuli is most effective in promoting physiological relaxation, as reflected by increased SDNN values.
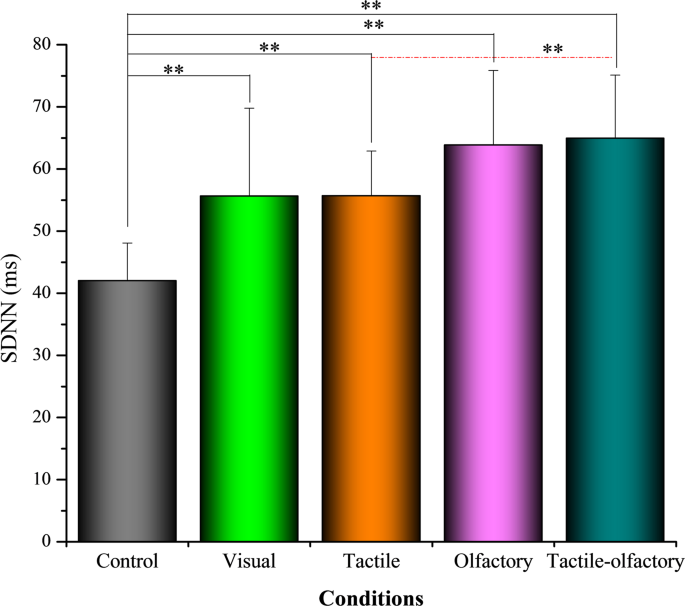
Mean SDNN (ms) under five sensory stimulation conditions. Asterisks indicate statistically significant differences based on Bonferroni-adjusted pairwise comparisons: p < 0.01 (**)
Bonferroni-adjusted comparisons revealed that the control condition had significantly lower SDNN values than all other conditions: visual (ΔM = − 13.65, p = 0.002), tactile (ΔM = − 13.66, p < 0.001), olfactory (ΔM = − 21.83, p < 0.001), and tactile-olfactory (ΔM = − 22.96, p < 0.001). Tactile-olfactory stimuli showed significantly higher SDNN values than tactile (ΔM = 9.30, p = 0.012), but did not significantly differ from visual (ΔM = 9.31, p = 0.121) or olfactory (ΔM = 1.13, p = 1.000). The olfactory condition demonstrated significantly higher SDNN than control (ΔM = 21.83, p < 0.001), but did not significantly differ from visual (ΔM = 8.18, p = 0.372) or tactile (ΔM = 8.16, p = 0.118). These findings highlight the potential of multisensory stimulation, particularly tactile-olfactory engagement, in enhancing physiological relaxation as reflected by elevated SDNN.
RMSSD
ANOVA results showed significant variation in RMSSD values across the five sensory conditions F (4, 156) = 59.58, p < 0.001, partial η² = 0.713, indicating that different stimuli conditions influenced participants’ parasympathetic activity as measured by RMSSD. The descriptive analysis shows that the Control condition resulted in the lowest RMSSD values (31.05 ± 4.53), while the olfactory condition had the highest mean value (56.39 ± 9.54) (see Fig. 6). This highlights the significant restorative effect of the olfactory condition on physiological relaxation compared to the other conditions.
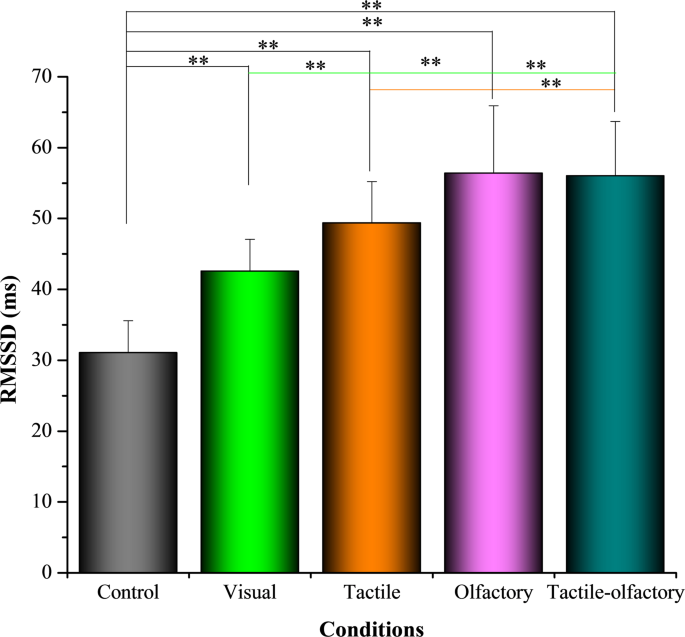
Mean RMSSD (ms) under five sensory stimulation conditions. Asterisks indicate statistically significant differences based on Bonferroni-adjusted pairwise comparisons: p < 0.01 (**)
Bonferroni-adjusted post hoc tests indicated significant differences between the control condition and all other sensory conditions, confirming its significantly lower RMSSD values. Specifically, RMSSD in the control condition was significantly lower than in the visual (ΔM = − 11.50, p < 0.001), tactile (ΔM = − 18.32, p < 0.001), olfactory (ΔM = − 25.34, p < 0.001), and tactile-olfactory conditions (ΔM = − 24.97, p < 0.001). The olfactory condition also showed significantly higher RMSSD values than the visual condition (ΔM = 13.84, p < 0.001). However, no statistically significant differences were observed between the olfactory and tactile conditions (ΔM = 7.03, p = 0.10). These results confirm that multisensory engagement, particularly the olfactory and tactile-olfactory conditions, significantly enhance autonomic flexibility and promote relaxation.
Skin conductance (SC)
Statistical analysis revealed significant differences in SC across the five sensory stimuli conditions F(4, 156) = 49.95, p < 0.001, partial η² = 0.675. Descriptive statistics indicated that the control condition had the highest average SC (3.67 ± 0.85), while the tactile-olfactory stimuli showed the lowest SC values (1.27 ± 0.40) (see Fig. 7), suggesting the greatest reduction in physiological arousal under multisensory stimulation. Pairwise comparisons showed that the control condition significantly differed from all other conditions: visual (ΔM = 1.18, p < 0.001), tactile (ΔM = 1.42, p < 0.001), olfactory (ΔM = 2.06, p < 0.001), and tactile-olfactory (ΔM = 2.40, p < 0.001). Among the experimental conditions, the tactile-olfactory condition demonstrated significantly lower SC compared to visual (ΔM = − 1.22, p < 0.001), tactile (ΔM = − 0.98, p < 0.001), and olfactory (ΔM = − 0.34, p = 0.017). These findings underscore that the tactile-olfactory condition was the most effective in reducing sympathetic arousal, as reflected by significantly lower SC values.
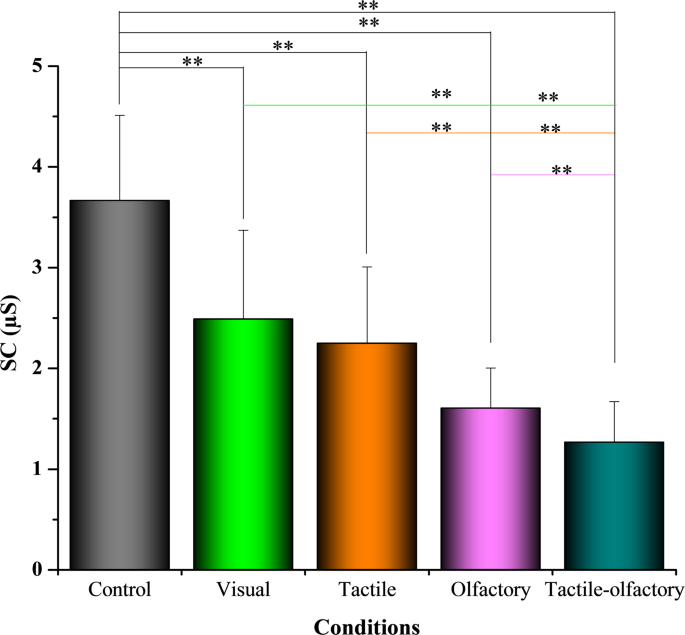
Mean skin conductance under five sensory stimulation conditions. Asterisks indicate statistically significant differences based on Bonferroni-adjusted pairwise comparisons: p < 0.01 (**)
Anxiety reduction measured by STAI–S scores
Baseline state anxiety levels (STAI-S), assessed prior to any exposure, showed no significant differences across participants assigned to sensory conditions. Notably, anxiety levels significantly increased from baseline to the control condition (36.84 ± 2.54) to the control condition (47.52 ± 6.49), p < 0.001, confirming the stress-inducing nature of the control setting. A repeated-measures ANOVA revealed a significant effect of sensory condition on post-exposure anxiety levels, F(4, 156) = 25.32, p < 0.001, partial η² = 0.513. Descriptive statistics indicated that the control condition elicited the highest anxiety, significantly exceeding all other conditions. In contrast, the tactile-olfactory condition yielded the lowest anxiety (27.40 ± 6.16), suggesting multisensory integration substantially reduced state anxiety (Fig. 8).
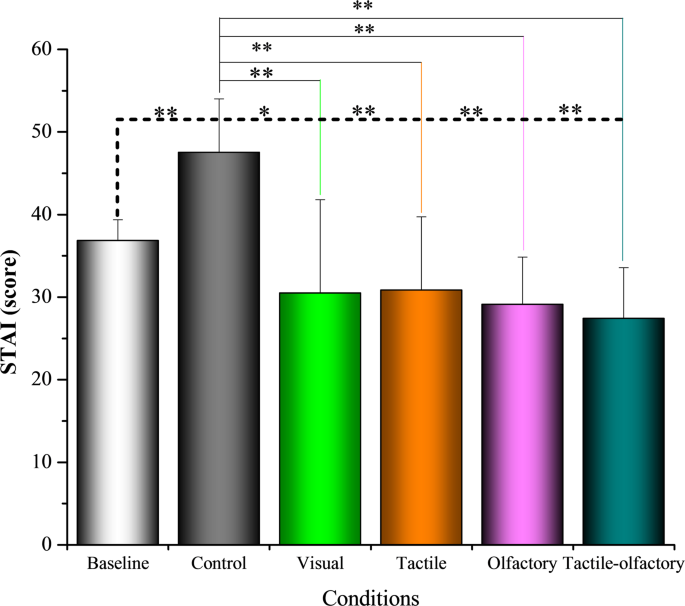
Mean STAI–S scores under five sensory stimulation conditions. Asterisks indicate statistically significant differences based on Bonferroni-adjusted pairwise comparisons: p < 0.05 (*), p < 0.01 (**)
Bonferroni-adjusted post hoc comparisons confirmed that the control condition differed significantly from all other experimental conditions, showing higher anxiety scores than the visual (ΔM = 17.04, p < 0.001), tactile (ΔM = 16.68, p < 0.001), olfactory (ΔM = 18.40, p < 0.001), and tactile-olfactory conditions (ΔM = 20.12, p < 0.001). However, no statistically significant differences were found among the experimental conditions themselves. For example, although tactile-olfactory elicited lower anxiety scores than visual (ΔM = 3.08), this difference was not statistically significant (p = 1.000). Likewise, comparisons between olfactory and tactile conditions yielded non-significant results. These results indicate that each sensory condition significantly reduced anxiety relative to Control. The tactile–olfactory condition produced the largest mean decrease, although differences among experimental conditions were not statistically significant.
Correlations between physiological and psychological measures
The correlation analysis revealed significant relationships between physiological and psychological measures, offering insights into the interplay between autonomic nervous system activity, anxiety, and physiological arousal (Table 2). HR showed a strong positive correlation with the LF/HF ratio (r = 0.532, p < 0.001), suggesting that increased heart rate is associated with heightened sympathetic dominance. In contrast, Mean HR exhibited negative correlations with both SDNN (r = -0.505, p < 0.001) and RMSSD (r = -0.532, p < 0.001), indicating reduced heart rate variability (HRV) with elevated heart rates, reflecting decreased parasympathetic activity and greater stress.
The LF/HF ratio correlated positively with SC (r = 0.668, p < 0.001) and STAI–S (r = 0.549, p < 0.001), suggesting that sympathetic dominance is aligned with increased physiological arousal and higher subjective anxiety. Conversely, LF/HF was negatively associated with SDNN (r = -0.464, p < 0.001) and RMSSD (r = -0.671, p < 0.001), further supporting the role of reduced HRV in stress responses.
HRV parameters, SDNN and RMSSD, displayed strong positive intercorrelations (r = 0.527, p < 0.001), with both negatively correlating with SC (SDNN: r = -0.426, p < 0.001; RMSSD: r = -0.615, p < 0.001) and STAI–S (SDNN: r = -0.465, p < 0.001; RMSSD: r = -0.483, p < 0.001). These findings highlight the link between increased HRV and reduced anxiety or physiological arousal. SC positively correlated with STAI–S (r = 0.525, p < 0.001), further indicating the association between heightened physiological arousal and anxiety. These results indicate that under the tactile-olfactory stimuli, physiological and psychological states are closely interconnected.