This study used a cross-sectional design analyzing real word electronic health record data. The study leverages data from the TriNetX Research Network, encompassing electronic medical records from approximately 115 million patients across 83 de-identified healthcare organizations [17]. The data used in this study was collected on November 29th, 2023. The study design is a cross-sectional analysis focusing on patients aged 45 and above who had healthcare visits between January 1, 2017, and December 31, 2018. This timeframe was chosen to avoid the confounding impact of the COVID-19 pandemic.
Ethical considerations
This TriNetX study is exempt from requiring informed consent because it is a retrospective study that involves secondary analysis of existing, de-identified data viewed only in the aggregate. This analysis does not involve direct intervention or interaction with human subjects. The de-identification of the data adheres to the standards defined in Section § 164.514(a) of the HIPAA Privacy Rule.
Terms used in this manuscript
We use person-first language throughout this manuscript, including people with diabetes and people with visual impairment.
Classification of visual impairment
In the absence of either objective visual assessment data or self-reported visual disability status (neither of which is available in Trinetx), we used the presence of visual disability-related ICD-10 codes (here termed VDRC) to define four different categories of visual impairment: None, Unqualified, Low Vision, and Blindness. We identify people with visual impairment if they have a diagnosis code in the latter three categories. Supplemental Table 1 identifies the ICD-10 codes associated with each.
Inclusion criteria
To compare rates of diabetes across race and visual disability status, we developed a cohort of participants aged 45 or older who had a healthcare visit between January 1, 2017, and December 31, 2018. The cohort was limited to those with a recorded race value in the categories of White, African American, or Asian, as these were the only groups with a sufficiently large sample of patients with a visual disability to allow for race-stratified analysis.
For our analysis of people with diabetes, we included those aged 45 or older with a diabetes-related healthcare visit in the same period (January 1, 2017 to December 31, 2018). They must have had at least one visit post-2019, ensuring they were present throughout all of 2019 and, therefore, able to have at least three ambulatory visits. This question is examined across two cohorts: Cohort 1, which includes individuals without a VDRC and with diabetes (excluding those with ophthalmic complications in the baseline period); and Cohort 2, comprising those without a VDRC (excluding those with diabetes-related ophthalmology complications).
Outcome variables
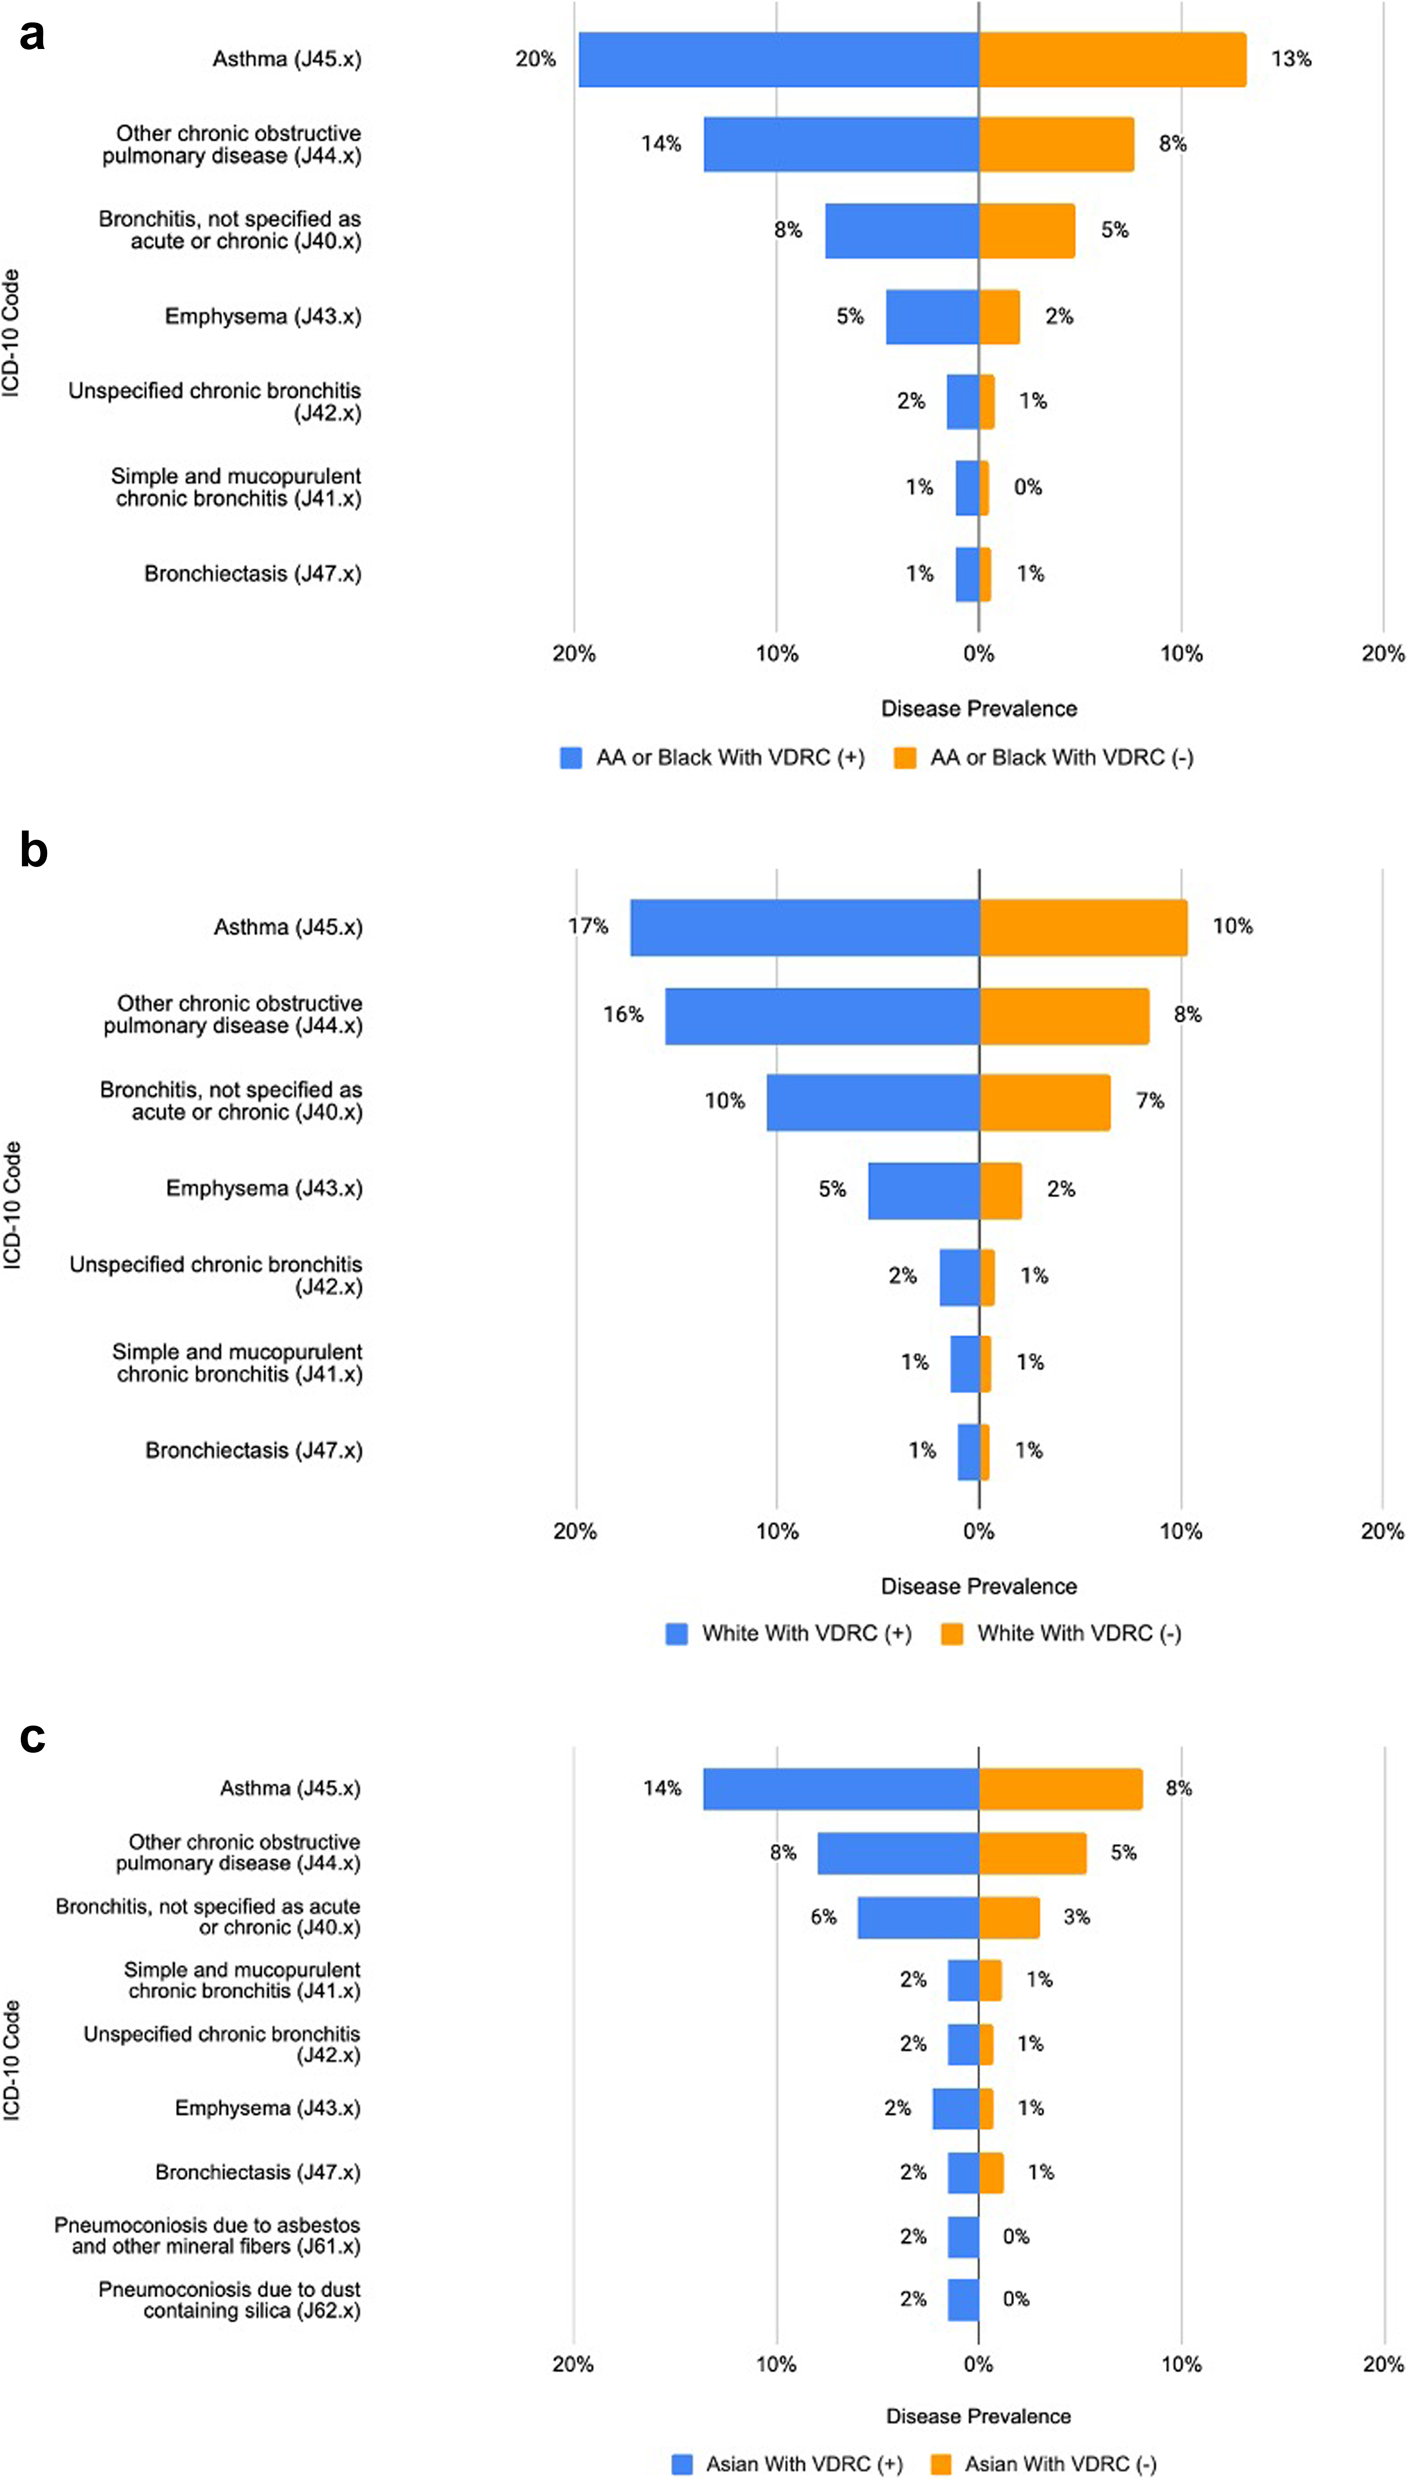
To explore disparities in disease burden, examine a selected set of comorbidities related to chronic pulmonary conditions identified by the Charlson Comorbidity Index (CCI) [18]. We focused on this set of conditions as people with disability have an increased risk of these diseases as well as an increased risk of mortality for asthma-associated hospitalization [19]. Furthermore, to determine if racial minorities experience poorer diabetes outcomes, we identify the prevalence of chronic kidney disease and the rate of uncontrolled diabetes (A1C > 9.0%) in the follow-up year. These outcome variables are crucial in understanding and addressing healthcare disparities among different racial groups.
Healthcare access patterns
We examined several key aspects of healthcare utilization. For each of these outcomes, we identified the difference in proportion between people with visual impairment and those without. First, we identified differences in the frequency of healthcare visits between people with visual impairment and those without by identifying whether patients had at least three ambulatory visits in the follow-up year. Next, we assessed the frequency of diabetes monitoring. This part of the study specifically looked at whether patients had two A1c lab tests in the follow-up year. Finally, we analyzed kidney disease monitoring, an important aspect of diabetes management [20] by determining whether medical providers had recorded at least one glomerular filtration rate (GFR) measurement.
We assessed uncontrolled diabetes and chronic kidney disease outcomes within each healthcare utilization cohort: those with 3 + visits, those with 1 + A1C visits, and those with 1 + GFR. Additionally, we assessed comorbidities among all patients with a diabetic-related visit in the baseline period and one post-2019 visit to align the cohort with our outcomes analysis.
Statistical analysis
Differences in diabetes management between white and black people with visual impairment
We used the difference in proportion test to measure the difference in prevalence of having 3 + ambulatory visits, 1 + A1C value, and 1 + GFR value between people with visual impairment and those without. Not having at least 1 A1C measurement within a year is an indication of uncontrolled diabetes and, therefore, a good metric of diabetes management [21].
Differences in diabetes outcomes in the follow-up year
This study identified differences in the prevalence of uncontrolled diabetes between people with visual impairment and those without these conditions using risk ratios. Uncontrolled diabetes was defined by a Hemoglobin A1c level greater than 9.0% or a patient having no A1C measurement [21], in the follow-up year. This study used risk ratios to measure the strength of the association between chronic kidney disease (CKD) and visual impairment. CKD was identified by the presence of any ICD-10 code starting with N18 (chronic kidney disease) in the follow-up year.
To control for potential confounding factors for all statistical analyses, we employed propensity score matching. Controls were matched to cases at a 1:1 ratio, based on age, race, and sex. This matching process helps to ensure that the comparison between groups is as unbiased as possible by accounting for these key demographic variables.
Comparing co-morbidities related to chronic pulmonary disease
We used the difference in proportion test to measure differences in the prevalence of comorbidities between people with visual impairment and those without for each population.
Directed Acyclic Graph (DAG) inclusion
A key addition to our methods is the inclusion of a DAG to serve several purposes. The DAG expresses assumptions regarding the relationships between variables, identifying covariates and potential confounders and illustrating transitive relationships impacting diabetes care and outcomes in patients with visual disabilities. While DAGs do not empirically determine these relationships, they are a powerful tool for structuring analysis and ensuring that researchers’ assumptions are made explicit and logically consistent by confirming whether these assumed relationships are consistent with observed data.
By incorporating the perspectives of disabled researchers, including people with visual impairment, our DAG ensures that the study results’ interpretation comprehensively addresses the nuances of disability research within the context of EHR data.
DAGs also allow for the representation of missing variables, highlighting the ongoing challenge in the analysis of EHR data regarding the omission of data important to capturing disability. The DAG also allows researchers to visualize and identify collider variables and other sources of bias, creating a holistic picture that can yield insights into omissions and next steps for future research. The DAG in our study displays the pathways between having a visual impairment and being measured as having uncontrolled diabetes.