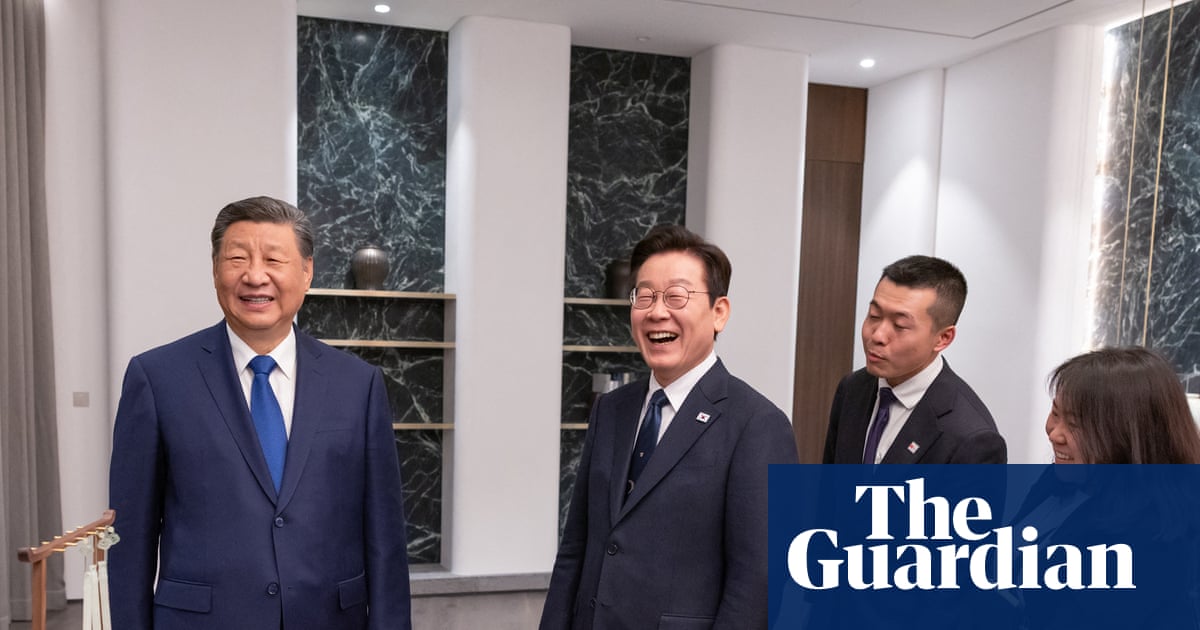
Temporal trends and demographic correlations in clinical isolation rates in a hospital setting
A total of 3,035 specimens were analyzed, yielding 1,875 isolates (61.7%) with notable variations across demographic factors and specimen types. The highest isolation rate was observed in the 51–73 years age group, where 68.1% of isolates were from inpatients (IPs) and 31.9% were from outpatients (Ops), demonstrating a strong age-related correlation (R2 = 0.99) (p < 0.05). Males exhibited a significantly higher OP isolation rate (42.8%) than females (11%), with a statistically significant sex difference (χ2 = 246.9, p < 0.05).
Over time, OP isolation rates decreased from 46.9% in 2015 to 29.0% in 2019, with a strong correlation between the year and isolation frequency (R2 = 0.97) (p < 0.05).
The seasonal analysis revealed that IPs had the highest isolation rates in autumn (74.7%) and winter (72.0%), whereas OPs had higher rates in spring (36.7%) and summer (35.4%), with a marked decrease in autumn (10.2%). This seasonal variation was strongly correlated with the isolation frequency (R2 = 0.95) (p < 0.05).
The specimen type significantly influenced the isolation rate. Blood samples (68.6%) were predominant across all specimen types (71.6% of IPs), followed by urine samples (21.3%), which showed a higher isolation rate among IPs (73.8%). The correlation between the specimen type and isolation frequency was highly significant (R2 = 0.99) (p < 0.05).
These findings revealed significant associations between isolation rates and key demographic variables, including age, sex, seasonality, and year of isolation, offering valuable epidemiological insights into AMR patterns (Table 1).
Prevalence and characterization of isolates in a hospital setting
To elucidate the spectrum of bacterial isolates responsible for infections in the study population, a comprehensive prevalence analysis was conducted. The most prevalent bacterial isolate among cardiac patients was Staphylococcus aureus (27.84%, n = 522), followed by Klebsiella pneumoniae (22.4%, n = 420), and Escherichia coli (20.5%, n = 386). Other significant isolates included Acinetobacter baumannii (15.6%, n = 294), Pseudomonas aeruginosa (7.25%, n = 136), and Enterococcus faecalis (6.2%, n = 117) (Fig. 2A). These findings underscore the clinical significance of S. aureus infections in this patient cohort.
Prevalence and distribution of bacterial isolates in a hospital setting.A Bar graph depicting the overall prevalence of bacterial isolates linked to healthcare-associated infections (HAIs) related to ESKAPE pathogens. B Box plot comparing the total number of bacterial isolates recovered from inpatients and outpatients, highlighting the variations between the patient groups. C Horizontal bar graph showing the relative prevalence of ESKAPE pathogens in inpatients and outpatients. This figure highlights the distribution and variability of major bacterial isolates across patient categories and hospital settings, emphasizing the significance of ESKAPE pathogens in the hospital studied. Key: % Prevalence = (number of isolates/total number of isolates) × 100
To further evaluate the burden of bacterial isolates in hospital settings, linear regression analysis (R2 = 0.0467, p = 0.0237) revealed a significantly higher isolation rate among IPs than that among OPs (Fig. 2B). The predominant isolates in the IPs group were S. aureus (83%, n = 433) and K. pneumoniae (80.2%, n = 337), whereas A. baumannii (35.7%, n = 105) and P. aeruginosa (33.8%, n = 46) were more prevalent in the OPs (t = 3.201, p < 0.05) (Fig. 2C). These results highlight the differential bacterial burden across hospital settings.
Seasonal and annual trends of bacterial isolates were assessed using ANOVA with Tukey’s Honestly Significant Difference (HSD) post-hoc test. Among the IPs, S. aureus showed significant seasonal variation, with higher isolation rates in autumn (F = 9.8, p < 0.05), summer (F = 21.08, p < 0.05), and winter (F = 28.63, p < 0.05), peaking in autumn of 2019. Similarly, K. pneumoniae exhibited significant variation across all seasons, peaking in winter 2019.
Among the OPs, A. baumannii did not show significant variation in winter (F = 2.06, p > 0.05) but reached its highest isolation rate in winter 2019. P. aeruginosa showed significant variation in autumn (F = 18.67, p < 0.05), with its peak occurring in the winter of 2019. These data suggest notable seasonal fluctuations in the bacterial prevalence across hospital settings (Fig. 3). The prevalence of bacterial isolates across different demographic variables is presented in Supplementary Table 2.

Seasonal and annual trends in bacterial isolate prevalence. This figure depicts seasonal and annual variations in the prevalence of bacterial isolates among inpatients and outpatients, highlighting their temporal dynamics and potential implications for patient care and infection management strategies. Key: % Prevalence = (Number of isolates/Total number of isolates) × 100, Inpatients (IPs), Outpatients (OPs)
Seasonal determinants and variation in antibiotic resistance patterns among predominant hospital isolates
Using the Cochran-Armitage trend test and a multivariate regression model, we evaluated seasonal determinants and annual resistance trends among the predominant hospital isolates. Our findings indicated significant seasonal associations, with IPs isolates displaying higher AMR rates (65.3%) than OPs isolates (29.2%) (p < 0.05), particularly during the winter season (aOR = 2.50, 95% CI: 1.20–4.98, p < 0.05), which accounted for 98% of the observed variance in AMR rates (R2 = 0.98).
S. aureus: In IPs isolates, resistance peaked during winter for most antibiotics (R2 = 0.91). Vancomycin (VA), tigecycline (TGC), and sulfamethoxazole/trimethoprim (SXT) exhibited the highest sensitivity (18.8%), whereas resistance rates were highest for amoxicillin/clavulanate (AMC) and ciprofloxacin (CIP) (97.5%). Among the OPs isolates, resistance displayed dual seasonal peaks in winter and summer, with consistent winter trends from 2012 to 2019 and increased summer resistance from 2017 to 2019 (Z = 2.56, p < 0.05) (R2 = 0.91), especially against ceftriaxone (CRO), gentamicin (GN), CIP, azithromycin (AZM), and AMC (100%). VA, SXT, TGC, and linezolid (LZD) retained sensitivity (100%) in OPs isolates, whereas AMC, AZM, and CIP showed the highest resistance rates (100%) (Fig. 4).

Antimicrobial resistance patterns among predominant isolates. This figure presents radar graphs depicting the antimicrobial resistance (AMR) percentages of the predominant bacterial isolates analyzed across seasonal and annual trends to assess temporal variations. Susceptibility testing was conducted following the Clinical and Laboratory Standards Institute (CLSI) guidelines using Oxoid discs (Basingstoke Hampshire, UK). The antibiotics tested are grouped as follows: beta-lactams, including amoxiclav (AMC, 40 µg), ceftriaxone (CRO, 30 µg), cefoxitin (FOX, 30 µg), oxacillin (OX, 30 µg), ceftazidime (CAZ, 30 µg), cefepime (FEP, 30 µg), ampicillin/sulbactam (SAM, 40 µg), piperacillin/tazobactam (TZP, 100 µg), cefotaxime (CTX, 30 µg), aztreonam (ATM, 30 µg), imipenem (IMP, 10 µg), doripenem (DOR, 10 µg), meropenem (MEM, 10 µg), and piperacillin (PRL, 30 µg); macrolides, including azithromycin (AZM, 30 µg) and erythromycin (ETM, 15 µg); quinolones, including ciprofloxacin (CIP, 5 µg) and levofloxacin (LEV, 5 µg); aminoglycosides, including gentamicin (CN, 10 µg), tobramycin (TOB, 10 µg), and amikacin (AK, 30 µg); glycopeptides, including vancomycin (VA, 30 µg) and teicoplanin (TGC, 30 µg); oxazolidinones, including linezolid (LZD, 30 µg); and others, including trimethoprim/sulfamethoxazole (SXT, 25 µg), polymyxin B (PB, 10 µg), and doxycycline (DOX, 30 µg). This comprehensive analysis provides insights into the seasonal and temporal dynamics of resistance patterns and offers valuable information for understanding the AMR trends. Key: Inpatients (IPs), outpatients (OPs), and AMR percentages were calculated as follows: (number of resistant isolates/total isolates) × 100
K. pneumoniae: Winter was associated with resistance peaks among IPs isolates, with notable annual fluctuations (R2 = 0.90). Resistance to ceftazidime (CAZ) and cefepime (FEP) was the highest (100%) in 2012 but gradually declined in 2015 (71%) (Z = −3.20, p < 0.05) and remained elevated for CIP and CTX (29%) (Z = 0.95, p > 0.05), whereas amikacin (AK) (50%) and gentamicin (CN) (100%) exhibited increasing resistance trends (Z = 1.35, p > 0.05). From 2016 to 2019, the resistance levels stabilized for CIP (38.8–75%) (Z = 3.25, p < 0.05) and CTX (35.2%–64.5%) (Z = 2.89, p < 0.05), with intermittent carbapenem resistance noted for ertapenem (ETP) (46.3%) (Z = 0.15, p > 0.05) and meropenem (MEM) (55.4%) (Z = 0.28, p > 0.05). Colistin (CT) and polymyxin B (PB) consistently demonstrated sensitivity (100%), whereas TGC, piperacillin/tazobactam (TZP), ceftazidime (CAZ), and ampicillin/sulbactam (SAM) showed high resistance rates (100%). Among the OP isolates, AMR exhibited a notable increase during the spring seasons from 2012 to 2016, particularly for SAM, TZP, CTX, and MEM, with resistance rates approaching 100% (Z = 2.3, p < 0.05) (R2 = 0.52). A temporary reduction in resistance was observed in 2017 for SAM, CAZ, aztreonam (ATM), FEP, MEM, and LEV, showing a 50% decrease that extended to 2018. This was followed by a modest resurgence in the resistance levels in 2019. By the end of the observation period, the resistance rates for SAM, ATM, and LEV increased to 66.6% (Z = 2.5, p < 0.05), CAZ and FEP demonstrated complete resistance at 100% (Z = 4.1, p < 0.05), and MEM displayed a resistance rate of 33.3% (Z = −0.5, p > 0.623) (Fig. 4).
A. baumannii: Autumn peaks in resistance were observed in IP isolates from 2012 to 2019, with high resistance rates for SAM, CAZ, and FEP in 2012 (100%), extending to the TGC in 2013 (100%) (R2 = 0.69). Resistance declined in 2014 (100%) and remained low until a resurgence in 2018 for SAM, CAZ, FEP, IPM, DOX, and MEM (100%) (Z = −2.68, p < 0.05). By 2019, the resistance levels for SAM, CAZ, CIP, and LEV had remained elevated, whereas CT and PB remained consistently susceptible (100%) (Z = 2.35, p < 0.05). The resistance spiked during spring from 2015 to 2019, with resistance levels near 100% for FEP (Z = 3.45, p < 0.05), MEM (Z = 3.89, p < 0.05), and CIP (Z = 4.12, p < 0.05) (R2 = 0.57). CT and PB consistently maintained a 100% sensitivity (Fig. 4).
P. aeruginosa: Resistance among IPs isolates peaked in summer, with near-total resistance to CAZ, FEP, and MEM (100%), except for slight reductions in 2015 and 2017 (50%) (Z = −0.156, p > 0.05) (R2 = 0.52). The CT and PB remained sensitive throughout the study period (100%). OPs isolates exhibited peak resistance during winter, with elevated rates of piperacillin (PRL), piperacillin/tazobactam (TZP), ceftazidime (CAZ), cefepime (FEP), aztreonam (ATM), IPM, MEM, doripenem (DOR), CN, tobramycin (TOB), AK, CIP, and LEV (100%) (Z = 3.12, p < 0.05) (R2 = 0.91). Temporary reductions in resistance were noted in 2015 (50%), 2016 (66.6%), and 2019 (40%) (Z = −0.196, p > 0.05), whereas CT consistently showed effectiveness in these isolates (100%) (Fig. 4).
These results suggest seasonal peaks in AMR, particularly in the winter, highlighting the need for targeted antimicrobial stewardship and tailored interventions during high-risk periods. The AMR patterns of the other bacterial isolates are shown in Supplementary Fig. 2.
Trends in multiple antibiotic resistance among predominant hospital isolates: annual variations and peak seasonal patterns
The MAR index was calculated and analyzed across years and hospital settings to investigate the resistance dynamics associated with the peak AMR seasons among the predominant hospital isolates. Comparative analysis revealed distinct patterns in MAR burden.
Among all the isolates, S. aureus exhibited the highest MAR index (0.9–1.0), predominantly in IP settings, with a pronounced peak during winter in 2017, 2018, and 2019. P. aeruginosa followed closely, showing elevated MAR values (0.8–0.89 and 0.9–1.0) in both IP and OP settings, with seasonal peaks observed in summer (2018) and winter (2016–2018) (Table 2).
These findings highlight the disproportionate contribution of these pathogens to the hospital AMR burden, emphasizing the urgent need for targeted surveillance and robust infection control strategies during high-risk periods of S. aureus infection.
Association of antibiotic resistance genes with high multiple antibiotic resistance index isolates: a laboratory-based study
To assess the burden and temporal trends of AMR among S. aureus isolates with a high MAR index, the prevalence of key ARGs was evaluated using singleplex PCR. Notably, mecA, vanA, and tetM demonstrated consistently high prevalence (> 70%) during the peak MAR index years (2017–2019), whereas mecB, cfr, and dfrA1 were detected at lower frequencies (< 30%). The ermB, ermC, gyrA, gyrB, sul1, and sul2 genes were moderately persistent (50–70%) (Fig. 5A). These findings underscore the persistent threat posed by critical ARGs, particularly mecA and vanA, which confirm the presence of MRSA and VRSA, respectively. This highlights the urgent need for enhanced AMR surveillance and targeted interventions.

Molecular profiling of antibiotic resistance genes. A Prevalence of ARGs detected via singleplex PCR in the highest MAR index harboring S. aureus isolates from 2017 to 2019, with vanA and mecA being identified as the predominant resistance genes. B Hierarchical clustering (complete linkage) illustrates the similarity patterns among various ARGs, providing insights into the structure and dynamics of the resistome. C Correlation matrix analysis revealed positive associations among vanA, mecA, tetM, and aph(3′), suggesting co-occurrence and potential horizontal dissemination during this period. Key: Antibiotic resistance genes (ARGs), multiple antibiotic resistance (MAR), beta-lactams: mecA, mecB, aminoglycosides: aac(6′), aph(3′) macrolides: ermB, ermC, quinolones: gyrA, gyrB, parC, oxazolidinones: cfr, glycopeptides: vanA, vanB, tetracyclines: tetA, tetM, sulfonamides, and trimethoprim: sul1, sul2, dfrA1
Hierarchical clustering using a complete-linkage approach revealed complete similarity among vanA, mecA, tetM, and aph (3′), while other ARGs formed clusters with varying degrees of similarity (Fig. 5B). This indicates that these ARGs play a prominent role in driving resistance and facilitating their dissemination.
A correlation matrix further confirmed the strong associations among vanA, mecA, tetM, and aph (3′) (r = 1.0, p < 0.05), suggesting their co-occurrence and collective dissemination (Fig. 5C). These results highlight the complexity of the resistance profile of S. aureus, emphasizing the intricate interactions among ARGs that shape resistance patterns.