Compounds and materials
All compounds and materials are provided in Supplementary Table S1.
Animals, virus and infection
Male specific pathogen-free C57BL/6 mice weighing 20–25 g were purchased from Charles River Laboratories. All mice were housed under controlled temperature (22 ± 2 °C), humidity (50 ± 20%) and lighting (6:30 a.m.–6:30 p.m.) in solid bottom cages with food and water available ad libitum. All experiments were performed using the same batch of healthy animals. This animal study was randomized, placebo-controlled and double-blind design. And the animal study was designed to generate groups of equal size. Animals were excluded from analysis if they were emaciated or died in the process of our study.
This study utilized influenza A/California/7/2009 (H1N1) virus obtained from the American Type Culture Collection. The lethal dose of H1N1 virus was determined in mouse infection experiments. Briefly, mice (n = 10 per group) were anesthetized with 2.5% isoflurane and then intranasally infected with 10-fold serial dilutions of the virus. Mortality was monitored for 15 days post-infection. The median lethal dose (LD50) was calculated using the Reed-Muench method. Mice under anesthesia were intranasally instilled with 50 µl PBS containing 0.8 × LD50 (8 × TCID50) of H1N1 virus in this study. All experiments involving live viruses and live mice were performed in a Biosafety Level 2 Plus (BSL-2+) laboratory following governmental and institutional guidelines. Animal experiments received approval (20230454) from the Animal Care and Use Committee of Guangzhou Medical University and were performed in strict accordance with approved guidelines.
Study design of mice
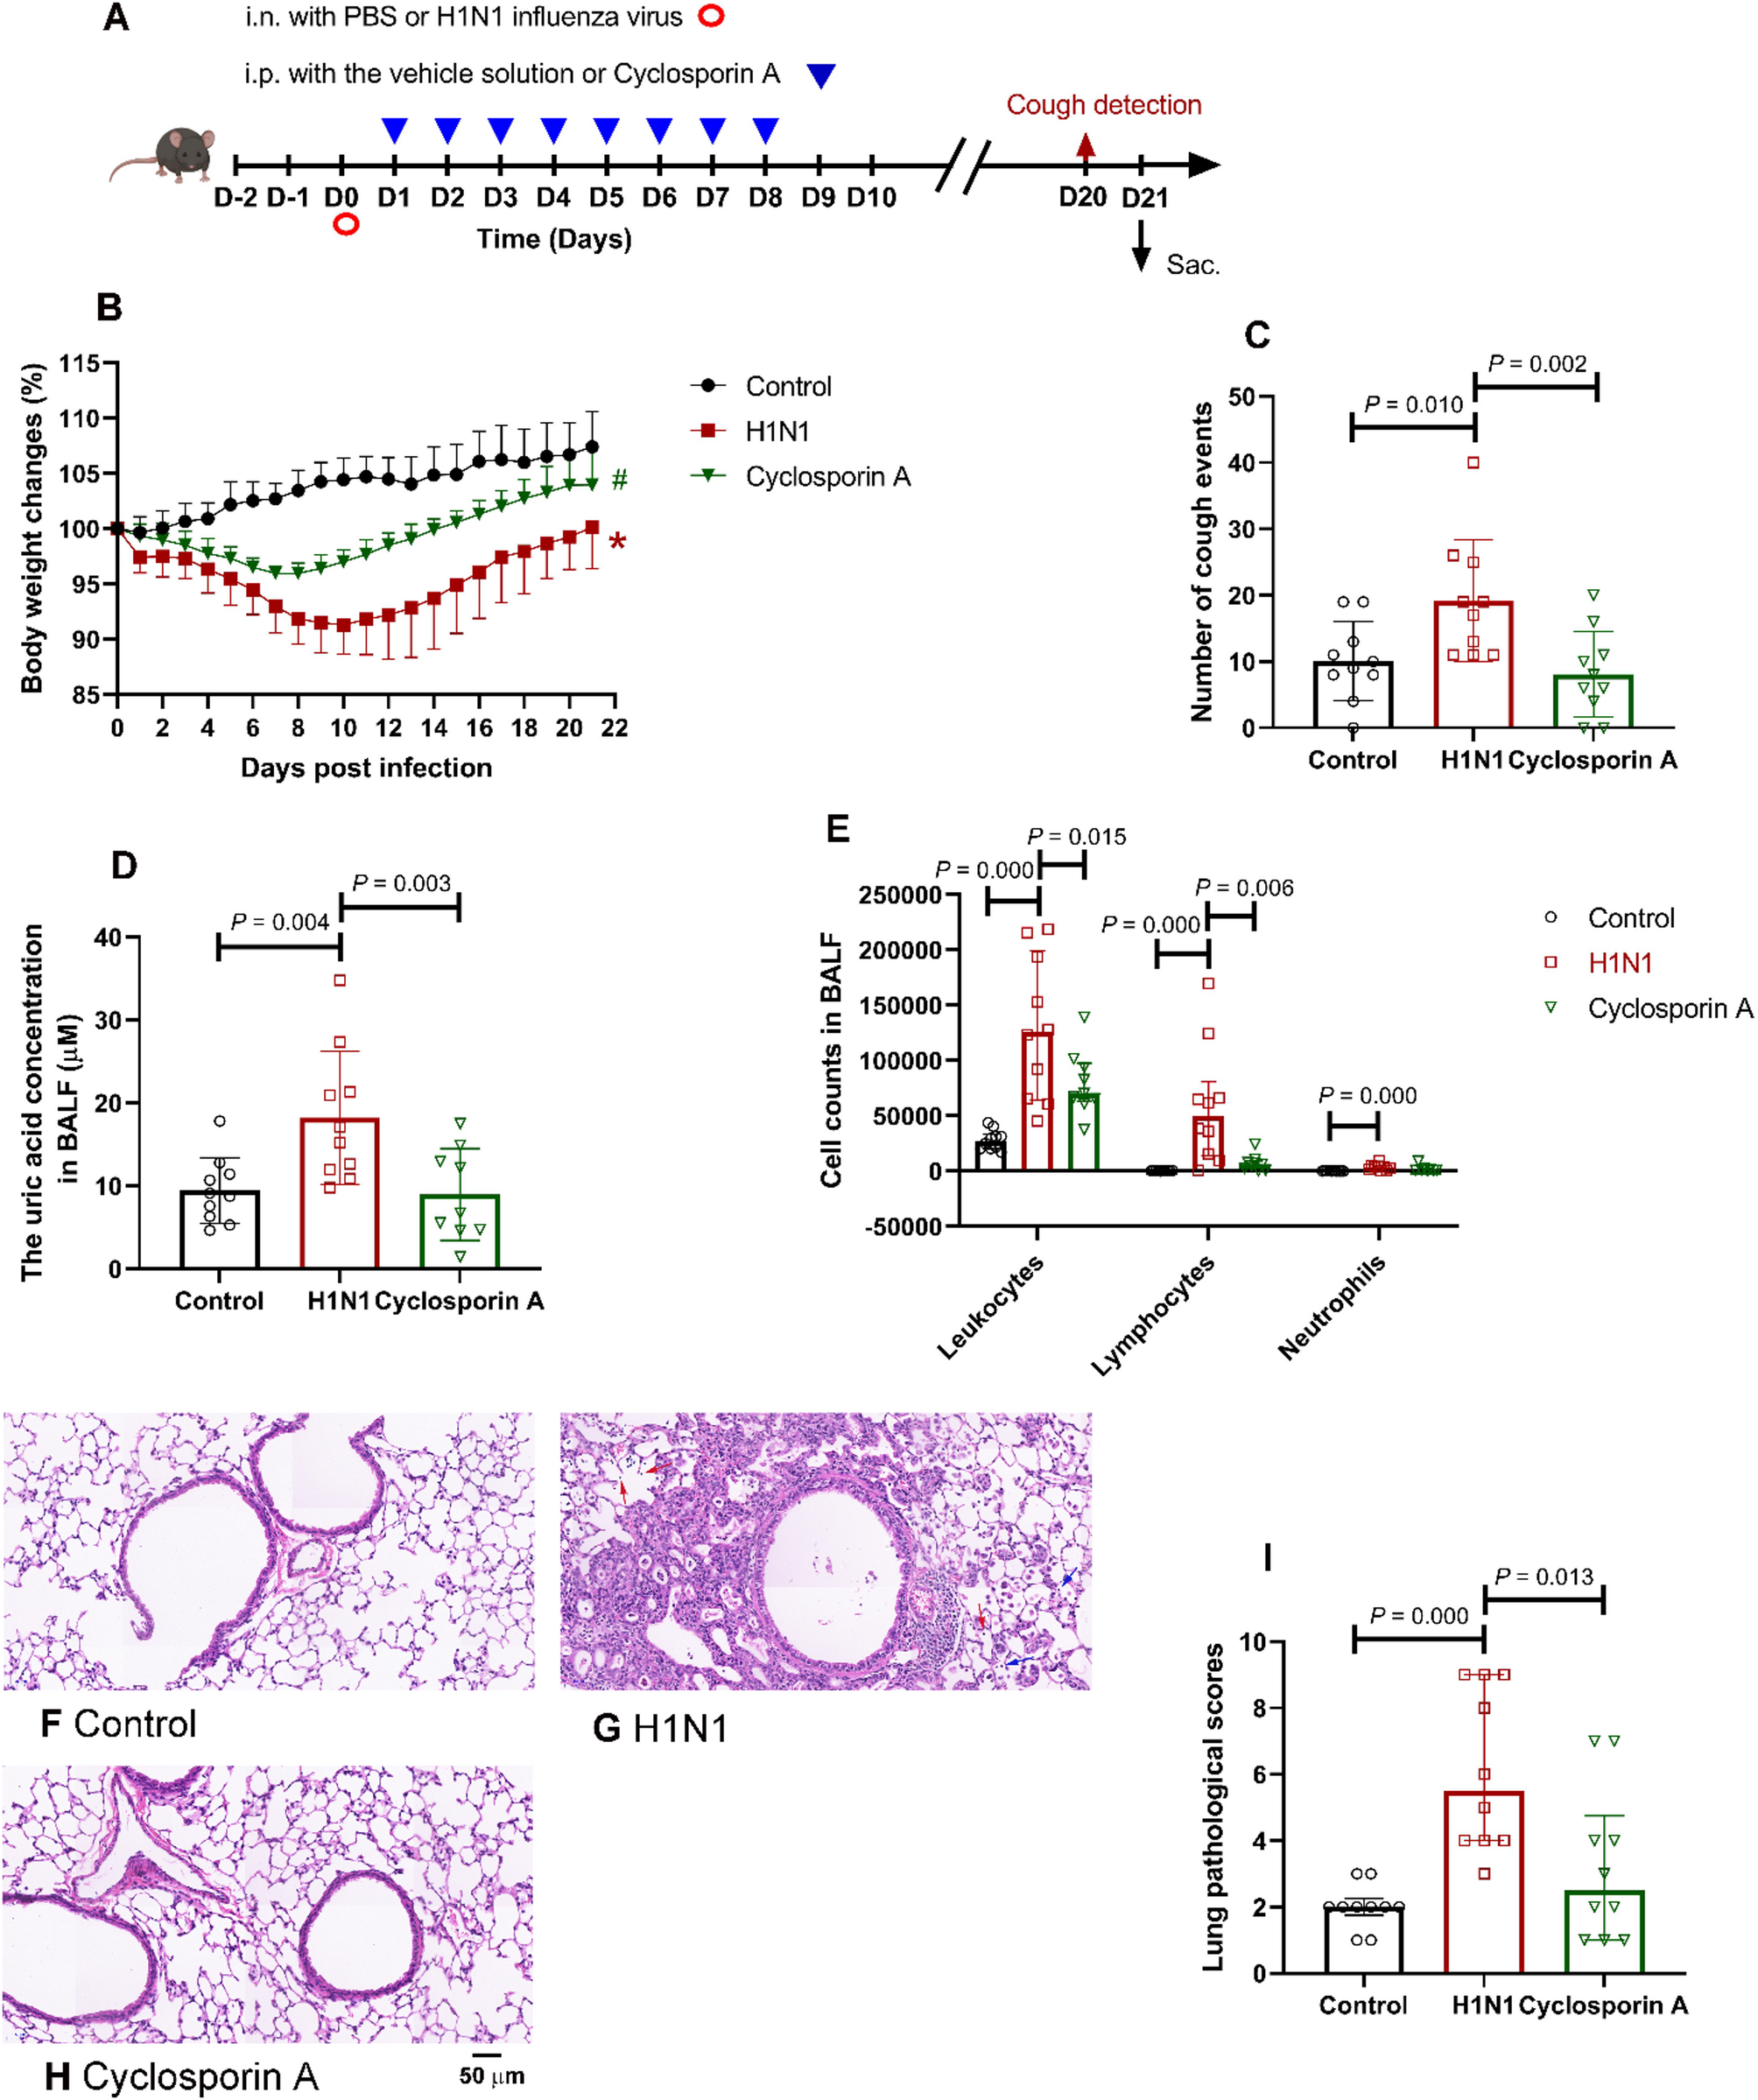
Following a 2-week acclimation period, mice were randomly allocated into the control group, H1N1 group, and Cyclosporin A group (cyclosporin A, 25 mg/kg). With the exception of control animals, all mice received a single intranasal administration of 0.8 × LD₅₀ (8 × TCID₅₀) H1N1 virus dissolved in 50 µl PBS under anesthesia. Mice in the control group and the H1N1 group were intraperitoneally injected with the vehicle solution (5% DMSO + 40% PEG300 + 5% Tween-80 + 50% water, 0.2 ml), while mice in the Cyclosporin A group were intraperitoneally injected with cyclosporin A dissolved in the vehicle solution. Drug administration commenced on day 1 post-infection and continued for 8 consecutive days. Cough sensitivity was assessed in all experimental mice on Day 20 post-infection. Cough responses were elicited by exposing conscious, unrestrained mice to aerosolized 0.4 M citric acid for 10 min in a whole-body plethysmograph (Buxco, USA). Cough events were quantified by simultaneous analysis of pressure changes and audio recordings. On Day 21 post-infection, all mice were humanely anesthetized via intraperitoneal injection of pentobarbital sodium (150 mg/kg). Blood, bronchoalveolar lavage fluid (BALF), spleen and lung tissues were collected and processed according to established protocols [14]. This experimental protocol is also supplied in Fig. 1A.
Effects of cyclosporin A on H1N1 virus-induced chronic pulmonary inflammation in mice. (A) The experimental protocol for the mice that were treated with H1N1 virus and cyclosporin A. Cough sensitivity was detected in all the mice on Day 20. All the mice were sacrificed 21 days after intranasally administrated with H1N1 influenza virus or PBS. Group data showing the effects of H1N1 virus and cyclosporin A on the changes in body weight of mice (B). *, P = 0.000, compared with the “Control”. #, P = 0.020, compared with the “H1N1”. (C) The number of cough events within 10 min of exposing the animals to aerosolized citric acid (0.4 M). n = 10 per group in Fig. 1B and C. Summarized data showing the effects of H1N1 virus and cyclosporin A on the uric acid concentration (D) and cell counts (E) in BALF. n = 10 in Control group and H1N1 group in Fig. 1D and E, n = 9 in Cyclosporin A group in Fig. 1D and E. (F-H) Representative figures of pathological changes in hematoxylin and eosin-stained lung sections from the group of “control” (F), “H1N1” (G), and “Cyclosporin A” (H). The symbol of “↑” marks the infiltration of lymphocytes (Red) and neutrophils (Blue). Scale bars are 50 μm for the electron micrographs. (I) Summarized data showing the total lung pathological scores of mice (n = 10 per group). Data are shown as mean ± SD in Figure C, D and E. Otherwise, data are shown as median (IQR). Mice in different groups were treated as follows: the control group (i.n. with PBS + i.p. with the vehicle solution), H1N1 group (i.n. with 0.8 × LD50 dose of H1N1 virus + i.p. with the vehicle solution), and Cyclosporin A group (i.n. with 0.8 × LD50 dose of H1N1 virus + i.p. with 25 mg/kg cyclosporin A). Sac., Sacrifice; i.n., intranasal; i.p., intraperitoneal; LD50, median lethal dose
Survival rates and body weight changes
Survival rates and body weights in each group were recorded daily throughout the experimental period. Animal welfare was assessed daily through monitoring of weight loss (> 30%), activity levels (severe lethargy, or inability to access food/water), and clinical signs (hunching, dyspnea), using these predefined humane endpoints to ensure minimal suffering. Mice were painless killed with overdose pentobarbital sodium upon reaching the predefined humane endpoints.
Analyses of BALF
For BALF collection, the right lung (reserved for other analyses) was isolated by ligating the right mainstem bronchus. BALF was collected by lavaging the left lung three times with 0.4 ml phosphate buffered saline (PBS). After centrifugation (800 × g, 5 min, 4 °C), the supernatant was collected and stored at − 80 °C for subsequent analyses. Leukocytes in BALF were quantified using a hemocytometer. The precipitate was then smeared onto glass slides for hematoxylin and eosin (H&E) staining. Differential cell counts were performed by categorizing leukocytes into neutrophils, macrophages, lymphocytes, and eosinophils on each slide. Uric acid concentrations in BALF supernatant were measured using commercial assay kits following the manufacturer’s protocol.
Virus titrations
Viral titers were quantified in lung tissue homogenates. Lung tissues were homogenized in tris buffered saline (10 µl/mg). Consequently, the lung tissue homogenates were centrifuged at 8000 × g for 10 min at 4 °C. The supernatant was collected for viral titer determination. All viral stocks were propagated in Madin-Darby canine kidney cells. The 50% tissue culture infectious dose (TCID50) was determined through serial virus titration in Madin-Darby canine kidney cells, with titers calculated using the Reed-Muench method as previously described [15].
Histopathological analyses of mouse lungs
Lung tissues were fixed in 4% paraformaldehyde and paraffin-embedded. Mouse lung sections were deparaffinized in xylene and rehydrated through a graded alcohol series, followed by H&E staining for histopathological evaluation. Lung histological changes were scored in terms of lung edema, inflammatory cell infiltration, erythrocyte extravasation and alveolar architecture disruption. Lung histological changes were evaluated using a 4-point scoring system: (0) none, (1) mild, (2) moderate, and (3) severe. The aggregate of these individual scores provided a quantitative measure of total lung pathology.
Enzyme-linked immunosorbent assay (ELISA)
Lung tissues were homogenized in a tissue lysis buffer and centrifuged at 12,000 × g for 20 min at 4 °C. The resulting supernatant was collected for ELISA analysis. IFN-γ concentrations were quantified using commercial ELISA kits following the manufacturer’s protocol. Optical density was measured at 450 nm using a microplate reader (Thermo Fisher, USA).
Flow cytometry analyses of mouse mononuclear cells from blood cells, lung tissues and spleen tissues
Peripheral blood mononuclear cells (PBMCs), lung-resident mononuclear cells (LRMCs) and spleen mononuclear cells (SMCs) were isolated from blood cells, lung tissues and spleen tissues as previously described [7, 14, 16].
Following centrifugation of the collected PBMCs, LRMCs, and SMCs, the residual erythrocytes in the pellet were removed with erythrocyte lysis buffer. The extracted PBMCs, LRMCs, and SMCs were resuspended in PBS and subjected to flow cytometric analyses.
For cell staining, cells were first stimulated with Golgiplug. Subsequently, cells were incubated with murine Fc receptor blocking, a mixture of CD3, CD4, CD8, CXCR3 and CCR4 antibodies and the intracellular antibody of IFN-γ. Flow cytometry was performed using BD FACS VerseTM, and data were analyzed with FlowJo software (TreeStar, Ashland, Ore). The gating strategy was described in Supplementary Figure S1.
Statistical analysis
Data normality was assessed using Shapiro–Wilk and Kolmogorov–Smirnov tests. Normally distributed data were presented as mean ± standard deviation (SD), while non-normal data were expressed as median (interquartile range, IQR). For normally distributed data, one-way ANOVA followed by Bonferroni’s multiple comparison tests were used for group comparisons. Post-hoc tests were performed only if F achieved P < 0.05 and there was no significant variance inhomogeneity. Non-normally distributed data were analyzed using Kruskal-Wallis tests for multiple groups or Mann-Whitney U tests for two-group comparisons. Statistical significance was defined as two-tailed P < 0.05 for all analyses.