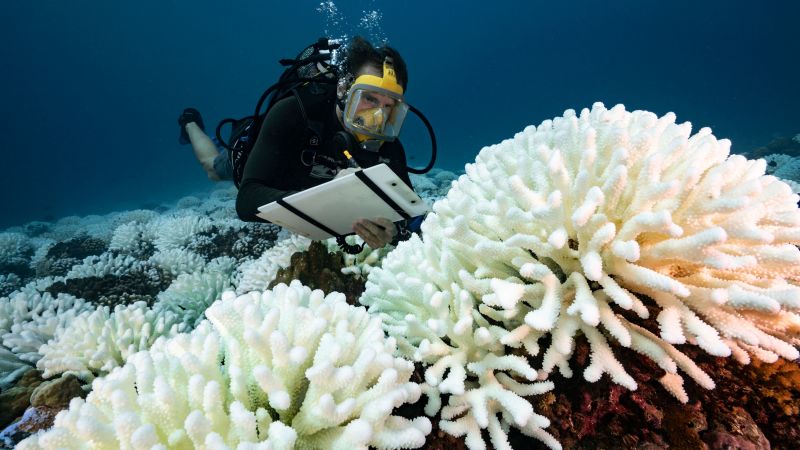
Association between the C-reactive protein-triglyceride glucose index and new-onset coronary heart disease among metabolically heterogeneous individuals | Cardiovascular Diabetology

Baseline characteristics of participants according to CTI quartiles

Table 1 presents the baseline characteristics of participants categorized by CTI quartiles (C1: < 9.57; C2: 9.57—9.88; C3: 9.88—10.23; C4: > 10.23). A total of 2,237 patients were included, with 48.3% being male and a median age of 63.5 years (IQR 57.00—68.00). Among the CTI quartile groups, the number of CHD cases was as follows: C1 (lowest quartile), n = 354; C2, n = 436; C3, n = 504; and C4 (highest quartile), n = 530. The MUOO phenotype constituted the largest proportion across all metabolic subgroups. In contrast, the number of metabolically healthy individuals was relatively limited, which may be explained by their generally milder clinical manifestations and lack of underlying comorbidities—factors that likely reduced the probability of undergoing definitive diagnostic procedures, such as coronary angiography, in routine clinical settings. Across increasing CTI quartiles, SBP, DBP, BMI, WC, FPG, HbA1c, TC, TG, and LDL-C progressively increased (P < 0.001). In addition, patients in the higher CTI quartiles exhibited a higher prevalence of diabetes and hypertension and were more likely to be receiving antihypertensive, antidiabetic, and lipid-lowering therapies (P < 0.001). Baseline characteristics of participants across different metabolic phenotypes are presented in Table S1, and the overall study flow is illustrated in Fig. 1.

Table 1 Baseline characteristics according to CTI quartiles

Identification of factors associated with new-onset CHD

This study systematically evaluated the strength of association between multiple variables and new-onset CHD using feature selection methods. Feature selection was performed using the Boruta algorithm, with results presented in Fig. 2A and B. Following 500 iterations, we identified the ten variables most strongly correlated with CHD, ranked by z-scores. These key factors include the HDL-C, CTI, WC, TG, TyG, BMI, CALLY, HbA1c, neutrophil (NEUT) and LYM. To further elucidate the relationships between these factors, we applied SHAP analysis, as shown in Fig. 2C. A color gradient from blue to red reflects the increasing strength of each variable’s association with the model. The vertical axis displays the ranked importance of variables in the diagnostic assessment of new-onset CHD. The relationship between feature values and their corresponding SHAP values is also displayed, highlighting how each factor influences the model’s. Additionally, Fig. 2D further delineates the associations between the top ten contributing factors and new-onset CHD. Finally, Fig. 2E presents an interactive nomogram incorporating the six most strongly associated factors—such as CTI, HDL-C, and TyG—providing a visual representation of the relative contribution of each factor to CHD at a given time point.

Associations between the CTI and incidence of new-onset CHD

Logistic regression analysis demonstrated a significant positive association between increasing CTI levels and the likelihood of new-onset CHD diagnosis, suggesting that individuals with higher CTI values were more likely to be diagnosed with CHD (Table 2). This association remained robust even after adjusting for potential confounders (P for trend < 0.001). When compared to the baseline group (C1), the ORs for C2, C3, and C4 were 2.75 (95% CI: 1.63—4.22), 3.61 (95% CI: 2.84—5.20) and 6.83 (95% CI: 5.29—9.01), respectively, reflecting a positive association between increasing CTI levels and the likelihood of CHD. Table S2, using CTI tertile stratification, further corroborates the robustness and consistency of the observed associations.

Table 2 Association between the CTI and new-onset CHD

Figure 3A presents the results from the RCS models, which illustrate the non-linear relationship between the CTI and overall new-onset CHD. The analysis revealed a statistically significant non-linear association between CTI and new-onset CHD (P-overall < 0.001, P-nonlinear < 0.001). Further visualizations in Fig. 3B show the distinct distribution of CTI values in individuals with and without CHD, reinforcing its significant association with new-onset CHD status.

Fig. 3

Associations between the CTI and presence of new-onset CHD. A Dose–response relationships between the CTI and CHD in the overall population. B Violin plots of CTI distribute in individuals with and without CHD. C PCA plots illustrate the distribution of the CTI in metabolically distinct groups across populations with and without CHD. D Sensitivity analyses evaluating the association between the CTI and presence of CHD, with adjustments for age, sex, BMI, SBP, DBP, smoking, drinking, HDL-C, LDL-C, hypertension, diabetes, hyperlipidemia, TC, ALT, and AST. CTI C-reactive protein-triglyceride-glucose index; CHD coronary heart disease; OR odds ratio; CI confidence interval; PCA principal component analysis; PC principal component; MHNW metabolically healthy normal weight; MHOO metabolically healthy overweight/obese; MUNW metabolically unhealthy normal weight; MUOO metabolically unhealthy overweight/obese; BMI body mass index; SBP systolic blood pressure; DBP diastolic blood pressure; HDL-C high-density lipoprotein cholesterol; LDL-C low-density lipoprotein cholesterol; TC total cholesterol; ALT alanine aminotransferase; AST aspartate aminotransferase

Association between the CTI and new-onset CHD in metabolically heterogeneous obese individuals

As previously described, a significant association was observed between CTI and new-onset CHD diagnosis. To further investigate the heterogeneity of this association across distinct metabolic obesity phenotypes, a stratified analysis was performed based on metabolic status. When included as a continuous variable in the regression model, CTI showed a significant positive association with new-onset CHD diagnosis in both the MUNW and MUOO groups (Table 3). In the fully adjusted model, each one-unit increase in CTI was significantly associated with a 42% higher odds of new-onset CHD diagnosis in the MUNW group (OR = 1.42, 95% CI: 1.28—1.57) and a 13% increase in the MUOO group (OR = 1.13, 95% CI: 1.06—1.22), indicating a robust positive association within these metabolically unhealthy phenotypes. Furthermore, when grouped by CTI quartiles, the proportion of CHD showed an increasing trend across higher CTI quantiles. Specifically, among individuals in the MUOO group, those in the highest CTI quartile (C4) exhibited a significantly greater likelihood of CHD diagnosis compared to those in the lowest quartile (C1), with an OR of 2.28 (95% CI: 1.26—3.83). Further analysis indicated that the association between CTI and new-onset CHD was strongest in the MUNW group, with an OR of 11.30 (95% CI: 5.21—25.82) after adjusting for confounding factors.

Table 3 Association between the CTI and new-onset CHD in metabolically heterogeneous obese individuals

Figure 3C presents the distribution of the CTI across the four metabolic phenotypes, stratified by CHD status. After conducting principal component analysis (PCA), we observed a clear stratification of CTI values among individuals with CHD, with a more concentrated distribution within the CHD group compared to non-CVD patients. This clear distinction was evident in the reduced dimensionality space. As shown in Fig. 3D, the results of the multiple sensitivity analyses were consistent with the previous findings. After adjusting for potential confounders, the association between CTI and CHD remained consistent across subgroups, with the MUNW group exhibiting the highest sensitivity to CTI levels.

Subgroup analysis of the association between the CTI and new-onset CHD in metabolically heterogeneous individuals

This study aimed to evaluate the association between CTI and new-onset CHD in the context of metabolic heterogeneity, and to explore the value of CTI in stratified identification across different clinical profiles. Fig.S1 indicates that the association between CTI and CHD varies across subgroups defined by glucose metabolic status, sex, and age, suggesting the presence of heterogeneity in these relationships. To achieve this, we conducted subgroup analyses based on glucose metabolic states, gender, age, and BMI-metabolic phenotypes. Given that DM is a major contributor to CHD and other adverse clinical outcomes, we further explored the association between CTI and incident CHD across different glucose metabolic states among metabolically heterogeneous individuals. The results showed that in patients with DM or Pre-DM, CTI was significantly associated with new-onset CHD in the MUNW subgroup (Fig. 4A).

Fig. 4
figure 4

Sensitivity analyses evaluating the association between the CTI and new-onset CHD across different stratified subgroups. A stratified by glucose metabolic states. B stratified by age. C stratified by sex. CTI C-reactive protein-triglyceride-glucose index; CHD coronary heart disease; OR odds ratio; CI confidence interval; MHNW metabolically healthy normal weight; MHOO metabolically healthy overweight/obese; MUNW metabolically unhealthy normal weight; MUOO metabolically unhealthy overweight/obese; NGR normoglycemia; Pre-DM prediabetes mellitus; DM diabetes mellitus

In the age-based stratification, we observed a significant association between the CTI and CHD in both the ≤ 60 years and > 60 years groups. Particularly among individuals over 60, the CTI demonstrated the strongest association in the MUNW and MUOO subgroups (Fig. 4B). This finding highlights the enhanced capacity of CTI to identify new-onset CHD diagnoses in older adults, which may be attributed to the more complex metabolic profiles and more pronounced adverse cardiovascular phenotypes observed in this population.

When stratified by gender, the CTI exhibited a strong association with CHD in both male and female participants, with particularly notable associations in the MUNW and MUOO subgroups (Fig. 4C). Specifically, CTI showed the strongest association with CHD among female participants in the MUNW subgroup, while also demonstrating robust discriminatory performance in identifying CHD among male individuals in the MUOO group.

Analytical assessment of the association between CTI and new-onset CHD

Within the study population, CTI exhibited a markedly stronger association with CHD compared to other conventional metabolic markers (Fig. 5, Tables S2 and S3). In the analysis of Harrell’s C-index for new-onset CHD, CTI demonstrated significantly greater association compared with traditional metabolic indicators and the TyG index alone, including TyG (0.897 vs. 0.768, P < 0.001), TG (0.897 vs. 0.638, P < 0.001), and FPG (0.754 vs. 0.672, P < 0.001) (Fig. 5A). To address the potential bias introduced by uneven event distribution, we included PR curves, which corroborated the findings from the ROC curves analysis, further support that CTI demonstrates a more pronounced association with new-onset CHD compared to its individual components (Fig. 5B).

Fig. 5
figure 5

Assessment of CTI performance in distinguishing CHD status. A ROC curve analysis evaluating the diagnostic performance CTI with CHD. B PR curve analysis evaluating the diagnostic performance CTI with CHD. C calibration curve for the CTI. D DCA for the CTI. E CIC for the CTI. F confounding matrix for the CTI. TyG triglyceride-glucose index; CTI C-reactive protein-triglyceride-glucose index; ROC receiver operating characteristic; PR precision-recall; CHD coronary heart disease; TG triglyceride; FPG fasting plasma glucose; AUC area under the curve; DCA decision curve analysis; CIC clinical impact curves; CHD coronary heart disease

In Fig. 5C–F and Table S4, the calibration curve, DCA, CIC and Five-fold cross-validation provide a comprehensive assessment of the CTI’s performance in identifying individuals with CHD. Five-fold cross-validation and calibration curve analysis confirmed the good model fit of CTI-related models, further supporting the stability and reliability of CTI in cardiovascular assessment. Moreover, the DCA and CIC analyses highlighted the clinical utility of the CTI, revealing that it offers substantial net benefits and significant clinical impact within reasonable threshold probability ranges. In five-fold cross-validation, the average sensitivity and specificity based on the optimal CTI cutoff value were 98.1% and 90.9%, respectively, demonstrating its strong discriminatory ability.

Mediating role of the CALLY index in the relationship between the CTI and new-onset CHD

Table S5 presents the relationship between the CTI and the CALLY index. Multivariable logistic regression analysis demonstrated a significant inverse correlation between these two indices (P < 0.001), a finding that remained consistent even after adjusting for potential confounders. Table 4 provides an overview of the association between the CALLY index and new-onset CHD. Logistic regression results revealed a significant negative association between the CALLY index and new-onset CHD. Specifically, the OR for CHD was 0.87 (95% CI: 0.83—0.92), 0.85 (95% CI: 0.81—0.90), and 0.88 (95% CI: 0.83—0.94) (P < 0.001). This pattern further supports the robustness of the CALLY index as a mediating factor in the association between CTI and CHD.

Table 4 Association between the CALLY index and new-onset CHD

Mediation analysis revealed that the CALLY index plays a significant mediating role in the relationship between the CTI and new-onset CHD (Fig. 6). The estimated mediation effect for CALLY was 6.453 (95% CI: 1.994—9.460, P = 0.004), underscoring its pivotal role in modulating the association between the CTI and cardiovascular. Although both ALB and CRP contribute to this relationship, their mediating effects were notably weaker in comparison to CALLY.

Fig. 6
figure 6

Mediation analysis. A analysis of the mediation by CALLY index of the associations of CTI with CHD. B analysis of the mediation by ALB index of the associations of CTI with CHD. C analysis of the mediation by CRP index of the associations of CTI with CHD. D analysis of the mediation by LYM index of the associations of CTI with CHD.CTI C-reactive protein-triglyceride-glucose index; CHD coronary heart disease; CALLY C-reactive protein-albumin-lymphocyte; CI confidence interval; ALB albumin; CRP C-reactive protein; LYM lymphocyte; CI confidence interval

Enhanced association with new-onset CHD through the combination of CTI and CALLY index

The likelihood ratio test results demonstrate that the model incorporating both CTI and the CALLY index demonstrated superior performance compared to the CTI-alone model and models combining CTI with individual markers such as ALB or LYM, indicating a synergistic contribution of immunonutritional markers in enhancing the discriminatory capacity for new-onset CHD (Table S6). Additionally, this combination substantially improves the fit of the CTI with respect to CHD, highlighting its value in refining association.

Incorporating the CALLY index substantially elevated the association between CTI and CHD status (C-statistic: 0.897 vs. 0.926, P < 0.001) (Table S7). Additionally, all measures of NRI and IDI for CHD were significantly enhanced (P < 0.001). Although the baseline model, which included traditional markers such as CRP, exhibited moderate explanatory capacity for cardiovascular, the incorporation of the CALLY index significantly enhanced the model’s goodness-of-fit and discriminatory power, underscoring its added value in cardiovascular stratification.

Association between the combination of the CTI and CALLY indices and new-onset CHD in metabolically heterogeneous individuals

The CTI and CALLY indices were categorized into high and low groups based on their median values (CTI < 9.887 and CTI ≥ 9.887; CALLY: < 1.221 and ≥ 1.221). Logistic regression revealed a significant association between the combined indices and new-onset CHD, which persisted after adjusting for confounders (P < 0.001, Table 5). Notably, individuals with high CTI levels (≥ 9.887) and low CALLY index values (< 1.221) exhibited the highest proportion of new-onset CHD diagnoses, with an OR of 2.36 (95% CI: 2.06—2.69).

Table 5 Association between the combination of the CTI and CALLY indices in new-onset CHD

Among metabolically heterogeneous individuals, particularly within the MUNW subgroup, the combined use of CTI and the CALLY index demonstrated a stronger association with new-onset CHD compared to either marker alone. In this subgroup, those with high CTI and low CALLY had a significantly higher proportion of new-onset CHD diagnoses compared to those with low CTI and high CALLY (OR = 2.238, 95% CI: 1.867—3.085). While the association in the MUOO subgroup was somewhat less pronounced, it still exhibited partial statistical significance (Fig. 7).

Fig. 7
figure 7

Association of the combined CTI and CALLY indices with new-onset CHD among metabolically heterogeneous obese individuals: A MHNW group. B MHOO group. C MUNW group. D MUOO group. CTI C-reactive protein-triglyceride-glucose index; CALLY C-reactive protein-albumin-lymphocyte; CHD coronary heart disease; OR odds ratio; CI confidence interval; MHNW metabolically healthy normal weight; MHOO metabolically healthy overweight/obese; MUNW metabolically unhealthy normal weight; MUOO metabolically unhealthy overweight/obese

Continue Reading