Study design and participants
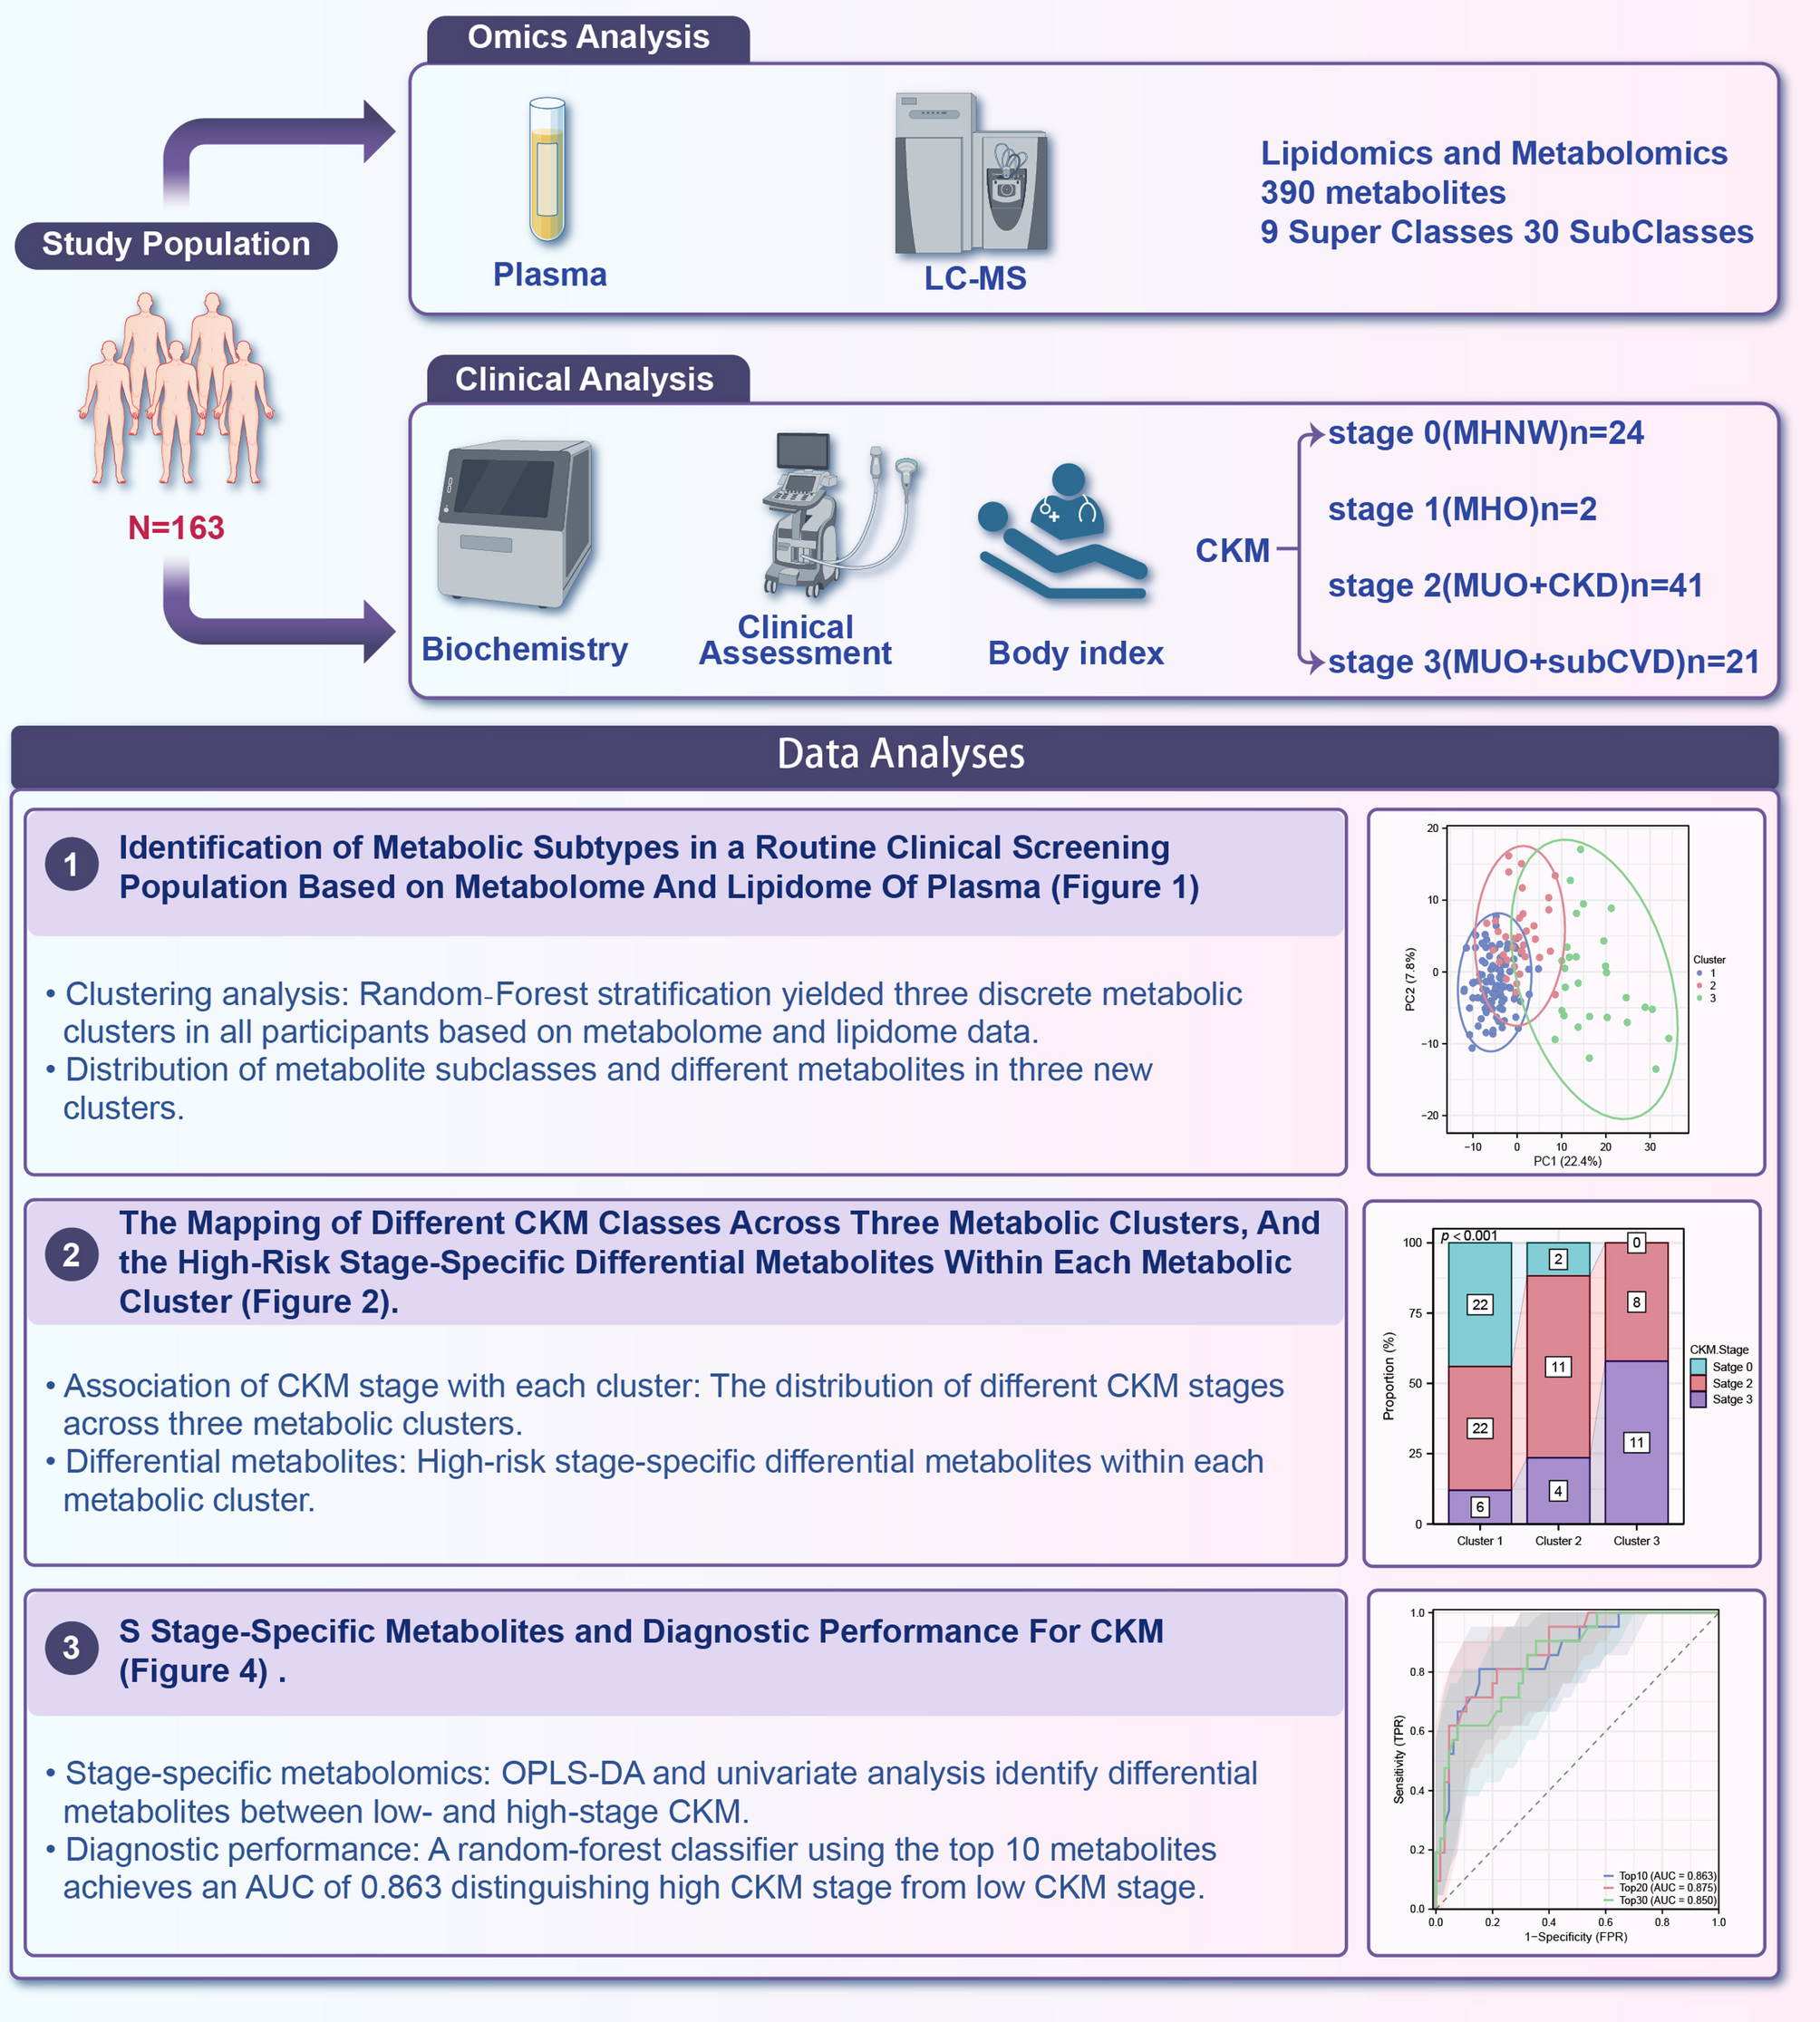
This cross‐sectional study enrolled 163 adults (aged 18–75 years) from Shandong Provincial Hospital between January and December 2024 [25]. Exclusion criteria were active infection, malignancy, chronic inflammatory disease, recent surgery (< 3 months), and use of lipid‐modifying or immunomodulatory medications. All participants provided written informed consent under a protocol approved by the Institutional Review Board of Shandong Provincial Hospital.
Clinical data-including age, sex, ethnicity, medication use, and history of hypertension, T2D-were collected via standardized questionnaires. BMI was calculated from measured height and weight. Carotid plaque data were obtained via carotid ultrasound examination. Systolic and diastolic blood pressures were measured in triplicate after 5 min of rest using an automated sphygmomanometer. Fasting blood samples were obtained between 7:00 and 9:00 AM after an overnight fast of ≥ 8 h. Routine laboratory parameters—fasting glucose, lipid panel (total cholesterol, high-density lipoprotein cholesterol [HDL-C], low-density lipoprotein cholesterol [LDL-C], triglycerides [TG]), serum creatinine, and urea nitrogen—were measured in the central clinical laboratory using standardized assays.
Plasma collection
Venous blood (10 mL) was drawn into K2‐EDTA tubes, kept on ice, and centrifuged at 1500×g for 10 min at 4 °C. Plasma aliquots (500 µL) were stored at − 80 °C.
LC–MS-based untargeted metabolomics profiling
Metabolomics analysis was performed as previously described [37]. Briefly, 400 µL of cold methanol (MeOH) containing internal standards was added to 50 µL of plasma sample. After vortex mixing, proteins were removed by centrifugation. The extract was lyophilized and then reconstituted with a water/methanol mixture (4:1, v/v). After dissolving and centrifuging, the supernatant was transferred into a LC–MS system for analysis. The internal standards used for metabolomics analysis and their final concentrations were as follows: Carnitine C2:0-d3 (0.03 ug/mL), Carnitine C10:0-d3 (0.02 ug/mL), Carnitine C16:0-d3 (0.025 ug/mL), Lysophosphatidylcholine 19:0 (LPC19:0, 0.125 μg/mL), Free Fatty Acid C16:0-d3 (FFA C16:0-d3, 0.4 μg/mL), Free Fatty Acid C18:0-d3 (FFA C18:0-d3, 0.4 μg/mL), Cholic Acid-d4 (CA-d4, 0.3 μg/mL), Chenodeoxycholic Acid-d4 (CDCA-d4, 0.3 μg/mL), Phenylalanine-d5 (Phe-d5, 0.5 μg/mL), Leucine-d3 (Leu-d3, 0.7 μg/mL), and Tryptophan-d5 (Trp-d5, 0.6 μg/mL).
Measurement was performed using ultra-performance liquid chromatography (UHPLC) (Shimadzu) coupled with a Triple TOF 5600 plus mass spectrometer (AB SCIEX, Framingham, USA) system. A Waters BEH C8 column (2.1 mm × 50 mm, 1.7 μm) and HSS T3 column (2.1 mm × 50 mm, 1.8 μm) was used for separation in positive and negative modes, respectively. The flow rate was set to 0.4 mL/min and the column temperature was maintained at 60 °C. The elution gradient started at 5% B, held for 0.5 min, then increased linearly to 40% B at 2.0 min, reached 100% B at 8.0 min, and held at this concentration for 2 min. Finally, the column was returned to 5% B within 0.1 min and held for 1.9 min for equilibration. In positive mode, the mobile phases consisted of water (0.1% formic acid, phase A) and acetonitrile (0.1 mM formic acid, phase B). In negative mode, the mobile phases consisted of water (6.5 mM ammonium bicarbonate, phase A) and 95% methanol (6.5 mM ammonium bicarbonate, phase B).
For mass spectrometry (MS) parameters, the flow rates of sheath gas and curtain gas were set to 55 and 35 psi, respectively. The scan range was set to m/z 100–1250 with a collision energy of 10 V. For dd-MS2 mode, the scan range was set to m/z 50–1250 with collision energy at 35 ± 15 V. In positive ion mode, the ion spray voltage floating was set to 5.5 kV, and the capillary temperature was 550 °C. In negative ion mode, the ion spray voltage floating was − 4.5 kV, and the capillary temperature was 450 °C.
LC–MS-based untargeted lipidomics profiling
Lipidomics analysis was conducted according to a previously described method [38]. Lipid extraction was performed using the MeOH/H2O/MTBE technique [39]. Briefly, 300 μL of MeOH containing internal standards was added to 40 µL of plasma sample, followed by vortex mixing. Then, 1 mL of methyl tert-butyl ether (MTBE) was added, and the mixture was vortexed for 10 min. Next, 300 μL of H2O was added, and the mixture was vortexed to form a two-phase system. After centrifugation. 400 μL of the supernatant was lyophilized and stored at − 80 °C. Prior to analysis, the lyophilized samples were reconstituted with ACN/IPA/H2O (65:30:5, v/v/v/) containing 5 mM ammonium acetate. A 5 μL aliquot of the sample was transferred into the LC–MS system for analysis. The internal standards used for lipidomics analysis and their final concentrations were as follows: Phosphatidylcholine 38:0 (PC 38:0, 1.67 μg/mL), Phosphatidylethanolamine 34:0 (PE 34:0, 0.83 μg/mL), Lysophosphatidylcholine 19:0 (LPC 19:0, 0.67 μg/mL), Sphingomyelin 12:0 (SM 12:0, 0.83 μg/mL), Triglyceride 45:0 (TG 45:0, 1.33 μg/mL), Ceramide 17:0 (Cer 17:0, 0.33 μg/mL), Free Fatty Acid 16:0-d3 (FFA 16:0-d3, 0.67 μg/mL), and Free Fatty Acid 18:0-d3 (FFA 18:0-d3, 0.67 μg/mL).
Lipidomics analysis was performed using a Waters ACQUITY UHPLC (Shimadzu) coupled with an AB SCIEX Triple Q-TOF 5600 Plus (Concord, Canada). A Waters BEH C8 column (2.1 mm × 100 mm, 1.7 μm) was used for lipid separation. The mobile phases consisted of 3:2 (v/v) acetonitrile (ACN)/H2O (10 mM AcAm, phase A) and 9:1 (v/v) isopropanol (IPA)/ACN (10 mM AcAm, phase B). The flow rate was set to 0.26 mL/min, and the column temperature was maintained at 55 °C. The elution gradient started at 32% B, was held at this concentration for 1.5 min, then increased linearly to 85% B at 15.5 min, reached 97% B at 15.6 min, and was held at this concentration for 2.4 min. Finally, the column was returned to 32% B within 0.1 min and held for 1.9 min for equilibration.
The ion spray voltage for MS was set to 5500 V and 4500 V in positive and negative ion modes, respectively. The interface heater temperature was set to 500 °C in positive mode and 550 °C in negative mode. The flow rates for ion source gas 1, ion source gas 2, and curtain gas were set to 50, 50, and 35 psi in positive ion mode and 55, 55, and 35 psi in negative ion mode, respectively. The MS scan range was 300–1250 Da in positive mode and 150–1250 Da in negative mode.
Samples were run in a randomized order to minimize systematic bias. Prior to analysis, 10 blank injections were performed to ensure baseline stability and clean system conditions. Quality control (QC) samples were analyzed as the first ten injections to condition and stabilize the mass spectrometry instruments. In the batch of real samples, each blank sample and each QC sample were injected after every 10 real samples.
Annotation of metabolites and data processing
Raw LC–MS data were processed using MS-DIAL (Version 4.90) software, with metabolite and lipid identification referenced against an in-house database. Compounds were annotated based on their accurate mass, chromatographic retention time and MS/MS fragmentation patterns. Specifically, 174 metabolites were identified in the metabolomics analysis, and 324 lipids were identified in the lipidomics analysis. After removing compounds detected in both ionization modes, and those with low signal-to-noise ratio and high coefficient of variation, 390 unique metabolites were retained. Multiquant software was used for quantification of raw data. The metabolites and lipids in each sample were normalized based on their corresponding internal standards.
Processed peak areas were log₁₀‐transformed and Pareto‐scaled; missing values (< 5%) were imputed by k‐nearest neighbors (k = 5) in MetaboAnalyst 5.0.
Metabolite classification and pathway enrichment
Annotated metabolites were categorized by HMDB class (e.g. glycerophospholipids, glycerolipids, sphingolipids, fatty acyls, acylcarnitines). One-way ANOVA followed by False Discovery Rate (FDR) correction (Benjamini–Hochberg, FDR < 0.05) was applied to identify differentially abundant metabolites across clusters. KEGG pathway enrichment analysis was performed using the hypergeometric test (FDR < 0.05) in MetaboAnalyst, with all annotated metabolites serving as the background reference.
External validation using public metabolomics cohorts
To validate the CKM-associated metabolite panel, we reanalyzed three publicly available untargeted metabolomics datasets related to cardiovascular or kidney conditions, accessed from the Metabolomics Workbench. These datasets were selected to represent relevant disease axes of the CKM spectrum: kidney disease, coronary atherosclerosis, and microvascular dysfunction. For validation, we intersected our top 30 CKM differential metabolites with those detected in each dataset, and performed classification modeling using random forest and ROC analysis.
-
(1)
ST000816—CKD cohort (diabetic kidney disease) This dataset includes plasma lipidomics profiling of patients with type 2 diabetes, stratified by progression of diabetic nephropathy. A total of 100 samples were used for validation, including 50 progressors and 50 non-progressors, based on eGFR decline over time. We used the baseline samples only to compare future progression status. Sixteen of the CKM-featured metabolites overlapped with this dataset.
-
(2)
ST003661—CTO cohort (chronic total occlusion of coronary arteries) This study includes plasma samples from patients undergoing percutaneous coronary intervention (CTO-PCI) for chronic total occlusion. Samples were collected at multiple timepoints (pre-PCI, 24 h post-PCI, 72 h post-PCI), and from healthy matched controls. For our analysis, we compared the pre-operative CTO group (n = 31) with healthy controls (n = 20) to focus on pre-treatment cardiovascular signatures. Eight of the CKM-related metabolites were detected in this dataset.
-
(3)
ST003275—CM cohort (coronary microvascular dysfunction) This dataset includes 75 serum samples, comprising 56 patients with coronary microvascular dysfunction (CMD) and 19 matched healthy controls, collected from a clinical cardiology cohort. It provides a distinct dimension of cardiovascular risk focused on microvascular pathophysiology. Twelve of the CKM-related metabolites overlapped with this dataset.
Statistical analysis
All statistical analyses were conducted using R software (version 4.2.1) and GraphPad Prism 9. For unsupervised clustering, k-means, hierarchical, and consensus clustering (R package ConsensusClusterPlus) were compared with cluster numbers ranging from k = 2 to 6. Optimal clustering was achieved using k-means (k = 3), which minimized random forest OOB error (randomForest) and yielded stable subgroup assignments. Cluster separation was visualized using PCA and t-SNE, with loadings examined to identify key metabolites contributing to principal components.
To assess clinical relevance, cluster assignments were overlaid on CKM stage data available for 86 participants. Chi-square tests evaluated stage distribution differences across clusters. Logistic regression models (glm), adjusted for age, sex, and BMI, were used to estimate absolute risk differences (RDs) and corresponding 95% confidence intervals (CIs) for high-risk status (Stage 3), using Cluster 1 as the reference group. Classification performance of cluster labels was assessed by ROC curve analysis, with AUC and 95% CIs computed using DeLong’s method.
Within each cluster, OPLS-DA was employed to contrast high- vs low-risk individuals. Model performance was evaluated by R2Y and Q2 values using sevenfold cross-validation and 200-permutation testing. Metabolites with variable importance in projection (VIP) > 1.0 and FDR-adjusted p < 0.05 (Student’s t-test) were considered discriminant. Heatmaps (pheatmap) visualized standardized abundances.
To explore intra-stage heterogeneity, high-risk individuals (n = 21) were re-clustered using k-means (k = 3), with subgroup stability validated by PCA and random forest OOB error. Discriminative metabolites for each endotype were identified using VIP and FDR filtering.
For biomarker discovery, significant metabolites (VIP > 1.0, FDR < 0.05) from all clusters were subjected to feature selection via random forest and ranked by mean decrease in Gini index. Logistic regression models incorporating the top 10, 20, and 30 ranked metabolites were trained using tenfold cross-validation. Model performance was evaluated using ROC analysis for AUC, sensitivity, and specificity. To formally compare the discriminative ability of competing models, we applied DeLong’s non‑parametric test for correlated ROC curves, reporting ΔAUC, two‑sided p‑value, and 95% confidence interval. Predicted probabilities from both the clinical model and the metabolite‑enhanced model were exported to the nricens package. We then computed the integrated discrimination improvement (IDI) as the difference in mean predicted risk change between cases and controls, and the category‑free net reclassification index (cfNRI) as the sum of improvement in upward reclassification among cases and downward reclassification among controls.
Continuous variables were expressed as mean ± standard deviation (SD) or median (interquartile range, IQR), and categorical variables as counts (%). Group comparisons were performed using independent t-tests or Mann–Whitney U-tests for continuous data and χ2 or Fisher’s exact tests for categorical data, as appropriate. Multiple testing was adjusted using the Benjamini–Hochberg FDR correction. A two-sided p < 0.05 was considered statistically significant. No a priori power calculation was conducted given the exploratory nature of the study.