Comparative analysis of basic data between the HBC and control groups
The clinical characteristics of the patients are presented in Table 1. Comparisons were made between 33 patients in the control group and 46 patients with HBC. Compared with patients in the control group, patients in the HBC group presented significantly lower white blood cell counts; hemoglobin, platelet, and albumin levels; and cholinesterase and prothrombin times. Conversely, thrombin times; international normalized ratios; and glutamyl transpeptidase, aspartate aminotransferase, alkaline phosphatase, total bilirubin, direct bilirubin, indirect bilirubin, bile acid, and D-dimer levels were significantly elevated in the HBC group.
Comparative analysis of the gut microbiota between the HBC and control groups
The total length of the sequences read by both forward and reverse double-end sequencing was 500 bp, after which 24 bp molecular markers were subtracted, for a total of 476 bp. Sequences with double-end reads that were correctly spliced and between 382 bp and 442 bp in length were determined to be valid sequences. The average fragment length of all the samples was 410.68 bp.
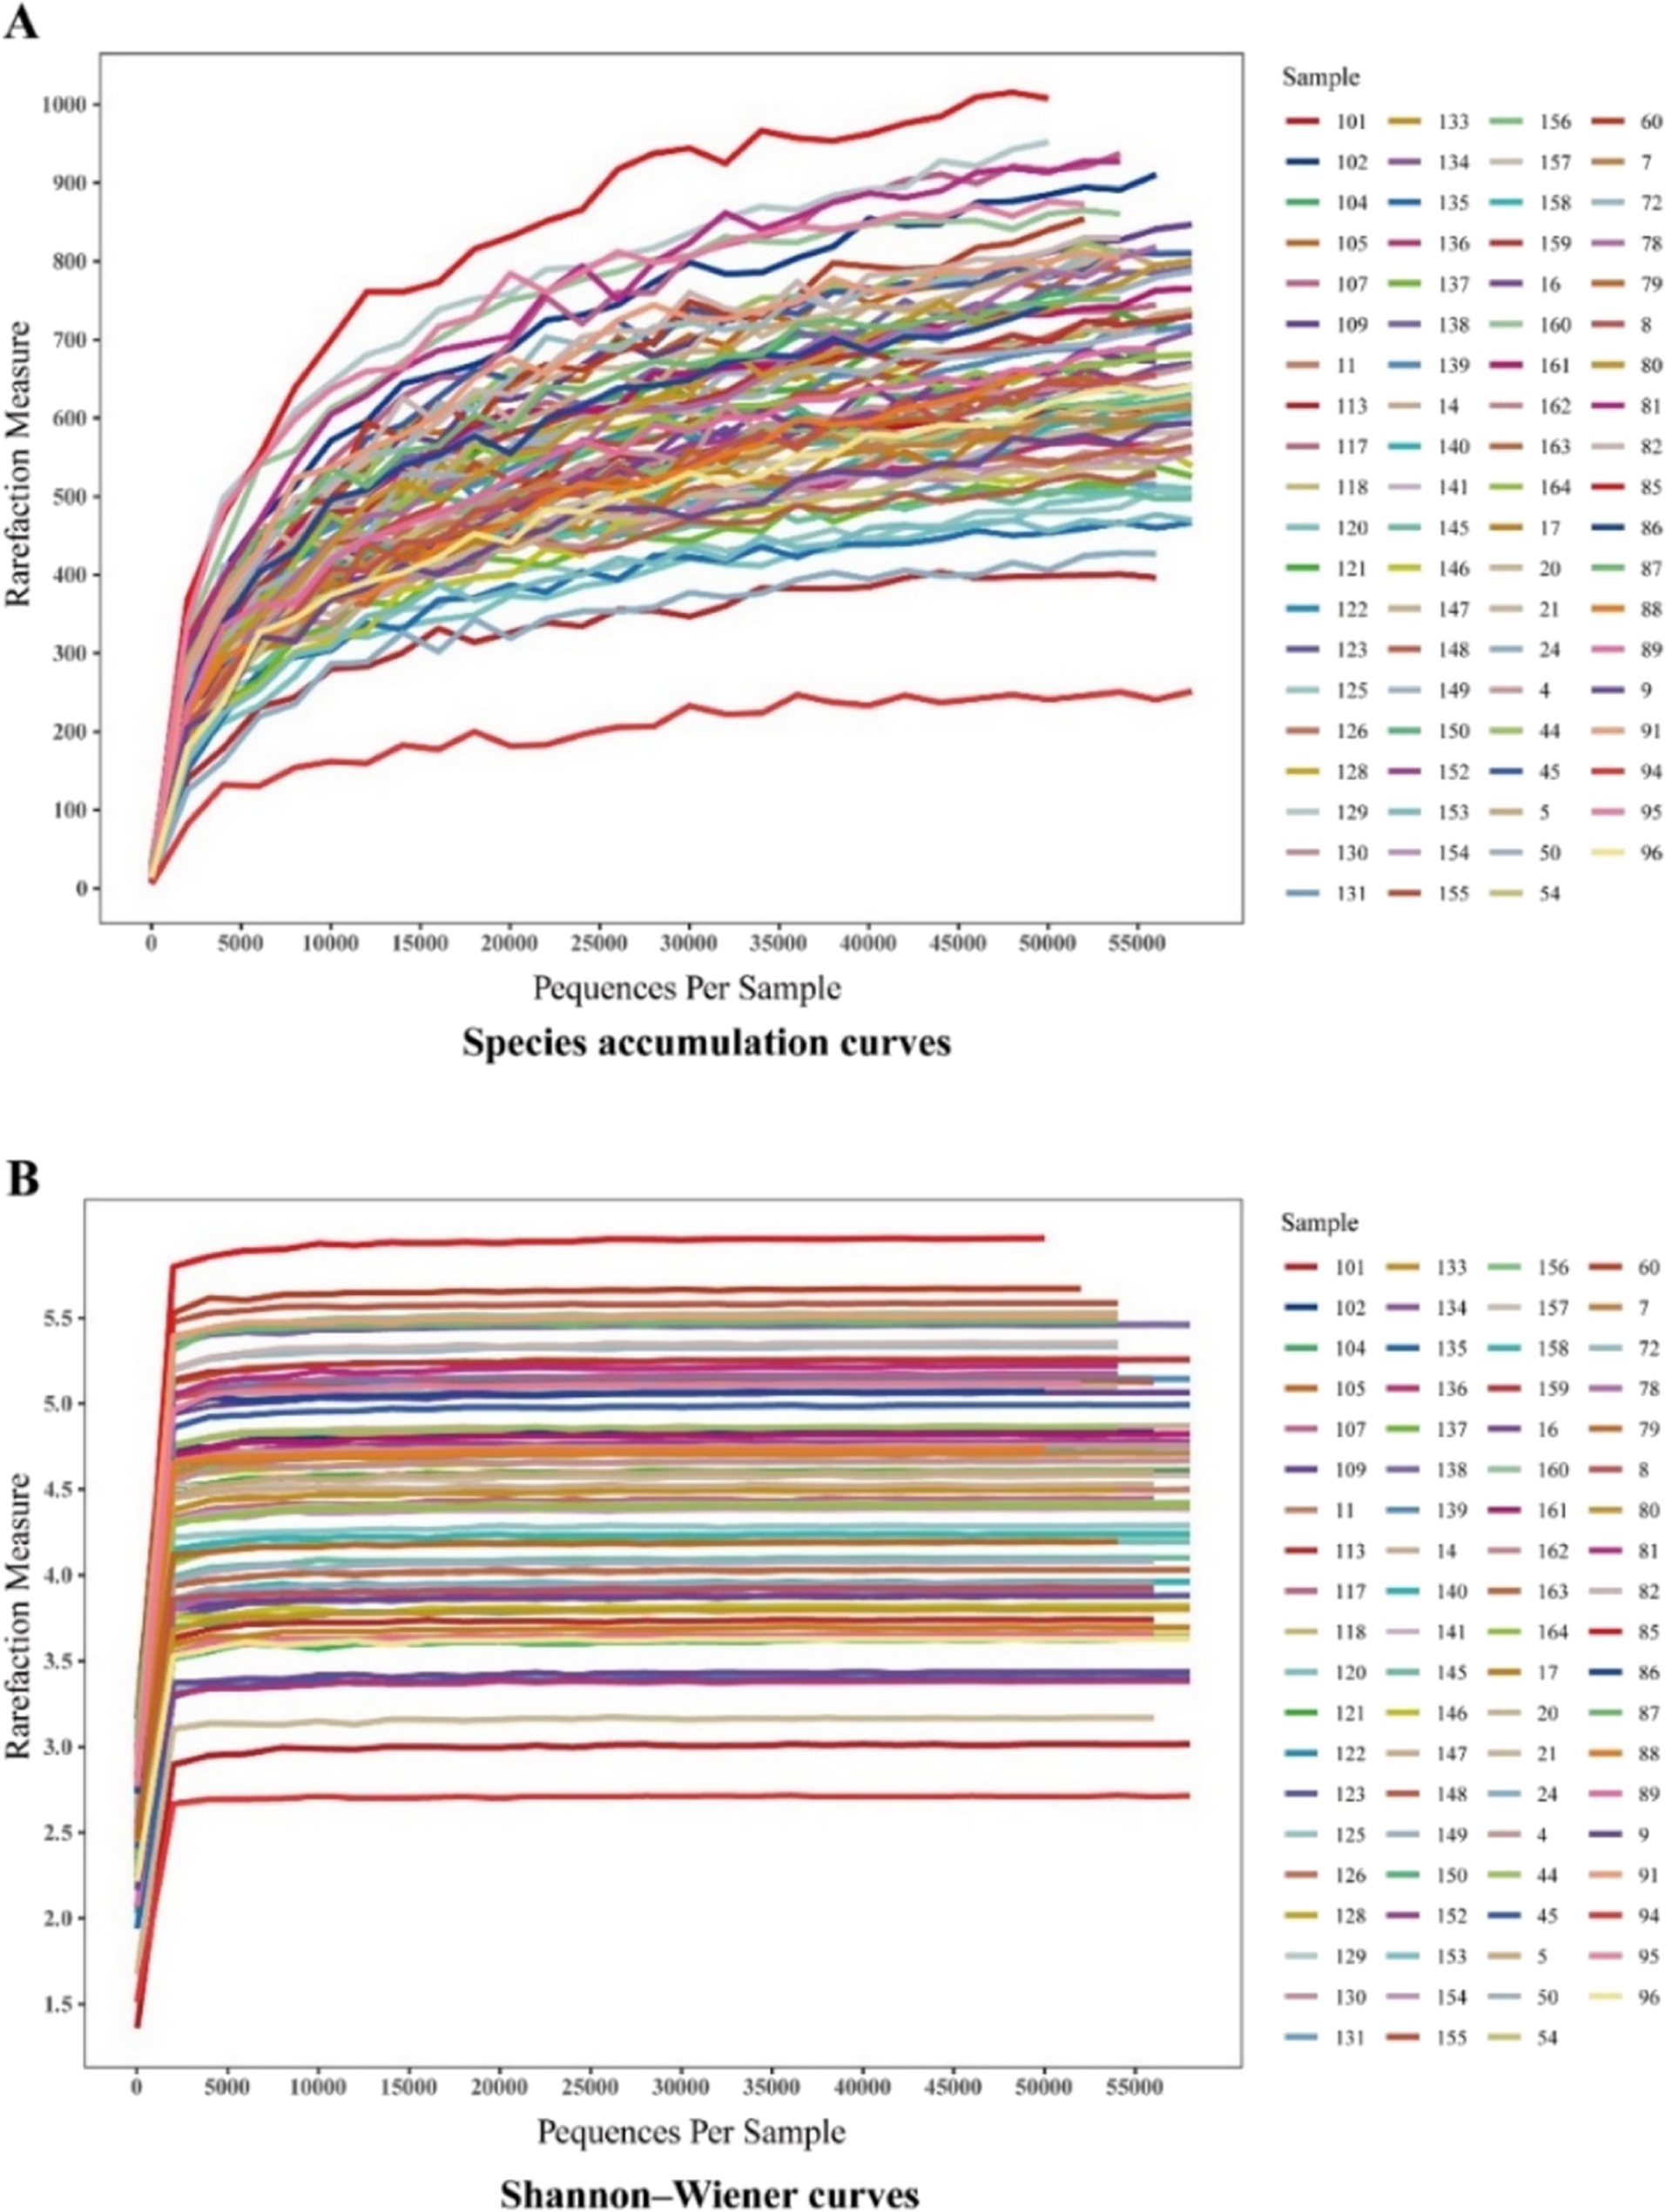
The species accumulation curves flattened or reached a plateau, suggesting the sequencing depth basically covered all the species in the sample, and no additional OTUs could be identified by increasing the sequencing data (Fig. 1A). The Shannon‒Wiener curves appeared to plateau, suggesting that the amount of sequencing data was large enough to reflect information about the vast majority of the microbial species in the sample (Fig. 1B).
In total, 17 phyla, 24 classes, 46 orders, 85 families, and 315 genera were identified. The entire sample contained 2,842 operational taxonomic units (OTUs), of which 1,892 were shared between the two groups. A total of 609 and 341 unique OTUs were identified in the control and HBC groups, respectively (Fig. 2A). The α diversity indices included the Ace, Chao1, Shannon and Simpson indices. The ACE and Chao1 indices are commonly used to assess species richness, and the Shannon and Simpson indices are used to measure species diversity. Analysis of α diversity revealed significantly reduced species richness in the experimental group, evidenced by decreased ACE (p < 0.05), and Chao1 (p < 0.05), indices compared with those in the control group. In contrast, the Simpson and Shannon diversity indices showed no statistically significant intergroup differences (p > 0.05) (Fig. 2B). Principal component analysis (PCA) of the β diversity (Fig. 2C) revealed differences in the composition of the gut microbiota between the two groups (p > 0.05).
Species accumulation curves (A) and Shannon‒Wiener curves (B)
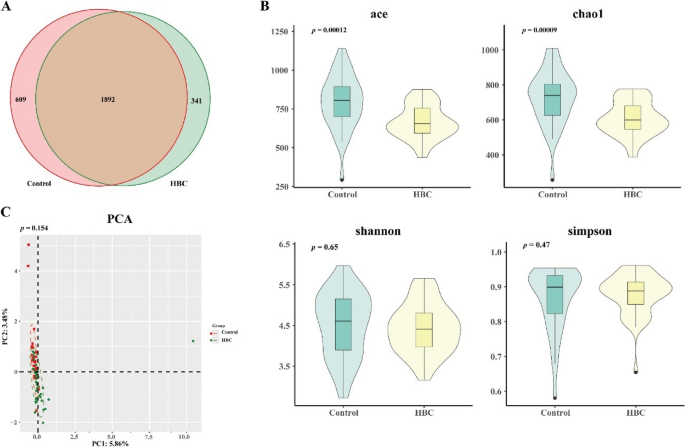
Characteristics of the gut microbiota in the control and HBC groups. A Overall, 2842 OTUs were identified in both groups. The control group had 2501 OTUs, and the HBC group had 2233 OTUs. B α diversity index analysis of the ACE p < 0.05), Chao1 (p < 0.05), Shannon p > 0.05) and Simpson (p > 0.05) indices. C βdiversity analysis via PCA (p > 0.05)
Compared with the HBC group, the HBC group presented significantly more Bacilli Lactobacillus, Prevotellaceae and Streptococcus and fewer Verrucomicrobiales, Bacteroides and Akkermansia (Table 2).
We used the linear discriminant analysis effect size (LEfSe) model to identify microbiota with differential abundances between the groups (Fig. 3). In the control group, Eggerthellaceae, Aeromonadaceae, Bacillaceae, Acidaminococcaceae and Bacteroidaceae were more abundant. Conversely, in the HBC group, Bacilli, Lactobacillales, Streptococcaceae, Veillonellaceae, Micrococcales, Enterobacteriales, Enterobacteriaceae, Micrococcaceae, Gammaproteobacteria and Aeromonadales presented relatively high relative abundances.
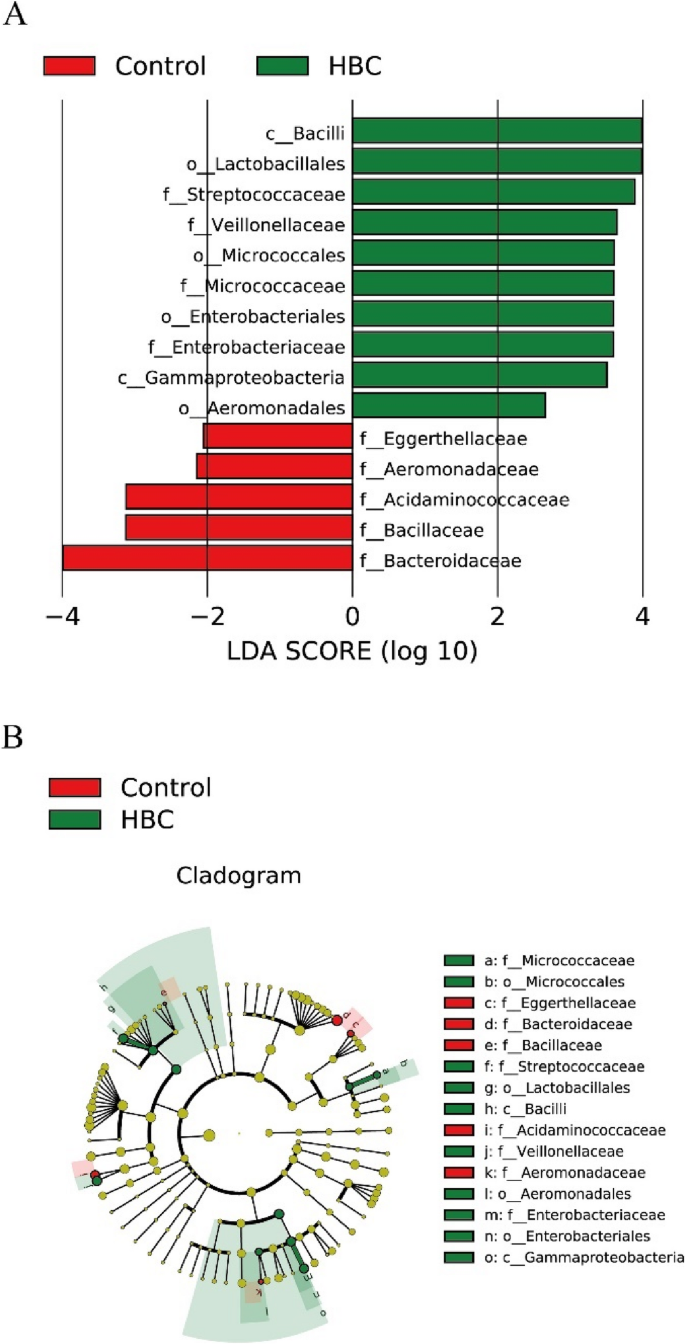
Comparison of groups of microflora differences via the LEfSe online tool. A Histogram of the linear discriminant analysis (LDA) scores for differentially abundant genera between the control and HBC groups. B Taxonomic cladogram for significant differences between the control and HBC groups
Comparative analysis of basic data between the BA-N and BA-H groups
Bile acid (BA) metabolism is also a key mediator of the liver‒gut axis [6]. We further divided the HBC group into two subgroups on the basis of BA: the BA-N group (n = 24) and the BA-H group (n = 22). The results revealed that as BA levels increased, the Child‒Pugh scores of patients also increased. The duration of antiviral therapy and viral load status were not significantly different between the two groups. Comparative analysis revealed that elevated BA levels were correlated with increased Child‒Pugh scores. Furthermore, progressive BA elevation was associated with increasing levels of WBC, RBC, CHE, ALB and PT%, alongside decreasing levels of ALP, DBIL, BA, PT, APTT, D-DI and INR, indicating progressive disease severity in HBC with BA elevation (Table 3).
Comparative analysis of the gut microbiota between the BA-N and BA-H groups
In the HBC group, 2,233 OTUs were identified, of which 1,805 were shared between the two groups. A total of 260 and 168 unique OTUs were identified in the BA-N and BA-H groups, respectively (Fig. 4A). The α diversity indices ACE (p > 0.05), Chao1 (p > 0.05), Shannon (p < 0.05) and Simpson (p < 0.05) suggested significant differences in the microbial species diversity of the α diversity between the two groups (Fig. 4B). PCA-based β diversity analysis (p < 0.05) revealed significant differences in the microbial community composition (Fig. 4C).
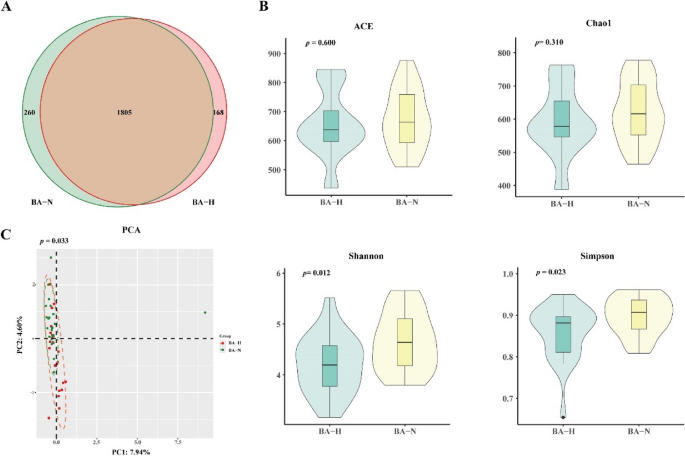
Characteristics of the gut microbiota in the BA-N and BA-H groups. (A) There were 2,219 OTUs in both groups. A total of 260 and 168 unique OTUs were identified in the BA-N and BA-H groups. (B) α diversity index analysis of the ACE (p > 0.05), Chao1 (p > 0.05), Shannon (p < 0.05) and Simpson (p < 0.05). (C) β diversity analysis via PCA (p < 0.05).
Compared with the BA-N group, the BA-H group presented increased Bacilli, Lactobacillales, Streptococcus, Veillonella and Enterobacteriaceae and decreased Clostridiales. Akkermansiaceae had a decrease in mean relative abundance, although this reduction did not reach statistical significance (p > 0.05) (Table 4).
Using the LEfSe model, we identified microbiota with differential abundances between the BA-N and BA-H groups (Fig. 5). Clostridia and Clostridiales were more abundant in the BA-N group, whereas Aeromonadaceae, Enterobacteriales, Streptococcaceae, Bacilli and Lactobacillales were more abundant in the BA-H group.
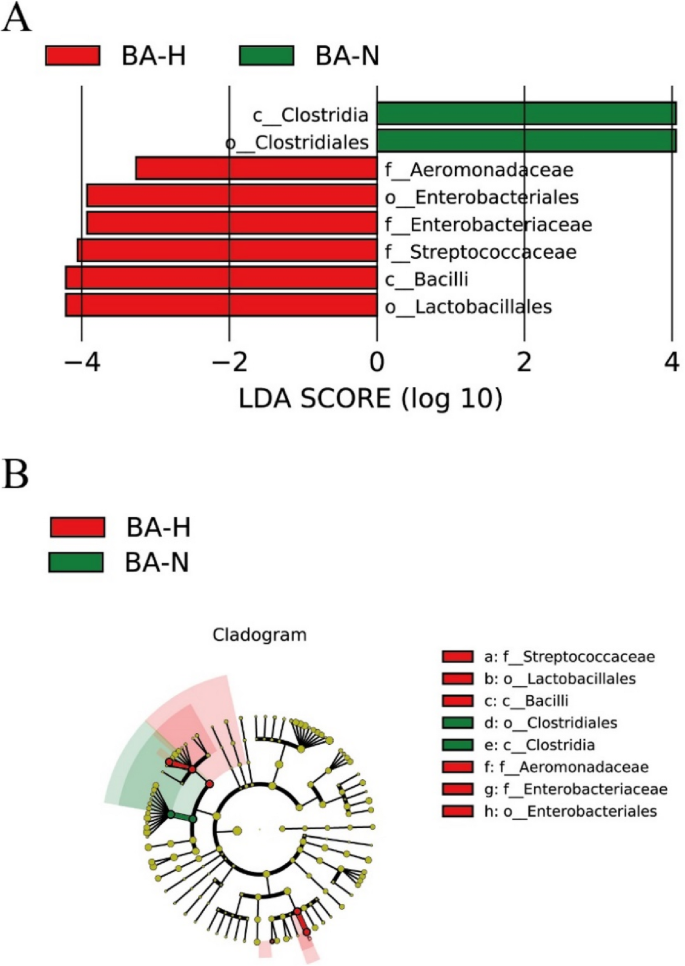
Comparison of differences in the microflora via the LEfSe online tool. A Histogram of the linear discriminant analysis (LDA) scores for differentially abundant genera between the BA-N and BN-H groups. B Taxonomic cladogram for significant differences between the BA-N and BN-H groups