Study design and participants
This study utilized data from the National Health and Nutrition Examination Survey (NHANES) conducted between 2003 and 2018. Ethical approval was obtained from the Centers for Disease Control and Prevention (CDC) Institutional Review Board. All participants provided written informed consent. The study was conducted in accordance with the Declaration of Helsinki and relevant guidelines and regulations. The methods used in this study were approved by the CDC Institutional Review Board, and the data used are de-identified and publicly accessible, thus exempting the study from further review.
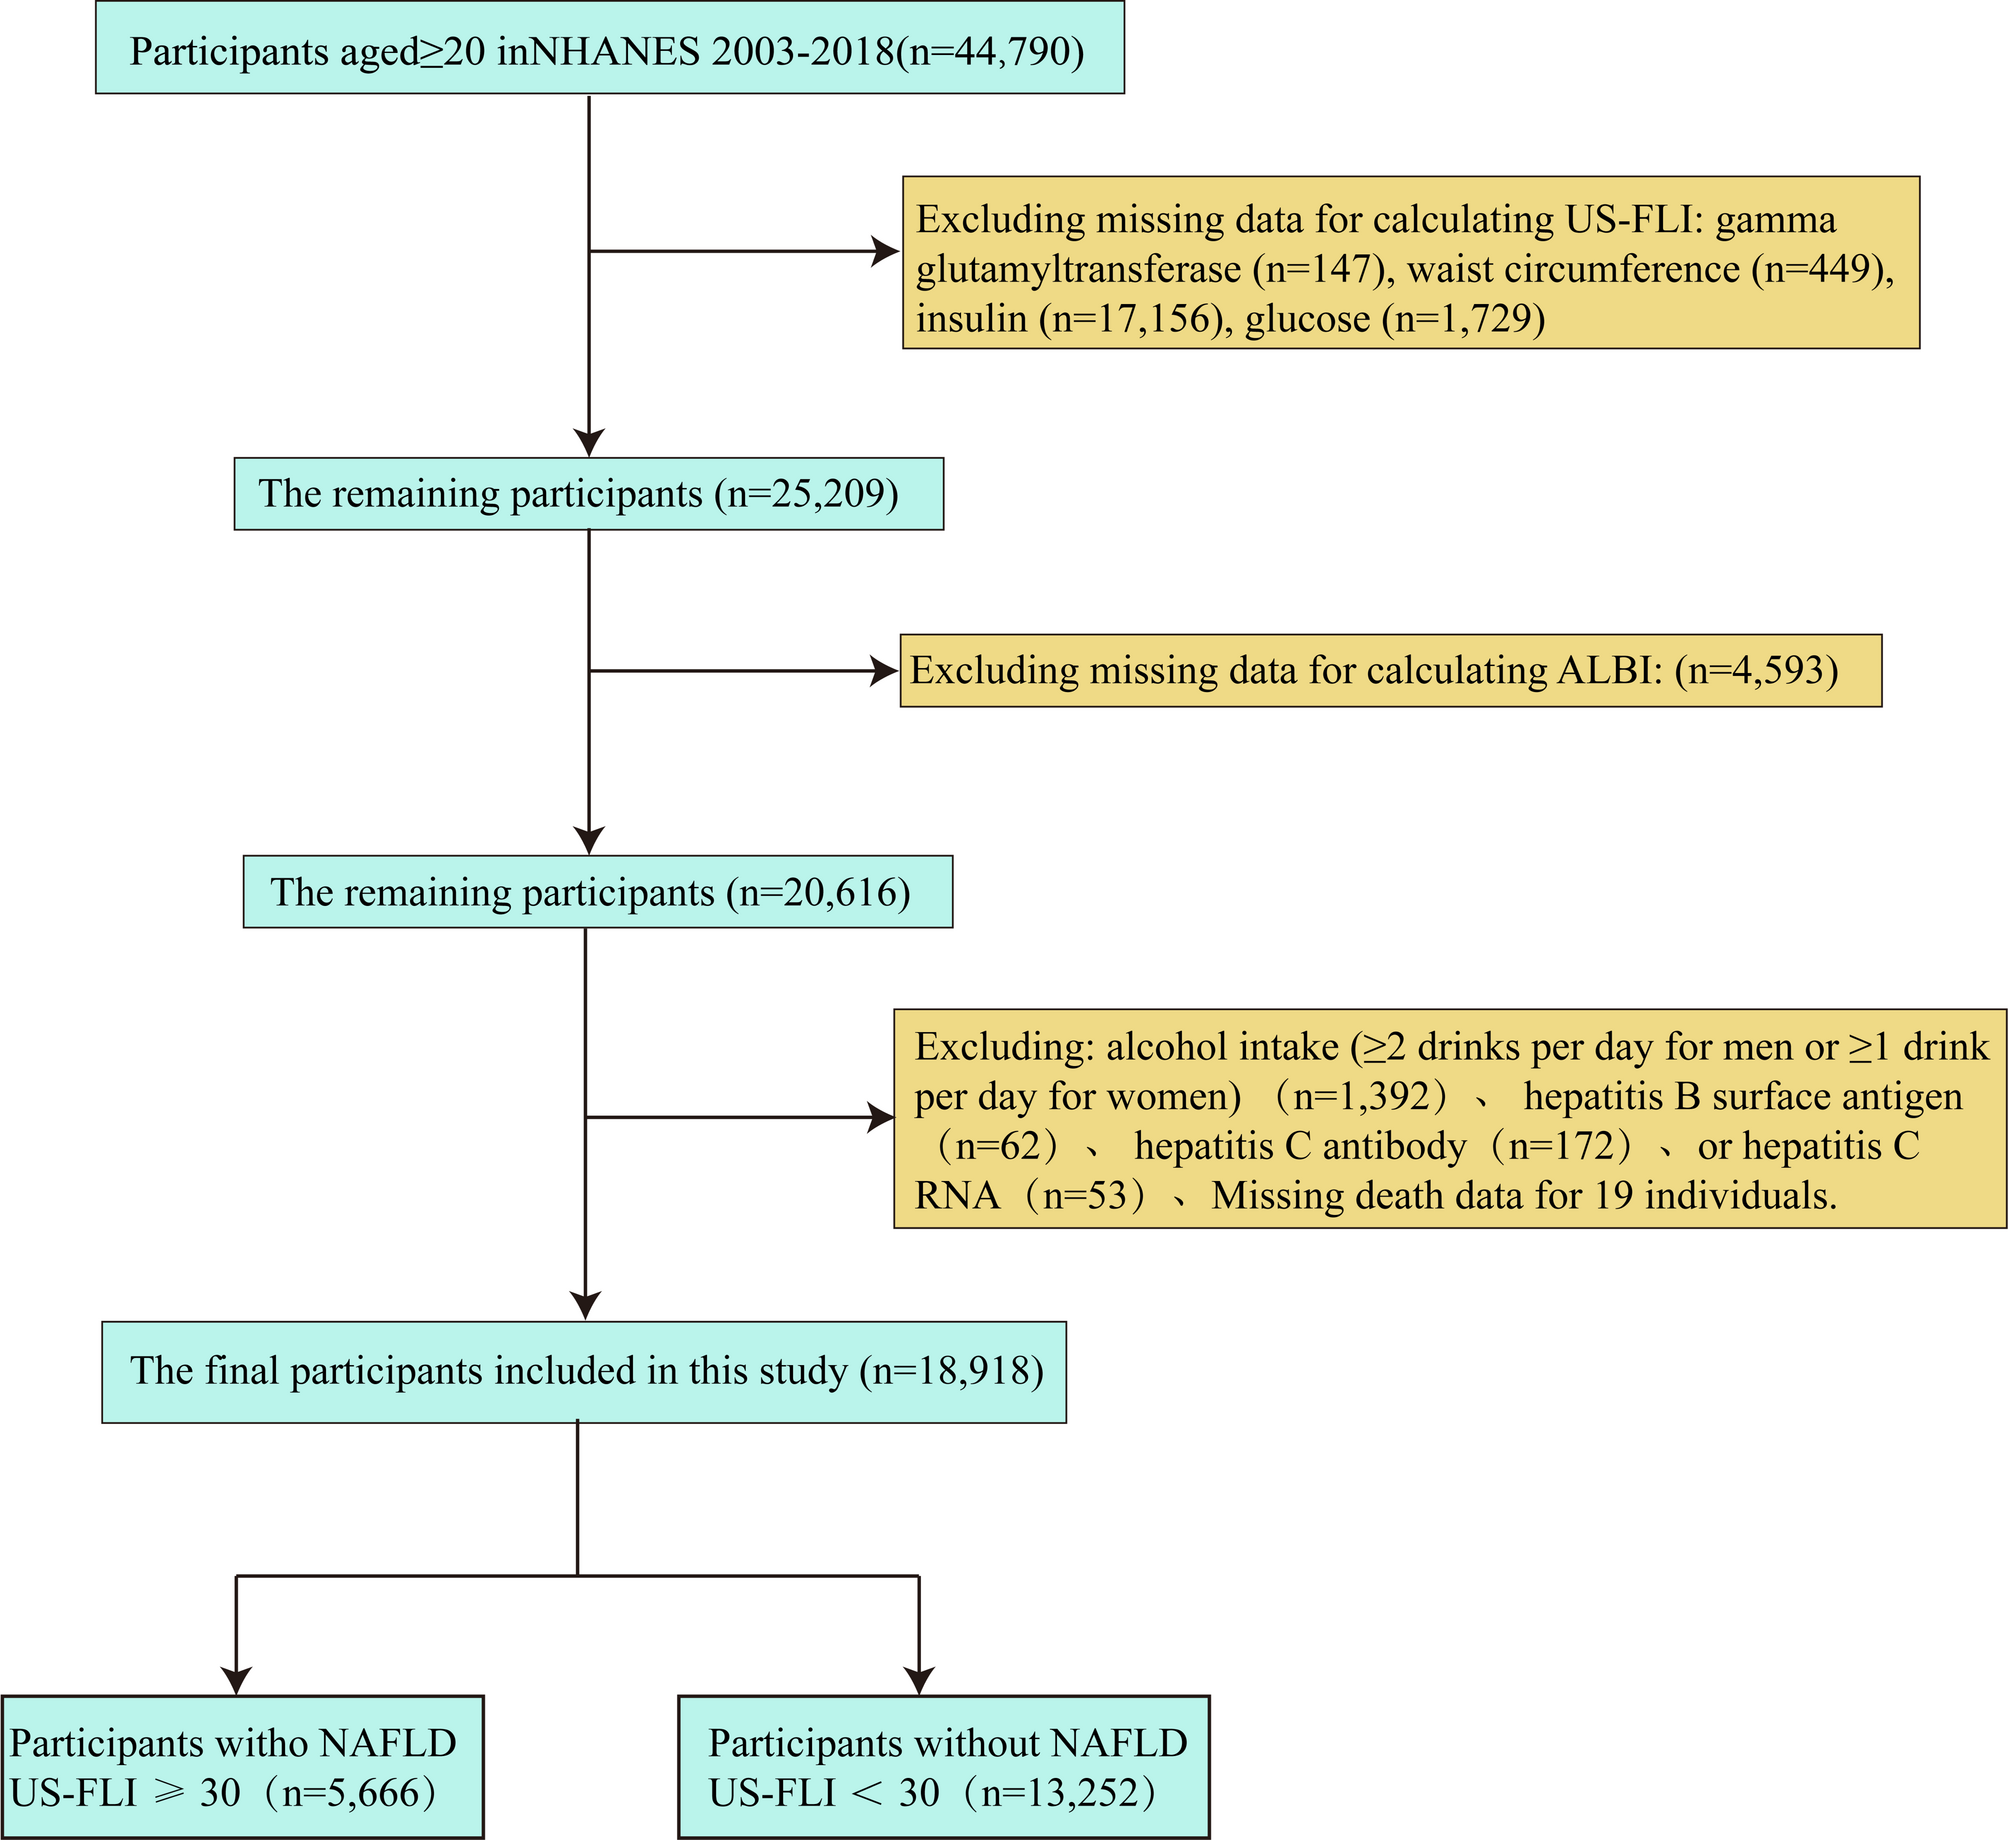
The CDC Institutional Review Board granted ethical clearance, and all participants provided written informed consent. To maintain data integrity, individuals lacking essential ALBI score elements, mortality data, or MAFLD diagnosis standards were not included. Missing data in the remaining variables were addressed using multiple imputation with chained equations (MICE), producing five complete datasets. The imputation models incorporated all analytical variables and auxiliary covariates to preserve underlying data structure and relationships. The specific criteria for inclusion and exclusion are detailed in Fig. 1.
Flow chart illustrating selection of the study population in NHANES from 2003 to 2018
ALBI formula and grouping
The ALBI score was calculated using the following formula: ALBI = 0.66×log[bilirubin(µmol/L)]−0.085×albumin(g/L), ALBI is divided into 3 grades, the score of ≤−2.60 is grade 1; the score of −2.60< score≤−1.39 is grade 2; the score of >−1.39 is grade 3 [23]. For the purposes of analysis in our cohort, we re-defined ALBI grades by tertiles (denoted Q1–Q3) rather than using the original grade 1–3 cutoffs, due to the limited number of patients falling into original grade 3. Specifically, these tertiles were defined as: group Q1 (ALBI scores < −2.96), group Q2 (ALBI scores − 2.96 ≤ ALBI < −2.70), and group Q3 (ALBI scores ≥ −2.70). It is important to note that ALBI is a reverse scale where more negative values indicate better liver function. Thus, lower (more negative) ALBI scores correspond to healthier liver status.
Definition of MAFLD
Fatty liver was defined using the US-FLI, which is calculated as follows: US-FLI = ey/(1 + ey) × 100, where y = − 0.8073 × non-Hispanic black + 0.3458×Mexican American + 0.0093×age + 0.6151 ×loge (gamma-glutamyl transferase) + 0.0249 × waist circumference + 1.1792 × loge (insulin) + 0.8242 × loge (glucose) − 14.7812. The variables for ‘non-Hispanic black’ and ‘Mexican American’ were coded as 1 if the participant identified with that ethnicity and 0 otherwise [22]. Fatty liver is defined by a US-FLI score of ≥ 30, as recommended [24, 25]. MAFLD is identified by a US-FLI score of ≥ 30, discounting other established reasons for chronic liver disease. These include viral hepatitis, indicated by positive markers such as hepatitis B surface antigen, hepatitis C antibody, or hepatitis C RNA, and significant alcohol consumption (≥ 2 drinks per day for men or ≥ 1 drink per day for women).
Covariates
Study participants were stratified into three age cohorts: young adults (20–39 years), middle-aged (40–59 years), and older adults (≥ 60 years). Racial/ethnic categorization included non-Hispanic White, non-Hispanic Black, Mexican American, and other self-identified groups. Educational status was categorized into three tiers: incomplete secondary education, secondary education completion (high school diploma or equivalent), and postsecondary attainment (associate degree or higher). Socioeconomic status was evaluated using poverty-income ratio (PIR) tertile: low-income (PIR < 1.0), middle-income (PIR 1.0–3.0), and high-income (PIR > 3.0).
Tobacco exposure history was classified as: lifetime nonsmokers (< 100 cigarettes consumed), active smokers (≥ 100 cigarettes with current use), and former smokers (≥ 100 cigarettes with cessation). Occupational physical activity levels were ascertained through validated questionnaires, dichotomized as engagement or non-engagement in moderate-intensity work-related tasks. Anthropometric evaluation utilized WHO-defined BMI categories: normal weight (< 25 kg/m²), overweight (25–29.9 kg/m²), and obese (≥ 30 kg/m²). Nutritional intake was quantified using 24-hour dietary recall-derived total caloric consumption. Comorbidity profiles incorporated self-reported diagnoses of hypertension, dyslipidemia, and diabetes mellitus.
Comprehensive biochemical profiling encompassed hemoglobin concentration, hepatic transaminases (ALT, AST), and lipid panel components—total cholesterol, triglycerides, LDL cholesterol, and HDL cholesterol. All laboratory parameters were measured using standardized automated assays following NHANES protocols.
Statistical analysis
Analytical procedures incorporated sampling weights to address the multistage probability sampling framework of NHANES. Event timing spanned from study entry to mortality occurrence, participant withdrawal, or administrative censoring (December 31, 2019), with temporal intervals quantified in monthly units. Continuous metrics are presented as weight-adjusted means (95% confidence intervals), while categorical variables are summarized as proportion estimates (95% confidence intervals). For comparative analyses, we used the Chi-square test (χ²) to compare observed and expected frequencies for categorical variables. For continuous variables, we employed the Mann–Whitney U test (U) for non-parametric comparisons and the T-test (T) for parametric comparisons. All statistical tests were two-tailed, with a significance level set at α = 0.05. Following NCHS guidelines to combine NHANES 2003–2018 data, each participant’s two-year sampling weight was divided by the eight included two-year cycles (spanning 16 years), generating a multi-year weight for the entire study period. For mortality analysis, we utilized NHANES-provided adjusted follow-up weights, linked to the public-use mortality file, which account for the original survey design and loss to follow-up.
Mortality risk stratification utilized the lowest ALBI tertile (Q1) as the reference category. Weighted multivariable proportional hazards regression frameworks assessed associations between ALBI gradients and all-cause mortality, generating hazard ratios (HRs) with corresponding confidence bounds. The proportional hazards assumption was verified using Schoenfeld residual tests, with global test p = 0.32 (ALBI-specific test p = 0.17), confirming compliance with the fundamental assumptions of the Cox model. Survival probability disparities across ALBI strata were graphically represented through Kaplan-Meier plots with weighted log-rank testing. Three sequential adjustment tiers were implemented: Minimally adjusted: Univariate analysis; Partially adjusted: Demographic covariates (sex, age, racial/ethnic group, educational attainment, socioeconomic status); Fully adjusted: Behavioral, anthropometric, and metabolic parameters (occupational activity, caloric intake, smoking history, BMI category, cardiometabolic comorbidities, hepatic enzymes, lipid profile) Nonparametric associations were investigated through penalized spline regression within generalized additive models. Threshold identification employed iterative segmented regression techniques when nonlinear patterns emerged, with piecewise Cox models applied to interval-specific risk estimation. Computational workflows were executed in R statistical environment (v4.3.1) and EmpowerStats analytical platform, applying two-tailed significance thresholds (α = 0.05) with multiplicity-unadjusted interpretation. Sensitivity analyses confirmed model robustness across alternative adjustment strategies.