The rise of MASLD and Metabolic Syndrome poses a significant health challenge. Understanding the interplay of sociodemographic, clinical, metabolic, lipid and blood pressure factors in predicting Metabolic Syndrome among MASLD patients is crucial for effective interventions. Our study confirms previous findings and identifies new correlates, indicating the need for continued investigation.(Fig. 2)
Sociodemographic characteristics and metabolic syndrome in participants
There were no differences between gender in case of metabolic syndrome, however Patients with metabolic syndrome had a significantly higher mean age of years compared to those without metabolic syndrome in which the older age is associated with an increased risk of developing metabolic syndrome in this MASLD whereas other cross-sectional study showed no difference according to age [23]. Dyslipidemia was significantly more prevalent among individuals with metabolic syndrome, consistent with findings from a 2021 study conducted in Southwest Ethiopia [24]. There is a higher rate of diabetic retinopathy complications in metabolic syndrome patients compared to those without. This suggests that in patients with Metabolic dysfunction-associated steatotic liver disease (MASLD), the presence of diabetic retinopathy is associated with an increased risk of having metabolic syndrome, however, comparing with other studies there were no significant difference in the prevalence of metabolic syndrome between diabetics with and without diabetic retinopathy [25, 26].Research from both basic and clinical studies indicates that obesity, hypertension, hyperglycemia, hyperlipidemia, and other components of metabolic syndrome are closely interconnected and play a significant role in the onset and progression of diabetic nephropathy [27].Our study confirms this finding in which diabetic nephropathy significantly higher in the metabolic syndrome group compared to the non-metabolic syndrome patients. Also, the presence of diabetic neuropathy is associated with an increased risk of having metabolic syndrome. Insulin use is significantly higher in those compared to the non-metabolic syndrome patients. This reflects the more advanced diabetic state and insulin resistance associated with metabolic syndrome in MASLD patients.
Similar to our study findings, previous Clinical Practice Guidelines have noted that ultrasound (US) has limited sensitivity and may not accurately detect steatosis when liver fat content is below 20%, or in patients with a high body mass index (BMI) [28].
Although dapagliflozin may have a modest influence on liver enzymes [29], our study didn’t detect changes in liver enzyme levels among MS or non-MS. This suggests the therapy likely did not have any significant interference of liver enzyme markers among participants.
There is a high probability of MASLD per the HSI was seen in patients with metabolic syndrome in comparison to patients without metabolic syndrome. The HSI finding suggests that a higher degree of hepatic steatosis, is linked to an increased prevalence of metabolic syndrome in this population which also has been supported by other study [23]. On the other hand, 40.7% of non-metabolic syndrome (non-MS) patients had a high probability of MASLD based on the Hepatic Steatosis Index (HSI) due to steatosis, insulin resistance, and one or more non-MS risk factors including dyslipidemia and increased BMI. In these patients, formal diagnostic criteria for metabolic syndrome were not met, despite the presence of known components of metabolic risk. These metabolic risk factors are not unique to individuals with the diagnosis of metabolic syndrome, and contribute to the probability of having MASLD as indicated by HSI score [30].
Biomarker level and metabolic syndrome in participants
Patients with metabolic syndrome tend to have an Increased levels of systolic and diastolic pressure in comparison with others without metabolic syndrome. A study was published in 2021 Explained that MetS Patients has insulin resistance as its main component.in which insulin has an anti-natriuretic effect, and this effect can be increased n MetS Patients, which in turn can lead to hypertension within the metabolic syndrome [31]. Patients with metabolic syndrome had significantly higher mean HbA1c levels compared to those without metabolic syndrome indicating poorer glycemic control in the metabolic syndrome group. In the other hand another study revealed that higher levels of HbA1c are associated with Increased prevalence of MetS [32]. Metabolic syndrome Patients has worst lipid profile and higher levels of TG, LDL, Cholesterol and lower HDL levels, participants with MetS Patients in another study also had increased TG and decreased HDL-C which suggests that the lipid disorder had a crucial role in the development of MetS in these patients [33]. Waist circumference and BMI were significantly higher in the metabolic syndrome patients. Stolzman’s study found that adolescents with higher BMI Levels had a greater incidence of MetS than those with normal BMI [34]. In our study, we identified two novel variables, years with complication (YWC) and years since diagnosis (YSD), as significant predictors. Statistical analysis revealed that both YWC and YSD were significantly associated with biomarker levels indicative of metabolic syndrome in participants, the duration of complications and the time since diagnosis are critical factors in predicting the likelihood of metabolic syndrome in MASLD patients.
Filling a gap in the existing literature where these variables had not been previously examined.
Multivariable analysis and MASLD model
Several studies discussed the relationship between MASLD and metabolic syndrome, Yongyuan Zhang et al. confirmed the bidirectional association between MASLD and metabolic syndrome [35]. Multiple studies establish the risk of having MASLD in patient with MetS, a study published in 2022 discovered that the odds of having any level of steatosis were higher in patients with MetS [36]. Indicating that Mets increases the risk of having MASLD. Whereas a few studies focused on the Mets risk in MASLD patients, which still not fully discussed. So, we conducted a comprehensive analysis to identify significant predictors for metabolic syndrome MASLD patients. Using advanced multivariable logistic regression analysis models, the results of the analysis showed that several demographics, clinical, and metabolic factors are associated with the risk of Metabolic Syndrome in the in MASLD patients. In MASLD there is a significantly higher level of blood pressure [37], it also has been found that.
hypertension consistently exhibited the strongest link with the development of major adverse liver outcomes [38]. However, our study has found that Elevated systolic blood pressure in patients with Metabolic Dysfunction-Associated Steatotic Liver Disease (MASLD) has been linked to an increased risk of developing metabolic syndrome. Also, the increased waist circumference, will increase the risk for MetS. A study published in 2019 discovered that an increased WC is attributed to increased risk of developing DM in prediabetes with MASLD [39].
Regarding lipid profile our study pointed that higher triglycerides, and lower HDL levels were significantly linked with the metabolic syndrome outcome in MASLD patients. Anna Boulouta et al., also found that higher triglyceride and, lower HDL levels are associated with Higher risk of metabolic unhealthiness in MASLD patients [40]. Our study states result after picking up all confounding factors and found that None of the other variable -age, diabetic complications, dyslipidemia, hepatic steatosis index, HbA1c, diastolic blood pressure, BMI, LDL, total cholesterol, years since diagnosis, and years with complications showed a significant association with the presence of metabolic syndrome following rigorous adjustment for confounding factors. However other study showed that Mets risk is much less common in younger patients [40].
Lack of association between HbA1c and metabolic syndrome
Our analysis showed that HbA1c was not significantly associated with the presence of metabolic syndrome (MetS) in patients with MASLD. This finding aligns with recent evidence by Wisniewski et al. (2024) [41], who demonstrated that while HbA1c correlates with MetS components in non-diabetic individuals, this relationship disappears once type 2 diabetes mellitus (T2DM) is established. In their cross-sectional study of over 8,000 adults, they found that none of the five classical MetS criteria, including waist circumference, blood pressure, HDL-C, triglycerides, or fasting glucose, remained significantly linked to HbA1c among diabetic participants. The authors attributed this to a “glycemic ceiling effect,” whereby sustained hyperglycemia in diabetic patients narrows HbA1c variability, thereby reducing its discriminatory power for detecting metabolic clustering. In our cohort, which included only patients with established T2DM, a similar ceiling phenomenon may have occurred. This suggests that while HbA1c is essential for monitoring glycemic control, it may not serve as a reliable independent predictor of MetS once chronic dysglycemia is already present.
The use of GAM allowed us to detect potential non-linear relationships between continuous predictors and MetS. Notably, GAM revealed non-linear associations for waist circumference, HDL, systolic blood pressure, and diastolic blood pressure. These patterns were further evaluated using a multivariable logistic regression model, and the direction of associations remained consistent. This confirms that the non-linear trends captured by the GAM were not spurious and supports the robustness of the findings.
However, it is important to interpret these results with caution. Due to the cross-sectional design of this study, causal inferences cannot be made. While the identified variables show strong statistical associations with MetS, temporality and directionality cannot be determined. Thus, the findings should be viewed as correlational, highlighting variables that may warrant further investigation as potential predictors in future longitudinal or interventional studies. The model was developed in accordance with the TRIPOD (Transparent Reporting of a Multivariable Prediction Model for Individual Prognosis or Diagnosis) guidelines and demonstrated good discrimination and calibration (Hosmer–Lemeshow). The use of variance inflation factors (VIFs) also confirmed no significant multicollinearity between included predictors.
Our findings contribute to the growing body of literature on the metabolic burden in MASLD and offer a clinically relevant set of variables that may inform risk stratification strategies. Early identification of patients at risk of developing MetS within the MASLD population is essential, given its association with cardiovascular events, disease progression, and poor outcomes. ROC Curve for the Performance of Predictors of Metabolic Syndrome in Metabolic dysfunction-associated steatotic liver disease (MASLD) showed an Area Under the Curve (AUC) of 0.9506, which is very close to 1.0, indicating an outstanding excellent discriminative ability of systolic blood pressure, WC, TG, and HDL to predict the risk of Mets in MASLD patients, and they can very accurately distinguish between MASLD patients with and without the MetS condition.
Limitations
Several limitations merit consideration. First, the cross-sectional nature of the study limits our ability to infer temporal or causal relationships between predictors and metabolic syndrome. Second, despite incorporating a broad spectrum of clinical and biochemical variables, the possibility of residual confounding from unmeasured factors cannot be excluded. Third, as all participants were drawn from a single regional population, the generalizability of our findings to other settings or ethnic groups may be restricted. Fourth, although cardiovascular complications are of high clinical relevance in individuals with T2DM and are mechanistically intertwined with both MASLD and MetS, these could not be analyzed in our study due to non-standardized or incomplete cardiology documentation across the medical records reviewed. We therefore acknowledge this as a limitation and recommend that future prospective research include structured cardiovascular assessment to better characterize this relationship.
Conclusion and future directions
our study stated the significant predictors for metabolic syndrome using advanced statistical methods. It shows that higher systolic blood pressure, larger waist circumference, elevated triglycerides, and lower HDL cholesterol levels are independently associated with metabolic syndrome in MASLD patients. These associations were confirmed through multivariable logistic regression analysis, which accounted for potential confounding factors.
Future research should validate these findings in larger and more diverse populations and explore the underlying mechanisms of these predictors. Longitudinal studies could offer insights into causal relationships. Given the high accuracy of the GAM analysis, future studies should utilize similar advanced models to uncover non-linear relationships in clinical data, improving risk assessment tools and patient outcomes in MASLD and related conditions.
The results of the multivariate logistic regression analysis in Table 5 show that several demographics, clinical, and metabolic factors are associated with the risk of Metabolic Syndrome in the study population. The results showed that higher systolic blood pressure (adjusted OR = 1.000427, p < 0.0001) and larger waist circumference (adjusted OR = 1.001517, p < 0.0001) were both independently associated with an increased odds of having metabolic syndrome. Additionally, higher triglyceride levels (adjusted OR = 1.064834, p < 0.0001) were linked to greater odds of metabolic syndrome, while lower HDL cholesterol levels (adjusted OR = 0.998595, p = 0.003) were associated with increased odds.
The other variables, including age, diabetic complications, dyslipidemia, hepatic steatosis index, HbA1c, diastolic blood pressure, BMI, LDL, total cholesterol, years since diagnosis, and years with complications, were not significantly associated with the outcome of metabolic syndrome after adjusting for confounding factors. The Hosmer-Lemeshow test, with a chi-square statistic of 4.40 and a p-value of 0.8192, suggests that the logistic regression model fits the data well and provides an adequate representation of the observed and expected outcomes. The variance inflation factor (VIF) of 2.18 indicates that multicollinearity is not a severe issue in the regression model.
The generalized additive model analysis indicates that nonlinearity in the model is statistically significant, with a total gain (nonlinearity chi-square) of 116.313 and a p-value of 0.0000.
The generalized additive model (GAM) analysis revealed that four variables were statistically significant predictors of the binary outcome variable: waist circumference (p < 0.0001), HDL cholesterol (p < 0.0001), systolic blood pressure (p = 0.0003), and diastolic blood pressure (p < 0.0001). To further examine the potential non-linear relationships between these predictors and the outcome, we squared the values of these four variables and included them in a logistic regression model.
The results of the logistic regression confirmed that the direction of the relationships between the linear and non-linear terms for each of these four variables was consistent. This suggests that the non-linear effects of waist circumference, HDL, systolic blood pressure, and diastolic blood pressure were adequately captured in the original GAM analysis. By verifying the consistent directionality of the linear and non-linear relationships, we can have confidence that the GAM results provide an accurate representation of the underlying associations.
This approach allowed us to control for potential non-linear effects and obtain reliable estimates of the influences of these waist circumference, HDL, systolic blood pressure, and diastolic blood pressure factors on the binary outcome of interest in this population of patients with Metabolic Dysfunction-Associated Fatty Liver Disease.
Table 5 Association between predictor factors for metabolic syndrome outcome in metabolic dysfunction-associated steatotic liver disease (MASLD): A MASLD model The results of the multivariate logistic regression analysis in Table 5 show that several demographics, clinical, and metabolic factors are associated with the risk of Metabolic Syndrome in the study population. The results showed that higher systolic blood pressure (adjusted OR = 1.000427, p < 0.0001) and larger waist circumference (adjusted OR = 1.001517, p < 0.0001) were both independently associated with an increased odds of having metabolic syndrome. Additionally, higher triglyceride levels (adjusted OR = 1.064834, p < 0.0001) were linked to greater odds of metabolic syndrome, while lower HDL cholesterol levels (adjusted OR = 0.998595, p = 0.003) were associated with increased odds
The other variables, including age, diabetic complications, dyslipidemia, hepatic steatosis index, HbA1c, diastolic blood pressure, BMI, LDL, total cholesterol, years since diagnosis, and years with complications, were not significantly associated with the outcome of metabolic syndrome after adjusting for confounding factors. The Hosmer-Lemeshow test, with a chi-square statistic of 4.40 and a p-value of 0.8192, suggests that the logistic regression model fits the data well and provides an adequate representation of the observed and expected outcomes. The variance inflation factor (VIF) of 2.18 indicates that multicollinearity is not a severe issue in the regression model
The generalized additive model analysis indicates that nonlinearity in the model is statistically significant, with a total gain (nonlinearity chi-square) of 116.313 and a p-value of 0.0000
The generalized additive model (GAM) analysis revealed that four variables were statistically significant predictors of the binary outcome variable: waist circumference (p < 0.0001), HDL cholesterol (p < 0.0001), systolic blood pressure (p = 0.0003), and diastolic blood pressure (p < 0.0001). To further examine the potential non-linear relationships between these predictors and the outcome, we squared the values of these four variables and included them in a logistic regression model
The results of the logistic regression confirmed that the direction of the relationships between the linear and non-linear terms for each of these four variables was consistent. This suggests that the non-linear effects of waist circumference, HDL, systolic blood pressure, and diastolic blood pressure were adequately captured in the original GAM analysis. By verifying the consistent directionality of the linear and non-linear relationships, we can have confidence that the GAM results provide an accurate representation of the underlying associations
This approach allowed us to control for potential non-linear effects and obtain reliable estimates of the influences of these waist circumference, HDL, systolic blood pressure, and diastolic blood pressure factors on the binary outcome of interest in this population of patients with Metabolic Dysfunction-Associated Fatty Liver Disease
Table 1 presents that the study included 314 participants, with 56.4% male and 43.6% female. Most resided in cities (57.3%), followed by villages (40.1%) and camps (2.5%). MASLD was detected in 76.4% by ultrasound, with 32.8% mild, 40.1% moderate, and 3.5% severe cases. Diabetic complications included retinopathy (26.8%), nephropathy (15.0%), and neuropathy (26.1%). Dyslipidemia was present in 41.1%, and 31.2% were current smokers. Alcohol use was rare (0.3%), and no participants reported a family history of liver disease. HSI indicated a high probability of MASLD in 91.7%. Regarding treatment, 24.8% used insulin, 27.1% glimepiride, 8.9% sitagliptin, 6.4% dapagliflozin, and 82.2% were on metformin.
Table 2 show Patients with metabolic syndrome had a significantly higher mean age of 57.25 ± 10.08 years compared to those without metabolic syndrome at 53.35 ± 10.24 years (p = 0.001), suggesting that older age is associated with an increased risk of developing metabolic syndrome in this MASLD population. The prevalence of diabetic retinopathy (34.7% vs. 38.5%, p = 0.001), diabetic nephropathy (10.2% vs. 4.8%, p = 0.027), and diabetic neuropathy (17.2% vs. 8.9%, p = 0.010) was significantly higher in the metabolic syndrome group compared to the non-metabolic syndrome group, indicating that the presence of diabetic microvascular complications is linked to a higher likelihood of also having metabolic syndrome in MASLD patients. Dyslipidemia was much more common in the metabolic syndrome group, with 34.4% having dyslipidemia compared to only 6.7% in the non-metabolic syndrome group (p = 0.001), a strong association that aligns with the known components of metabolic syndrome, including atherogenic dyslipidemia. A high probability of MASLD per the HSI was seen in 50.96% of the metabolic syndrome group compared to 40.76% in the non-metabolic syndrome group (p = 0.007), suggesting that a higher degree of hepatic steatosis, as indicated by a high HSI, is linked to an increased prevalence of metabolic syndrome in this population. Insulin use was significantly higher in the metabolic syndrome group at 18.2% versus 6.7% in the non-metabolic syndrome group (p < 0.001), likely reflecting the more advanced diabetic state and insulin resistance associated with metabolic syndrome in MASLD patients.
Table 3 show Patients with metabolic syndrome had significantly higher mean HbA1c levels of 8.34% ± 1.32% compared to 7.92% ± 1.22% in those without metabolic syndrome (p = 0.004), indicating poorer glycemic control in the metabolic syndrome group. Systolic and diastolic blood pressure were also significantly elevated in the metabolic syndrome group, with median systolic BP of 136 mmHg (IQR: 130–144 mmHg) versus 125 mmHg (IQR: 118–133 mmHg) in the non-metabolic syndrome group (p < 0.001), and median diastolic BP of 86 mmHg (IQR: 82–92 mmHg) versus 82 mmHg (IQR: 76–85 mmHg) (p < 0.001). Waist circumference and BMI were significantly higher in the metabolic syndrome group, with mean values of 94.13 ± 12.10 cm and 31.17 ± 5.29, respectively, compared to 85.20 ± 6.83 cm and 27.83 ± 3.45 in the non-metabolic syndrome group (p = 0.001 for both). Lipid profiles were worse in the metabolic syndrome cohort, with higher mean LDL (129.62 ± 22.97 mg/dL vs. 105.69 ± 15.21 mg/dL, p = 0.001), lower HDL (40.69 ± 7.68 mg/dL vs. 49.76 ± 5.91 mg/dL, p < 0.001), and higher triglycerides (161.71 ± 32.83 mg/dL vs. 138.58 ± 14.33 mg/dL, p < 0.001).
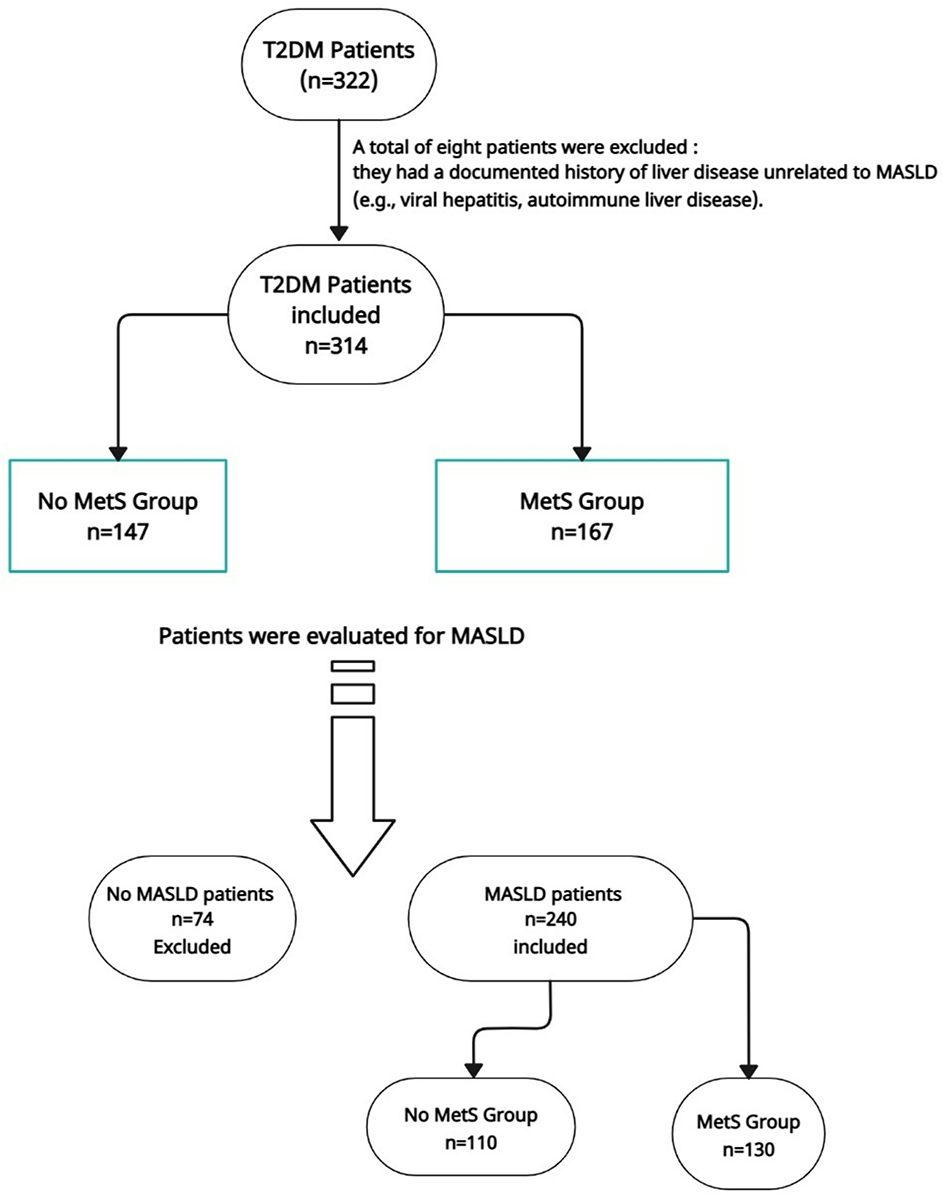
Flowchart (MetS: Metabolic Syndrome;MASLD: Metabolic Dysfunction–Associated Steatotic Liver Disease; T2DM: Type 2 Diabetes Mellitus)
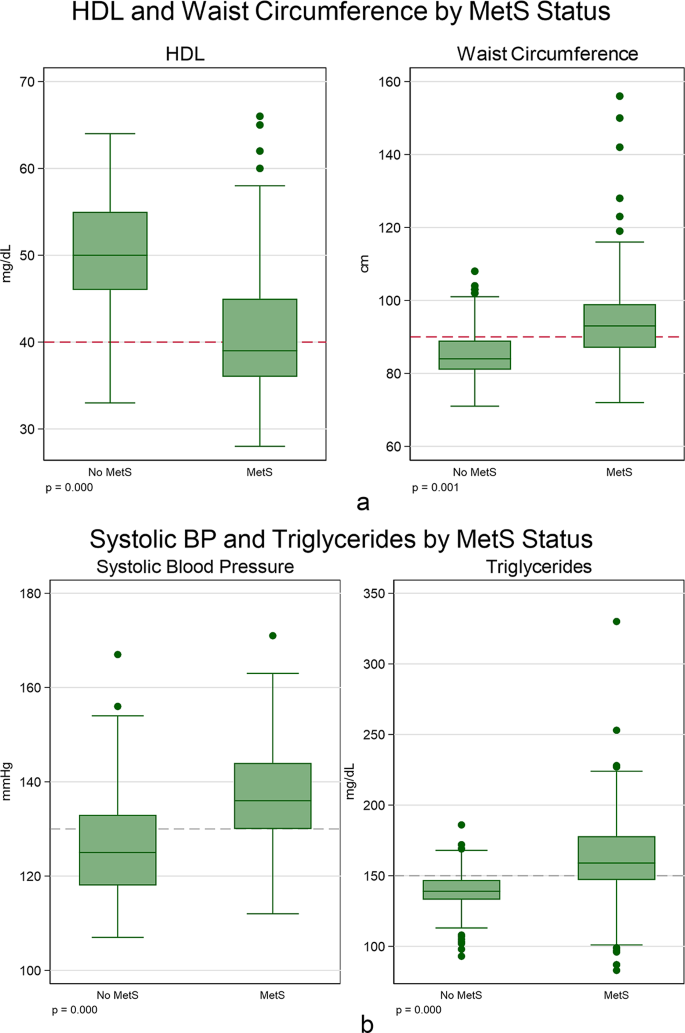
(A and B): Box plots for HDL, Waist Circumference, Systolic BP, and Waist Circumference accordingly to the presence Metabolic Syndrome in Metabolic dysfunction-associated steatotic liver disease (MASLD).Box plots for HDL and Waist Circumference accordingly to the presence of Metabolic Syndrome in Metabolic dysfunction-associated steatotic liver disease (MASLD).
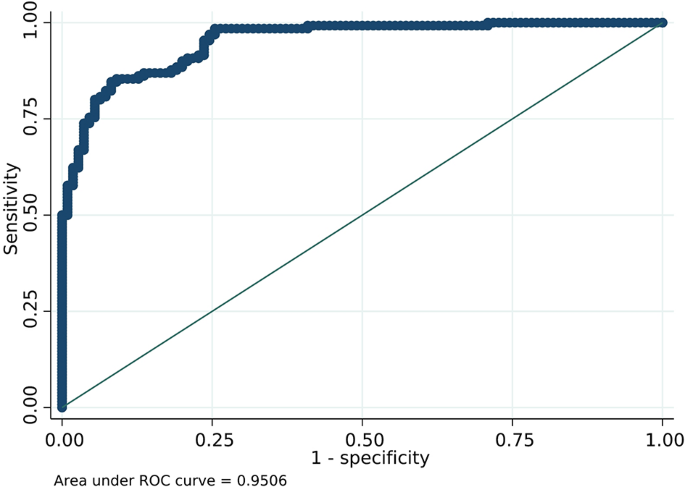
Receiver Operating Characteristic (ROC) Curve for the Performance of Predictors of Metabolic Syndrome in Metabolic dysfunction-associated steatotic liver disease (MASLD).in MASLD Model
Table 4 presents a comparison of clinical and biochemical characteristics between MASLD patients with and without metabolic syndrome based on the NCEP ATP III criteria. Patients with MetS were significantly older (57.6 ± 10.1 vs. 54.5 ± 9.5 years, p = 0.016). The prevalence of diabetic retinopathy and dyslipidemia was significantly higher in the MetS group (p = 0.002 and p < 0.001, respectively). A greater proportion of patients in the MetS group had a high probability of MASLD according to the Hepatic Steatosis Index (HSI) (p = 0.014). MetS patients also demonstrated significantly higher values in several cardiometabolic indicators, including systolic and diastolic blood pressure, waist circumference, BMI, LDL, triglycerides, total cholesterol, and HbA1c. In contrast, HDL levels were significantly lower among MetS patients (p < 0.001 for most comparisons). Furthermore, the MetS group had longer disease duration (YSD) and more years with complications (YWC) (p < 0.001 for both), suggesting more advanced disease and comorbidity burden.