Data source and population
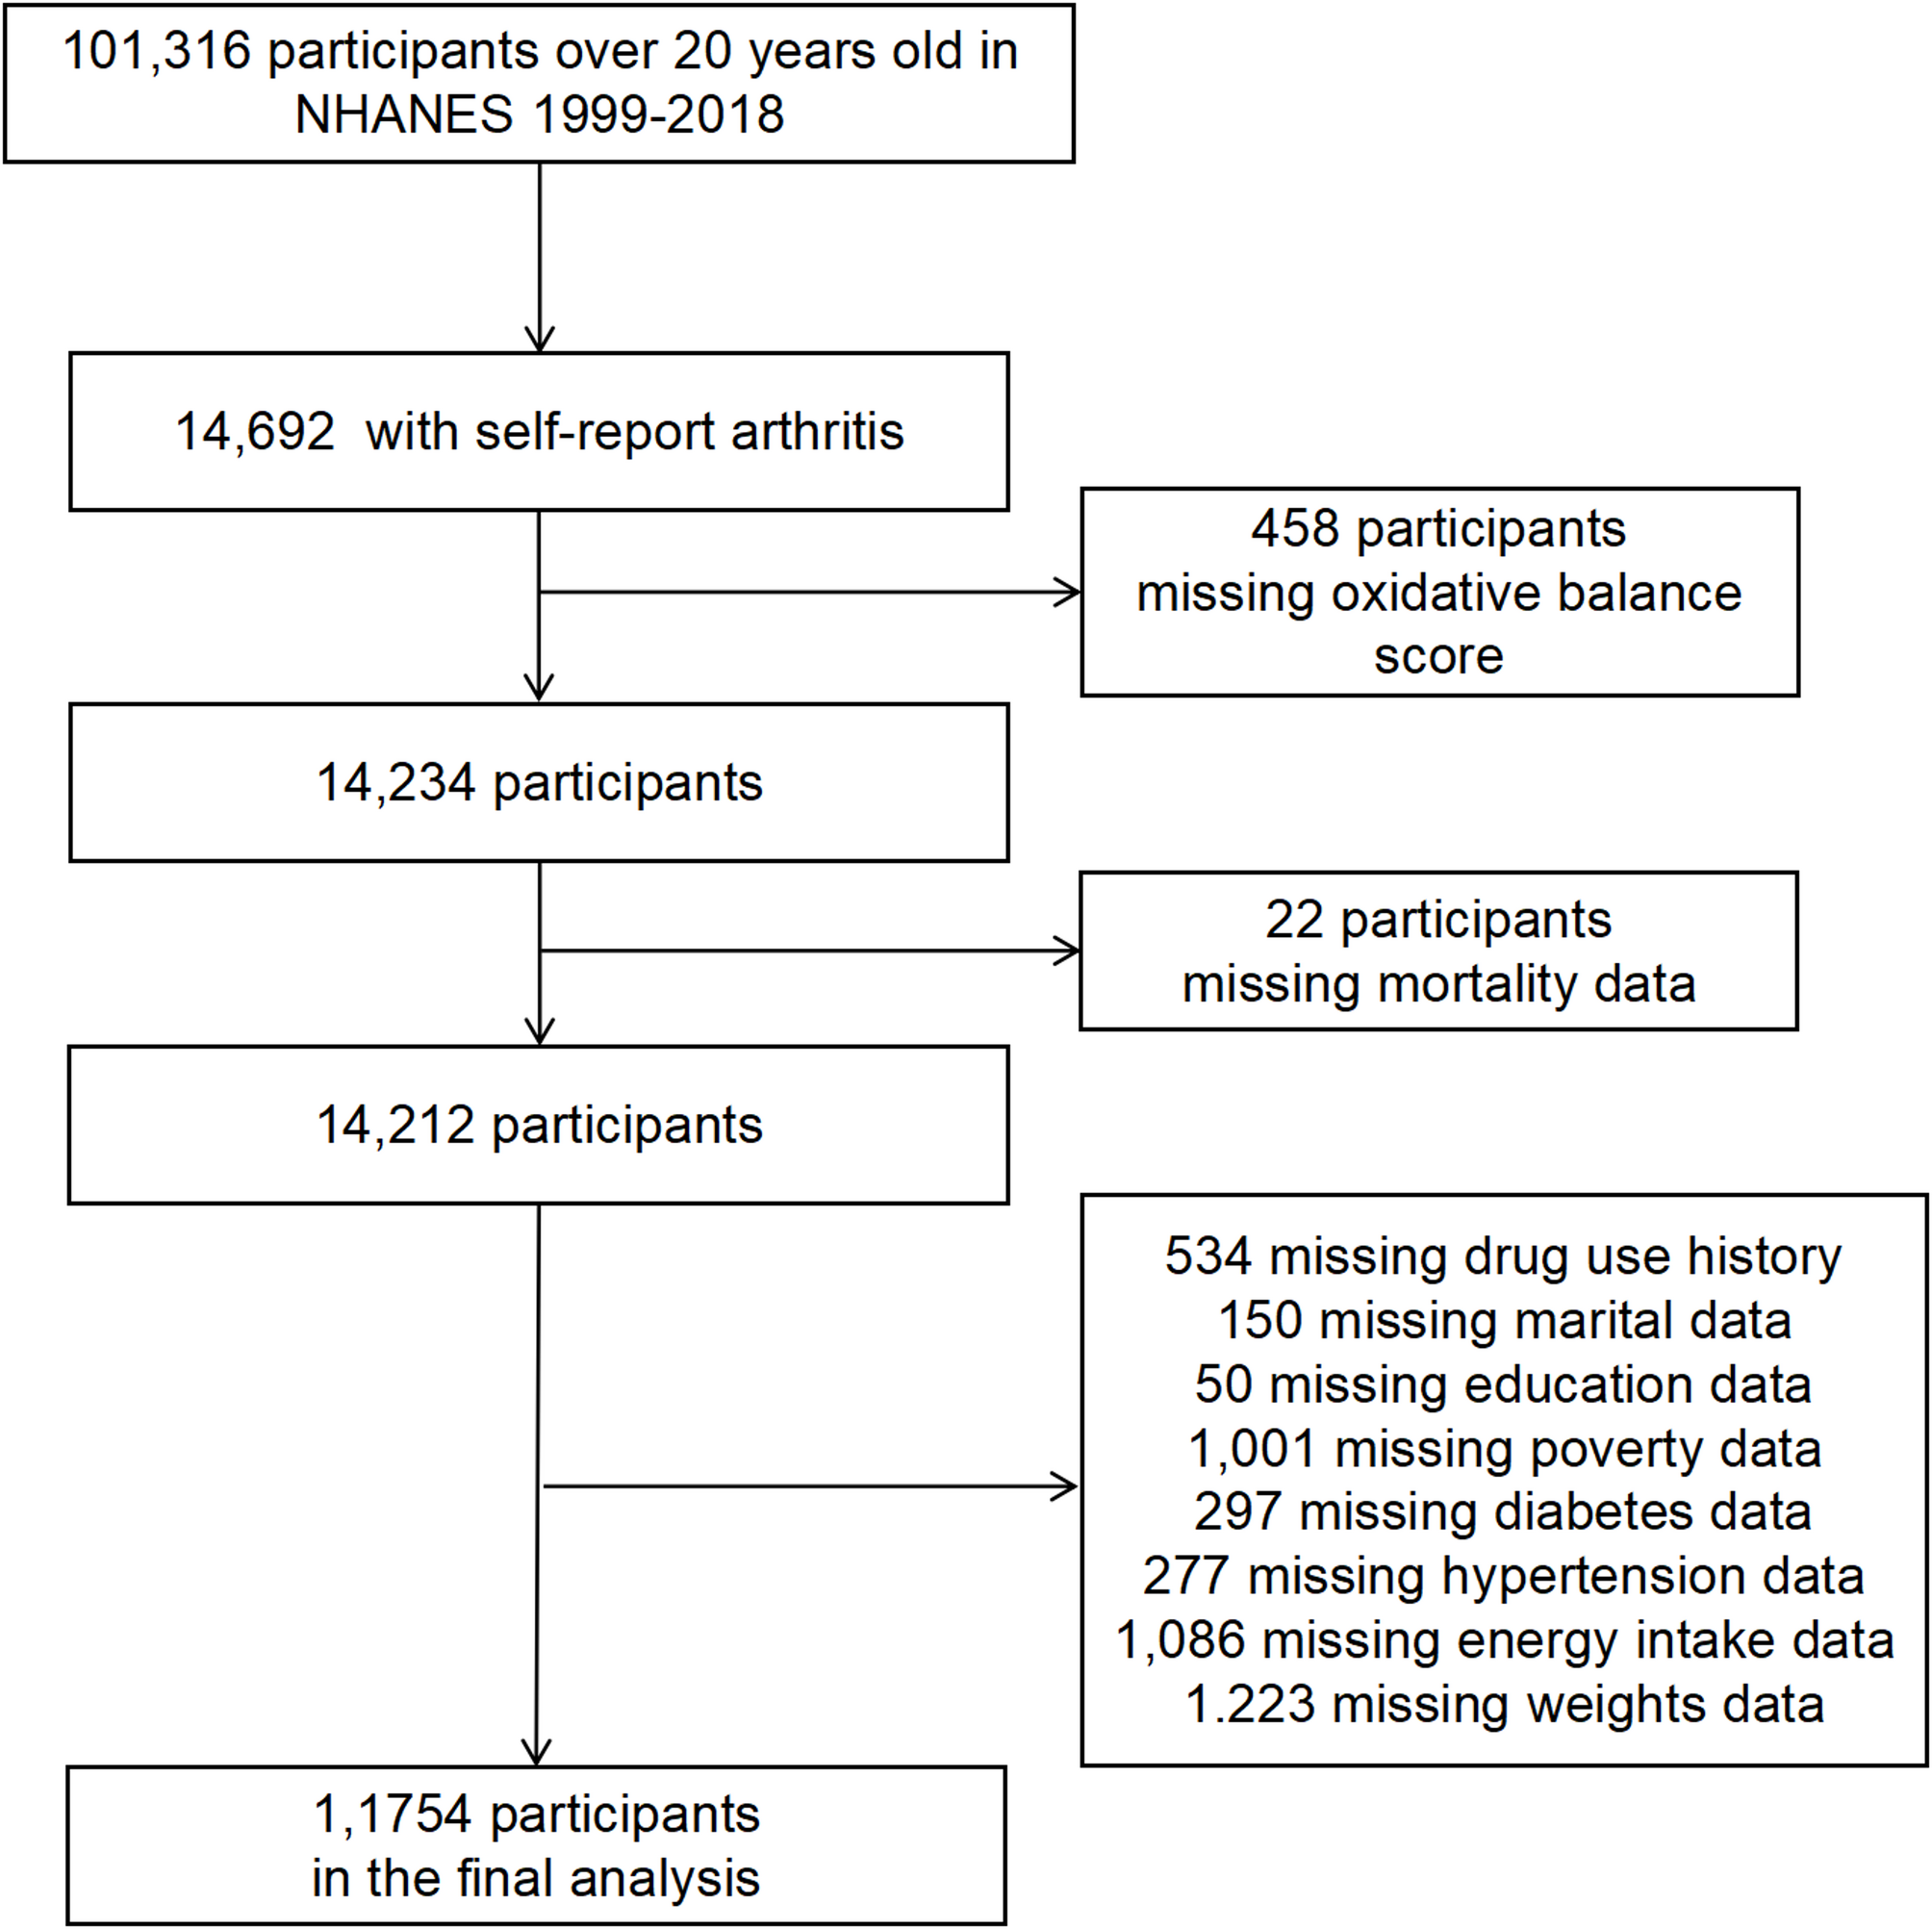
NHANES is a nationally representative survey of U.S. civilians, employing stratified multistage probability sampling. The NHANES protocols received approval from the Research Ethics Review Board of the National Center for Health Statistics (NCHS), and informed consent was obtained from all study participants. The NHANES database spans 10 survey cycles between 1999 and 2018, involving 101,316 participants who were followed up. Among these, 14,692 individuals had arthritis (https://wwwn.cdc.gov/nchs/nhanes/2009-2010/ARQ_F.htm). The inclusion criteria were (1) diagnosed with arthritis, (2) available OBS data, (3) available covariate data, and (4) available follow-up. Participants < 20 years old, pregnant women, or missing data (socioeconomic indexes, body mass index (BMI), smoking, dietary habits, or physical activity) were excluded. Particularly, in line with NHANES analytical protocols, covariates with missing values of less than 10% were directly deleted without affecting the results of the analysis, and missing variables above this threshold should be randomly interpolated and then analyzed. As shown in the flowchart, all missing values for covariates in this study were less than 10%. Therefore, individuals with missing covariates were not included in the study. Ultimately, after excluding 458 individuals with missing OBS data and 2480 with missing covariate information, this study included 11,754 patients with arthritis from the NHANES 1999–2018 (Fig. 1).
Exposure information
The data for calculating OBS scores were extracted from the NHANES database. The OBS was calculated using 16 nutrients (dietary fiber, carotene, riboflavin, niacin, vitamin B6, total folate, vitamin B12, vitamin C, vitamin E, calcium, magnesium, zinc, copper, selenium, total fat, and iron) and four lifestyle factors (physical activity, BMI, alcohol consumption, and smoking) [19]. Total fat, iron, BMI, alcohol, and smoking were considered pro-oxidant factors, while the others were considered antioxidant ones [26]. Alcohol was divided into three categories: heavy drinkers (≥15 and ≥30 g/d for women and men, respectively), drinkers (0–15 g/d and 0–30 g/d for women and men, respectively), and non-drinkers [19]. For antioxidative components, scores are assigned as 0, 1, and 2 points for the lowest to the highest tertiles, respectively. In contrast, pro-oxidative components are scored inversely, with the highest tertile receiving 0 points and the lowest receiving 2 points [19]. OBS was categorized into quartiles based on overall sample quartiles to align with prior NHANES studies and ensure sufficient sample sizes for stratified analyses [27]. The scoring scheme for OBS components is detailed in Supplementary Table S1.
Ascertainment of mortality outcome
The study outcomes were all-cause mortality and CVD mortality. All-cause mortality was defined as death from any cause. CVD mortality was defined as death from ICD-10 codes I00-I09, I11, I13, and I20-I51 [28].
Assessment of covariates
Covariates were selected a priori based on established research evidence and recommendations from clinical experts [27, 29], with the three key considerations: (1) Established confounding frameworks in arthritis mortality studies (e.g., demographics, socioeconomic status), (2) biological plausibility as mediators of oxidative stress pathways (e.g., comorbidities), and (3) empirical evidence of confounding effects. Trained staff administered structured interviews to obtain demographic data, capturing age, sex, ethnicity (non-Hispanic Black, non-Hispanic White, Mexican American, other Hispanica, and other Races), education level (less than high school, high school or equivalent, and college or above), marital status (married/cohabiting, widowed/divorced/separated, and never married), poverty income ratio (computed using HHS federal poverty standards), age at arthritis diagnosis, energy intake, disease history, alcohol use, smoking, and prescription medication use. Individuals were identified as having diabetes, hypertension, or CVD based on either having a doctor-confirmed diagnosis or being on relevant prescribed drugs. Body mass index (BMI) was measured by professionals at the Mobile Examination Centre (MEC).
Statistical analysis
Per NHANES guidelines, we applied MEC sample weights for nationally representative estimates. Normally distributed continuous variables were described using means ± standard deviations (SD) and analyzed using the analysis of variance (ANOVA) test. Non-normally distributed continuous variables were described using medians (interquartile ranges (IQRs)) and analyzed using the Wilcoxon test. The categorical variables were summarized using n (%) and analyzed using the Rao-Scott chi-square test. The Kaplan-Meier analysis was used to depict the survival rate disparities among different groups of patients, with significance determined using the log-rank test. The associations of OBS with all-cause mortality and CVD mortality were evaluated using three multivariable Cox regression models. Model 1 was the unadjusted crude model. Model 2 was adjusted for age, sex, and ethnicity. Model 3 was adjusted for age, sex, ethnicity, age at arthritis diagnosis, survey cycle, education level, marital status, PIR, energy intake, and history of diabetes or hypertension. In the multivariable Cox proportional hazard regression model, a trend test was performed across quartile groups. Restricted cubic spline (RCS) regression models, which were fitted with 3 knots at the 10th, 50th, and 90th, based on the AIC values to ensure the best fit effect, were used to explore potential non-linear associations between OBS and all-cause mortality or CVD mortality. Furthermore, sensitivity analyses were performed after excluding the patients with cancer and the patients who died within the first 2 years of follow-up to minimize reverse causality, as these groups may have pre-existing conditions influencing mortality. Stratified analyses were performed based on age (< 60 and ≥ 60 years old), sex, ethnicity, and arthritis type. All analyses were conducted using R (version 4.2.1), with statistical significance set at a P-value of < 0.05 (two-sided).