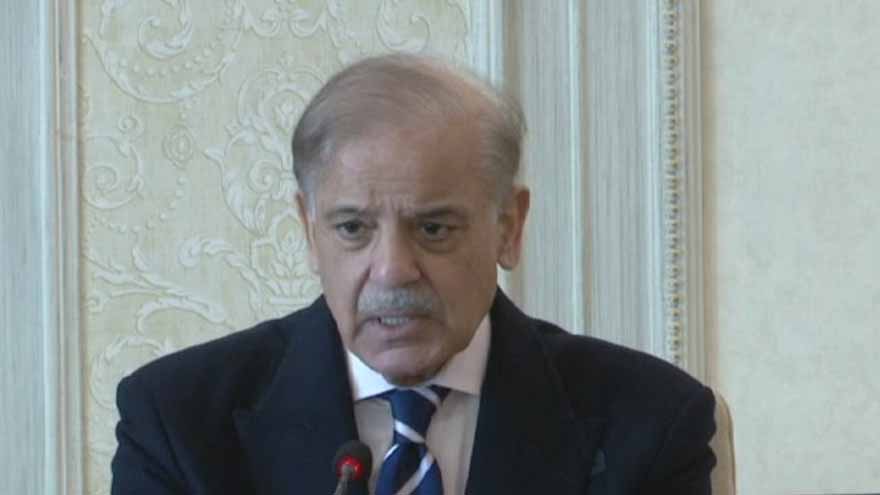
Efficacy of progressive resistance training intensities and adequate dietary protein intake for community-dwelling frail older adults (TEAMS study), protocol for a randomised controlled trial | BMC Geriatrics

Study design and participants

We are conducting a two-step randomised controlled trial to investigate the effects of varying PRT intensities and adequate dietary protein intake on muscle strength in older adults. The objective is to enrol 300 community-dwelling frail older adults, identified and recruited through mailings by municipalities in the Metropole Region Amsterdam (MRA), collaborations with primary care and healthcare organizations in MRA, and advertisements in local newspapers and other media.

Screening

Individuals interested in participating can request an information package, which includes a detailed explanation of the research and Informed Consent forms. A telephone screening by a trained researcher will follow to preliminarily assess inclusion criteria with a focus on age and frailty status according to the Tilburg Frailty Indicator (TFI), which assesses frailty across physical, psychological, and social domains, providing a multidimensional view of frailty [14]. If the age and frailty criteria are met, a face-to-face screening visit is scheduled to provide comprehensive information about the study and answer questions of potential participants. After obtaining informed consent(s), sociodemographic characteristics such as age, sex, educational level, and living situation and medical history data are collected. In addition, cognitive impairments are assessed using the Mini-Mental State Examination (MMSE), which screens for potential cognitive impairments, supporting the early identification of cognitive issues [15], and physical activity readiness is evaluated using the Physical Activity Readiness Questionnaire (PAR-Q), which determines readiness for exercise participation, ensuring safety in the exercise program [16].The study physician reviews these criteria to confirm eligibility for the PRT program and inclusion in this study. The inclusion and exclusion criteria are outlined in Table 1.

Table 1 Inclusion and exclusion criteria of the TEAMS study

Randomisation

After screening and inclusion, participants are initially randomised into 13 different intensity groups based on their maximal muscle strength (1-RM): 20%, 25%, 30%, 35%, 40%, 45%, 50%, 55%, 60%, 65%, 70%, 75%, or 80% of their 1-RM, using a computer-generated sequence to ensure equitable distribution. Subsequently, participants are randomly assigned to either a dietary protein intervention group (PRT-Pro) or a control group (PRT-only). Randomisation is conducted by an independent researcher in a blinded manner to ensure participants remain unaware of their training intensity. The assessor responsible for measuring the primary outcome (1-RM) remains fully blinded to the treatment allocations throughout the study. After the screening, inclusion, and randomisation phase, the intervention starts with baseline measurements at week 0 with final measurements scheduled at week 12 (Fig. 1).

Fig. 1

Schematic overview of the TEAMS study design

Interventions

Progressive resistance training

All participants (n = 300) will take part in the PRT program. Each participant will train in a group of approximately 4–8 participants and be guided one-on-one by a certified trainer to ensure both safety and quality of the training. The PRT sessions will be held twice a week, each lasting 45–60 min, and will be scheduled at a fixed time on two non-consecutive weekdays, maintaining a 48-hour gap between sessions. The PRT program is designed to target full-body strength, with a special focus on strengthening the lower extremities, critical for essential daily functions such as walking, stair climbing, and standing up from a seated position [4].

The training protocol comprises three phases. Sessions commence with a five-minute warm-up involving low-intensity aerobic activities like cycling or treadmill walking. Following the warm-up, participants engage in PRT, which includes the exercises leg press, leg extension, chest press, and lat pull-down. Each exercise consists of three sets performed to volitional muscle failure (VMF). The intensity for leg press and leg extension varies from 20 to 80% of the participant’s one-repetition maximum (1-RM) and depends on the randomisation. The chest press and lat pull-down loads will be standardised by using a score of 6–7 on the perceived exertion scale [17]. Rest periods of one to two minutes will be incorporated between exercises and sets, with the training lasting approximately 30 to 40 min. Afterwards, there is a cooling down involving low-intensity aerobic activities.

During the initial adaptation phase of two weeks, participants will undergo lower-intensity resistance training to familiarise themselves with the equipment and training dynamics. After the adaptation phase, the training intensity will be adjusted according to the randomised 1-RM. For instance, if a participant’s leg press 1-RM is 60 kg, and the 1-RM intensity of the randomisation is set at 50%, the training load will be 30 kg. Measurements at weeks 4 and 8 assess participants’ strength gains to recalibrate the training load, maintaining the predetermined 1-RM intensity while ensuring progressive overload. This method guarantees that as participants’ strength increases, the actual load adjusts accordingly, optimizing training efficacy without altering the initial percentage-based protocol [13]. For example, if a participant’s leg press strength increases from an initial 1-RM of 60 kg to 65 kg by week 4, the training load, originally set at 30 kg (50% of 60 kg), will be adjusted to 32.5 kg (50% of 65 kg) to maintain the overload principle. The trainer monitors various factors including adherence, the training loads, the number of repetitions, sets, experienced effort, satisfaction, and any (serious) adverse events during each training session. Discontinuation is recommended when medically indicated. However, in most cases of adverse events and complaints, training is continued to the individual’s maximum capability.

Dietary protein intervention (PRT-Pro)

Half of the participants (n = 150) will receive the dietary protein intervention alongside the resistance training program (PRT-Pro group). This intervention aims to ensure a daily protein intake of a minimum of 1.2 g/kg of body weight per day, and optimal 1.5 g/kg per day where feasible. To account for variations in body weight, protein needs will be calculated using a BMI of 20.0 kg/m2 for underweight participants (BMI < 20 kg/m2) and 27.5 kg/m2 for overweight participants (BMI > 30 kg/m2) to prevent under- or over-feeding [18]. The dietary protein intervention comprises two components: dietary counselling and the provision of protein-rich food products. Dietary counselling includes two in-person group sessions led by dietitians and five tele-coaching sessions for tailored nutritional guidance based on individual eating habits and preferences. The tele-coaching is preferably video conferencing in order to apply a blended care approach. Secondly, participants receive protein-rich products as oral nutritional supplements, specifically two consumer products designed to enhance daily protein intake. These include 10 g of Whey Protein Isolate, supplied by Carezzo Nutrition BV and Fonterra.

Assessments

Our study follows a detailed assessment schedule to evaluate the effects of the study on different outcomes. A detailed overview of primary and secondary outcomes is presented in Table 2.

Table 2 Overview of assessment schedule

Primary outcome

Lower extremity muscle strength

The primary outcome focuses on the change in lower extremity muscle strength, assessed by the one-repetition maximum test (1-RM test) on the leg press device between the confirmation test (week 1) and final assessment after twelve weeks. The 1-RM test is a reliable and widely-used measure to evaluate lower extremity muscle strength in older adults [19,20,21,22]. It is defined as the maximum weight a participant can press or lift with correct technique [20]. To ensure the reliability of these measures, the 1-RM test will be conducted in two stages: an initial familiarization at baseline and a subsequent confirmation test within the first week of training. A trained researcher who is blinded to the randomisation will conduct all these measurements for every participant, ensuring standardised and reliable results.

Secondary outcomes

Body composition/anthropometry

Bioelectrical impedance analysis (BIA)

Measures body composition including fat-free mass, fat mass, and total body water, providing a detailed profile of the body composition changes [23]. Participants will stand on an 8-polar BIA device (TANITA MC-780) with bare feet and hold hand electrodes. The device sends a low, safe electrical current through the body, and measures the resistance to the current flow to estimate different body composition metrics.

Muscle mass (2D Ultrasound)

Evaluates changes in muscle quantity of the vastus lateralis and rectus femoris [24]. Participants will lie in a supine position while a trained technician marks the upper leg length, circumference and applies a water-soluble gel and uses a 2D ultrasound probe to scan the muscles on the midsection of the upper leg. The ultrasound images will be used to measure muscle mass.

Body weight, height, and body mass index (BMI)

Measurements are taken using calibrated equipment, forming the basis for BMI calculations.

Physical performance

Short physical performance battery (SPPB)

This test assesses physical performance, including balance in three positions, gait speed over 4 m at a usual pace with two trials (the fastest time will be recorded), and the five times chair stand test. For the five times chair stand test, participants are instructed to stand up and sit down as quickly as possible with arms folded across the chest, and the time taken to complete the task is recorded. Each component of the SPPB is scored from 0 (unable to complete) to 4 (highest level of performance), with a maximum possible score of 12. Higher scores indicate better physical performance. The SPPB is known for its predictive validity for disability, early mortality, and nursing home admission [25].

30 second chair and stand test (30CST)

This test is used to evaluate lower extremity strength and functional capacity. During the 30CST, participants are instructed to stand up fully and sit down as many times as possible within 30 s. The total number of completed stands is counted and recorded. This test helps in assessing the strength and endurance of the lower body muscles, providing valuable insights into the functional capacity of the participants. Higher numbers of stands indicate better lower extremity strength and endurance [26].

Handgrip strength with handheld dynamometer (JAMAR) (HGS)

This test assesses muscle strength in the upper body through three consecutive measures (kg), providing a comprehensive evaluation of upper limb strength [27]. The procedure is as follows: participants sit in a standard chair without arm rest with their elbow at a 90-degree. The test begins with the dominant hand, followed by the non-dominant hand, and then alternates back to the dominant hand, continuing in this sequence until each hand has been tested three times. Participants are encouraged to exert maximum force by verbal prompts such as “push”. The highest value from the three trials for each hand is recorded. Higher values indicate greater muscle strength.

Barthel Index (BI)

This test measures the level of independence in activities of daily living (ADL), offering insights into the practical implications of the intervention on daily life autonomy. The BI assesses ten areas of daily functioning: feeding, bathing, grooming, dressing, bowels, bladder, toilet use, transfers (e.g., from bed to chair), mobility, and stairs. Each activity is scored based on the amount of assistance required, with a total score ranging from 0 (completely dependent) to 100 (completely independent). Higher scores indicate greater independence in performing daily activities. The BI is a widely-used tool for evaluating functional status and monitoring changes in a patient’s ability to care for themselves [28, 29].

Physical activity monitor (PAM)

A CE-certified, compact, battery-operated electronic accelerometer worn around the ankle for a minimum of three days, including a weekend day, to accurately capture daily physical activity patterns. The PAM records various metrics such as step count, movement intensity, and duration of physical activity. This data provides a detailed profile of the participant’s daily activity levels and helps in assessing the effectiveness of interventions aimed at increasing physical activity.

Cognitive performance

Trail Making Test (TMT)

Assesses visual attention, processing speed, and mental flexibility [30]. The TMT consists of two parts: TMT-A, where participants draw lines to connect 25 consecutive numbers in ascending order as quickly as possible, and TMT-B, where they alternate between numbers and letters (e.g., 1, A, 2, B) in ascending order. The time to complete each part is recorded.

Stroop color word test (SCWT)

Evaluates cognitive processing speed, attention, and inhibition control [31]. Participants will be presented with a list of color names printed in incongruent ink colors (e.g., the word “red” printed in blue ink) and asked to name the color of the ink as quickly as possible. The time taken and errors made are recorded.

Letter fluency (LF)

Measures verbal fluency and executive functioning [32]. Participants are asked to generate as many Dutch words as possible beginning with P, G and R within one minute per letter. The number of correct words is counted.

Psychosocial and health status

Six-item State-Trait anxiety inventory (STAI-6)

Provides a quick measure of anxiety, a common concern among older adults [33]. Participants rate six statements on a scale from 1 (not at all) to 4 (very much), indicating how they feel at that moment. Scores are summed to provide an overall anxiety score.

Numeric rating scale (NRS)

Participants rate their fear of falling, pain, and fatigue on a scale from 0 (none) to 10 (worst imaginable) [34, 35].

The short form health survey (SF-12)

Assesses quality of life, includes 12 questions covering physical and mental health domains highlighting the intervention’s impact on overall well-being [36].

Pittsburgh sleep quality index (PSQI)

Measures sleep quality, an essential component of overall health and well-being [37].

The geriatric depression Scale-15 (GDS-15)

Used to assess symptoms of depression, providing insights into the mental health status of participants [38]. Participants respond to 15 yes/no questions about how they have felt over the past week, with higher scores indicating greater levels of depressive symptoms.

Nutritional status

3-day dietary record

Captures detailed information on dietary intake and patterns, allowing for a nuanced understanding of nutritional behaviours and their modifications throughout the intervention [39]. Participants record all foods and beverages consumed over three consecutive days, including one weekend day. Coding and analysis will be performed with use of the Dutch NEVO database. The records are reviewed with a dietitian for accuracy and completeness.

Combined Malnutrition Screening Tool (CMST)

Evaluates malnutrition and consists of four validated tools: Short Nutritional Assessment Questionnaire (SNAQ), Malnutrition Universal Screening Tool (MUST), Mini Nutritional Assessment Short Form (MNA-SF) and the Malnutrition Screening Tool (MST) [40, 41].

Intervention outcomes

Training outcomes and adherence

These are monitored to assess the exercise implementation and participant engagement, ensuring the reliability of training data. This includes monitoring load, repetitions, sets, completed exercises, frequency and adherence through an administrative system/training logbook (e)CRF. When completing a training session, the effort experienced is rated by the BORG scale and satisfaction is measured on a 10-point scale [17].

Dietary counselling and protein intake adherence

Dietary counselling contacts and the offered protein-rich products and consumption is recorded in an (e)CRF protein logbook over 12 weeks, providing details of adherence to the dietary protein intervention. Furthermore, dietary nutrition records are collected to obtain information on the amount, timing, and source of protein. Dietitians will review these logs during counselling sessions to adjust guidance and support adherence and evaluate the protein intake post-intervention.

Other study outcomes

Blood markers

Following an overnight fast (5 h no foods, 2 h no beverages), blood samples are collected in EDTA-containing and serum tubes. EDTA-containing tubes are centrifuged at 1000 g at 4 °C for 10 min, and serum tubes are centrifuged 90 min after blood collection at 1000 g at 20 °C for 15 min. Aliquots of plasma and serum are frozen in liquid nitrogen and stored at − 80 °C until analysis. Inflammatory markers and changes in metabolites are analysed [42,43,44] in batches after the study is completed. Planned analyses are, for example, the assessment of inflammatory markers such as CRP, IL-6, and TNF-α, as well as neurofilament light chain (NfL), insulin, creatinine, and vitamin D to evaluate inflammatory, neuronal, nutritional, and metabolic responses to the intervention. Blood aliquots are stored in our project collection within the Biobank at Amsterdam University Medical Centers (AUMC). Only participants who have provided additional informed consent for blood collection and biobank use will have samples included for this analysis.

Health cost registration questionnaire

Participants complete a questionnaire during baseline, week 6, and final measurements capturing healthcare utilization and other healthcare services. These data are used to perform a cost-benefit analysis of the intervention.

Medical status, adverse events (adverse effects directly related to interventions), and serious adverse events

These are continually tracked to provide critical safety information. Potential adverse events include muscle soreness, joint discomfort, fatigue, and gastrointestinal complaints related to protein intake. Changes in medical status, medication use, or any negative outcomes during the intervention are also monitored. All adverse events (AEs) and serious adverse events (SAEs) are recorded in an electronic Case Report Form (eCRF), including frequency, severity, and potential relation with the intervention or specific exercise. SAEs are reported to the study physician, who evaluates and classifies each event based on clinical relevance and potential causality. Based on this assessment, the physician may recommend additional monitoring, temporary suspension of training, or discontinuation of a participant’s involvement to ensure safety. Medical status is monitored throughout the study, and if needed, discontinuation of participation is discussed with the study physician. The medical status is monitored during the whole study and, if necessary, discontinuation of participation is discussed with the study physician.

Participant survey

This survey captures participants’ feedback and experiences, providing valuable insights into the program’s acceptability. It includes questions on perceived benefits, challenges, satisfaction with the intervention, and overall experience. The survey is administered at the end of the intervention period.

Focus groups

Conducted at the end of the training period for process evaluation, these aim to collect qualitative data on participants’ perceptions and experiences regarding both resistance intervention and dietary protein intervention. Participants are invited to share their thoughts in structured discussions led by a trained facilitator. The discussions are transcribed and analysed for common themes and insights.

Sample size calculation

To estimate the standard deviation (SD) and expected effect size, we utilised data from the ProMuscle study, a randomised, double-blind, placebo-controlled trial among 62 frail Dutch older adults, participating in a resistance exercise training program similar to the TEAMS protocol [13]. The ProMuscle study reported a mean baseline 1-RM leg press of 120 kg, with an average increase of 30 kg after three months of training (SD = 32). Both groups in our study will receive resistance training. We aim to further increase the 1-RM by providing additional proteins by at least 12 kg [10,11,12]. This leads to a total required sample size of 224 (112 per arm). Adjusting for an anticipated 33% dropout rate due to frailty in our population, we plan to recruit 300 participants, targeting an effect size of 12 kg, with SD = 32, at an alpha level of 0.05, and 80% power.

Data management and quality assurance

Before the start of the trial, a comprehensive data management plan is developed. This plan outlines the entire process from data collection to archiving, in compliance with the policies of the Amsterdam University of Applied Sciences (AUAS). For electronic data capture, we utilise Castor EDC (Amsterdam, The Netherlands). During the data entry process, an additional verification step is routinely implemented; a secondary data entry person cross-checks the entered data against the source documents.

Given the target population and the challenging circumstances, the principal investigator will appoint a monitor for the trial. Although this trial is classified as low risk for monitoring, special attention will be given to the reporting of adverse events and effects. In accordance with the informed consent and funding policy, the right to analyse and publish the results resides with the AUAS project staff. Access to the final dataset will be restricted to this project’s research staff. The final data package will be stored on the Figshare repository with a restricted license, while publications will be under an open license, as mandated.

Statistical analysis

We will summarise baseline characteristics of study participants using descriptive statistics. Continuous variables following a normal distribution will be presented using means and standard deviations. For non-normal distributed data medians and interquartile ranges will be used. Categorical variables will be described by their frequency (n) and percentage (%).

For our first aim, we will treat 1-RM training intensity as a continuous variable and use linear regression analysis to identify the optimal training intensity for PRT in frail older adults. We anticipate uncovering a parabolic relationship between training intensity and lower muscle strength, which suggests potential inefficiencies at low or high training intensities. Additionally, we will investigate subgroup analyses to examine the effects of adequate dietary protein intake on the training intensity and outcomes. To examine how personal characteristics (such as frailty status, nutritional status, sex, age, comorbidities, cognitive abilities, and mental performance) impact these outcomes, we will employ multiple regression models. This will include assessing interaction effects and conducting subgroup analyses, which are pivotal for understanding the nuanced interplay between participant characteristics and the effectiveness of the interventions.

Data analysis will be conducted using R Studio statistical software. A significance level of p < 0.05 will be used to determine statistical significance. We will address the potential issue of missing data by implementing appropriate imputation techniques and conducting sensitivity analyses to evaluate the impact of any missing values on our study outcomes. A detailed Statistical Analysis Plan will be developed and made publicly available on the Figshare repository.

Continue Reading