Expression plasmids and transient transfections
To investigate the influence of glycosylation degree on the antigenicity and immunogenicity of the Marburg virus GPs, Angola-GP (KU978782) strain MARV GP ectodomains (including residues 1-637), containing the mucin-like domain (MARV GPΔTM) or deleting residues 264-425 to remove the mucin-like domain (MARV GPΔTM ΔMuc), were expressed in different cells. For Drosophila S2 cell expression, DNA encoding the glycoproteins was synthesized and codon-optimized for expression in insect cells at General Biol. The gene was cloned into the vector pMT/BiP/V5-His B(PMT-GP). For Expi293F cell expression, the gene was codon-optimized for expression in mammalian cells, and the gene of MARV GPΔTM was cloned into the vector pCAGGS (PCAGGS-GP); the other gene of MARV GPΔTM ΔMuc was cloned into the vector pcDNA3.4(pcDNA3.4-GP). All constructs contained a C-terminal Twin-Strep-tag for purification.
To generate GP glycoprotein from insect cells, S2 cells cultured in Schneider’s Drosophila Medium (Gibco, 21720024) containing 10% heat-inactivated FBS (Gibco, 10099141-C), 0.1% Pluronic F-68 (Gibco, 24040032) and 50 U/mL Penicillin-Streptomycin (Gibco, 15140122) were co-transfected with pMT-GP using calcium phosphate transfection (YEASEN, 40803ES70). Prepare cultured cells for transfection by seeding 1 × 10⁶ S2 cells in a 6-well plate in 2 mL complete Schneider’s Drosophila Medium. After growing for 16 h at 27 °C until cells reach a density of 2 × 10⁶-4 × 10⁶ cells/mL, 6 µg pMT-GP by calcium phosphate transfection was co-transfected for each well, and the medium was changed after 24 h of incubation. Copper sulfate was added to the medium to a final concentration of 500 µM 2 days after transfection. Six days after transfection, the culture medium was collected and then clarified by centrifugation at 800 × g for 15 min, 4000 × g for 15 min, and filtered using a 0.45 μm filter (Millipore, SLHVR33RB). For Expi293F, PCAGGS-GP (MARV GPΔTM) or pcDNA3.4-GP (MARV GPΔTM ΔMuc) constructs were transiently expressed in Expi293F cells with the ExpiFectamine™ 293 transfection kit (Gibco, A14524) at 37 °C at 100 rpm with 5% CO₂ according to the manufacturer’s protocol. The supernatant was collected at 120 h post-transfection.
The supernatant was purified through a StrepTactin affinity purification strepTrap(Cytiva,29401322) purification column according to the manufacturer’s instructions. Then, the elution was exchanged with 0.01 M phosphate-buffered saline (PBS, pH 7.2) and concentrated using a 30 kD Centrifugal Filter Unit (Millipore, UFC903096). Proteins were further purified by SEC on a Superdex 200 Increase 10/300 GL column (Cytiva, 28990944). Then the fractions were harvested and analyzed by SDS-PAGE. The resulting purified Marburg GPs glycoprotein was used to ELISA, western blotting, and immunization experiments.
Antibody production and purification
The antibody sequences of MR78, MR191, MR228 were used as reported [22, 23] and codon optimized for mammalian cells. The heavy and light chains were cloned into the pcDNA3.4 expression vector, and then the constructs were transfected into Expi293F cells using the ExpiFectamine™ 293 Transfection Kit (Gibco, A14524) according to the manufacturer’s specifications. Antibodies were purified from culture supernatants using Protein A column (Cytiva, 17040201) followed by running buffer (PBS). Bound proteins were eluted using elution buffer (0.1 M glycine, pH 2.7). This fraction was concentrated by 50 kD Amicon Ultra concentrators (Millipore, UFC905096) and was identified using SDS-PAGE. The purified protein was aliquoted and stored at -80 °C until further use.
SDS-PAGE, Native-PAGE and Western blotting
For SDS-PAGE, 5 µg of reduced or non-reduced protein was loaded onto a SurePAGE™ Plus, Bis-Tris, 4-12% gel (GenScript, M00653). After electrophoresis, the gel was stained with Coomassie brilliant blue G-250. For western blotting, gels were transferred onto nitrocellulose membranes (Cytiva, 10600001) using the trans-Blot Turbo transfer system (GenScript). Membranes were then blocked with 5% skim milk for 1 h. After washing three times with wash buffer containing PBS and 0.2% Tween 20 (PBST), the membranes were incubated with MR78 (1 µg/mL) or anti-strep-tag II antibody (1:2000 dilution; Abcam, ab307676) for 1 h. The membranes were washed again and then incubated with HRP-conjugated Goat Anti-Human IgG Fc (1:5000 dilution; Abcam, ab97225) or Goat Anti-Rabbit IgG Secondary Antibody (HRP) (0.01 µg/mL; Sino Biological, SSA004) for 1 h. Membranes were washed again and then incubated with Chemiluminescent Substrate Kit (Millipore, WBKLS0100). Images were acquired using an iBright FL1500 imaging system (Invitrogen).
For native-PAGE, purified protein samples were mixed with 3× loading buffer (Thermo Scientific, BN2008) and then loaded onto 4-15% Native-Page Tris-Gly gradient gels (Beyotime, P0465S) as described by the manufacturer. Proteins were electrophoresed at 150 V for 60 min. After electrophoresis, the protein was also stained with Coomassie brilliant blue G-250.
High-performance liquid chromatography (HPLC)
All high-purity GPs were analyzed on a HPLC system (Waters) using a TSK Gel G5000PWXL 7.8 × 300 mm column (TOSOH, 0008023), which was pre-equilibrated with PBS, pH 7.4 (Gibco, C10010500BT). Samples were loaded at a flow rate of 0.4 mL/min, and eluted proteins were detected at 280 nm.
Deglycosylation and glycan staining
Glycans were removed from purified GPs using peptide-N-glycosidase F (PNGase F) (New England BioLabs, P0704S) and Endoglycosidase (Endo H) (New England BioLabs, P0702S). In brief, 20 µg of GP protein was denatured at 100 °C for 10 min in 1× glycoprotein denaturing buffer, then digested with 1 µL PNGase F or endo-N-acetylglucosaminidase H (Endo H) at 37 °C for 1 h according to the manufacturer’s instructions. The deglycosylated protein was analyzed by Western blot with anti-Strep antibody as the detection antibody. For MARV GPΔTM ΔMuc, the detection method is as described above. For MARV GPΔTM, the membranes were incubated with StrepMAB-Classic HRP (1:3000 dilution; iba, 2-1509-001). The glycan staining was performed using periodic acid schiff (PAS) staining (Thermo Scientific, 24562) for glycoproteins as described by the manufacturer.
Enzyme-linked immunosorbent assay (ELISA)
To determine the antigenicity of Marburg virus GP, Costar™ 96-well assay plates (Costar, 9018) were coated overnight at 4 °C with serially diluted Marburg GP. Then washed three times with wash buffer containing PBS and 0.2% Tween 20 (PBST). Each well was then coated with 100 µl of blocking buffer containing PBST with 2% BSA for 1 h at 37 °C and then washed three times with wash buffer. Marburg mAbs MR78 and MR191 were then separately added at a concentration of 10 µg/mL, MR228 was added at a concentration of 1 µg/mL, followed by incubation for 1 h at 37 °C. Then, after washing three times with wash buffer, Goat Anti-Human IgG Fc (HRP) (1:10000 dilution; Abcam, ab97225) was added and incubated for 1 h. Finally, after washing three times with wash buffer, the wells were developed with 100 µL of TMB (Solarbio, PR1200) for 3 min at 37 °C, then the reaction was stopped with 50 µL of ELISA Stop Solution (Solarbio, C1058). The absorbance was measured at 450 nm (reference: 630 nm). Data was analyzed by four-parameter nonlinear regression using GraphPad Prism 8.4.2 software.
Mice immunization
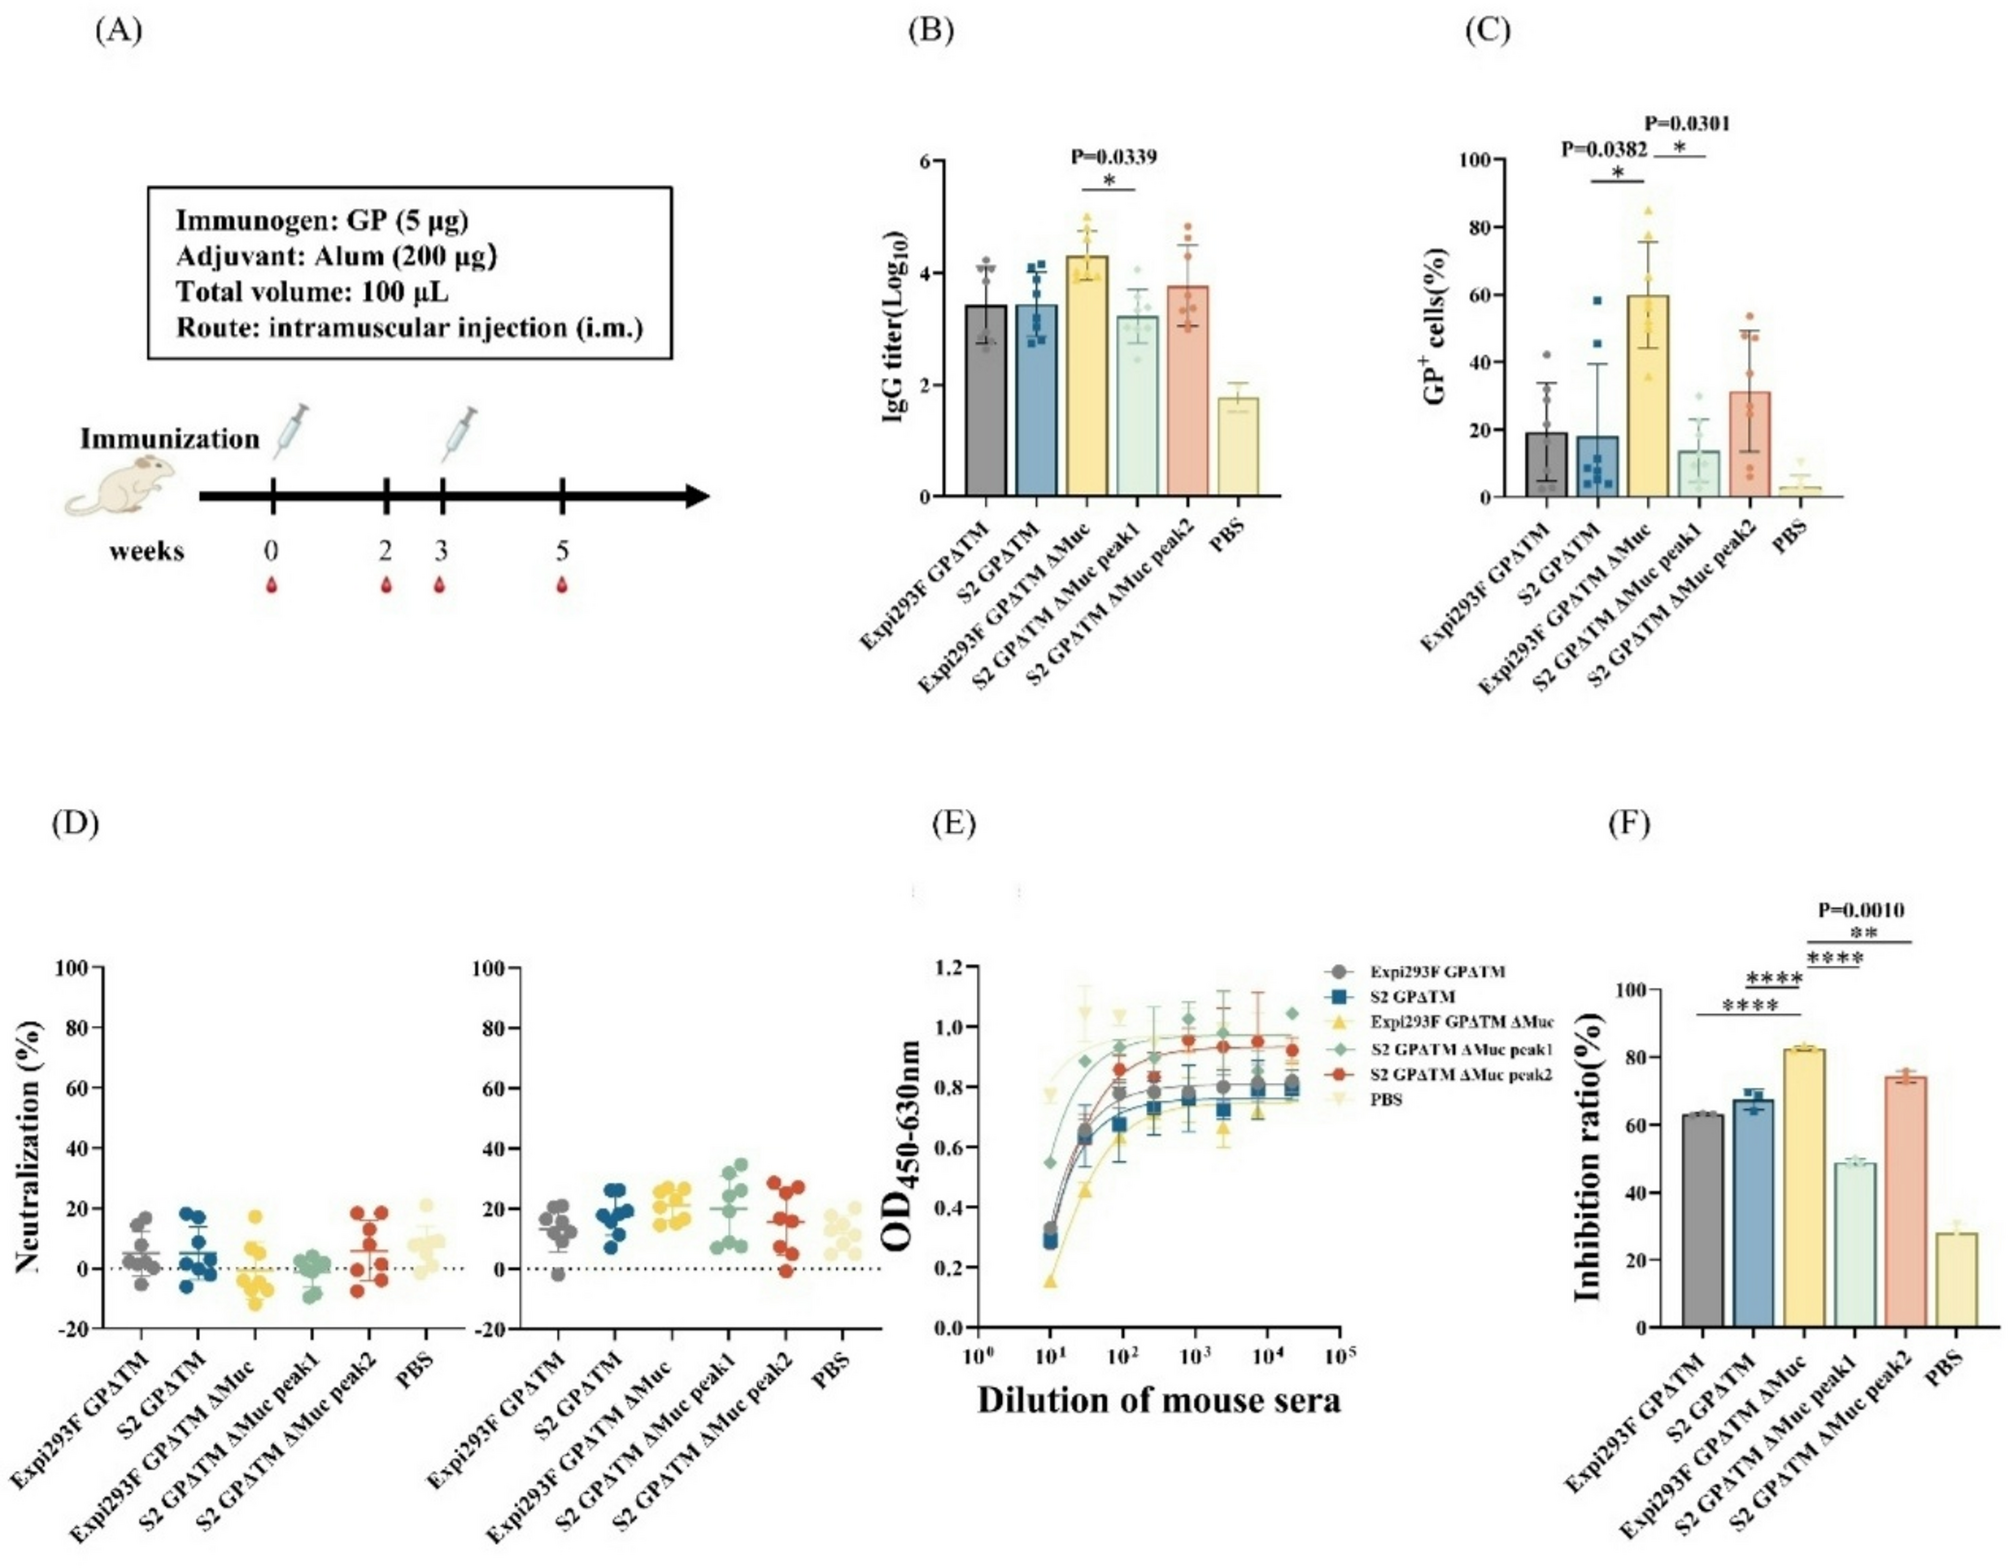
Specific pathogen-free (SPF) female BALB/c mice (6-8 weeks) were randomly divided into 6 groups with 8 mice per group, used for intramuscular immunization. Each mouse was injected with 100 µL of vaccine sample including 5 µg purified Marburg GP glycoprotein antigens, 200 µg aluminum adjuvant (InvivoGen, vac-alu-50), or PBS solution. The five purified Marburg GP glycoprotein antigens included Expi293F-derived GPΔTM, S2-derived GPΔTM, Expi293F-derived GPΔTM ΔMuc, S2-derived GPΔTM ΔMuc peak1, and S2-derived GPΔTM ΔMuc peak2. The control mice were vaccinated with PBS. The mice were immunized at weeks 0 and 3, and the blood samples were collected from the tail vein and processed by centrifugation on days 0, 14, 21 and 35. Then the processed serum was heated and inactivated at 56 °C for 30 min, aliquoted, and then stored at -80 °C until analysis was performed.
Antibody measurement
To measure GP-specific antibody responses in serum samples by ELISA, purified GP was coated into the wells of 96-well microtiter plates (Costar, 9018) at 10 µg/mL (100 µL) and incubated at 4 °C overnight. After blocking, Sera at 1:100 were three-fold serially diluted and added to the wells (100 µL) as primary antibodies, followed by HRP-conjugated anti-mouse IgG antibody (1:10000 dilution; Abcam, ab97265). After color development, the absorbance was read at 450 nm and 630 nm on a microplate reader (TECAN). For the given serum sample, the cutoff value is defined as 2.1 times the reading of the blank control (without serum added). The endpoint titers were defined as the dilution of the cutoff value.
Cell-surface binding using fluorescence activated cell sorting (FACS)
For the cell surface-displayed GP, 4 µg of plasmid encoding full-length GP was transfected into HEK293T cells cultured in T75 flasks using VirusGEN transfection reagent (Mirus, MIR 6700). After 24 h, cells were detached with 2% (v/v) FBS in PBS and transferred at a total of 5 × 10⁵ cells to each flow tube, then stained with polyclonal sera (1:100) obtained from mice vaccinated with different forms of GP. Cells were subsequently stained with anti-mouse IgG antibody conjugated APC (BioLegend, 405308) followed by flow cytometry analysis on a FACSCanto II flow cytometer (BD Biosciences). Data were analyzed with FlowJo software, using the following gating strategy: size & granularity > single cells > GP+ (Ab positive). All results were expressed as mean fluorescence intensity (MFI) or cell percentage.
Pseudovirus-based neutralization assays
For pseudovirus packaging, the gene encoding the full-length GP of Angola was human codon-optimized and inserted into the pcDNA3.1 vector to construct GP protein-expressing plasmids. HEK293T cells were inoculated into T75 flasks (Corning, 430641) and cultured at 37 °C and 5% CO2 to 70-90% confluence for transfection. 4 µg of pcDNA3.1-Marburg GP were co-transfected with 32 µg of HIV backbone vector pNL4-3.Luc.R-E- into HEK293T cells using the VirusGEN transfection reagent (Mirus, MIR 6700). Supernatants containing pseudovirus particles were collected at 48 h post-transfection by centrifugation at 800 × g for 5 min. The harvested pseudovirus solution was stored in aliquots at − 80 °C after filtering through a 0.45 μm filter.
The titers of neutralizing antibodies in these sera were detected by HIV-based pseudovirus-type neutralization assay. For neutralization testing, serum samples were diluted at 1:20 using Dulbecco’s Modified Eagle’s Medium (Gibco, C11995500BT) with 10% fetal bovine serum at 50 uL per well. The serum samples were mixed with HIV-based pseudovirus-type virus with an equal volume (50 µL) and then incubated at 37 °C for 1 h before adding to HEK293T cells. After 48 h at 37 °C, the luciferase activity was measured by a microplate reader (TECAN) using the Bright-Lite Luciferase Assay System (Vazyme, DD1204). The formula for calculating the percentage of neutralization is “100% – (sample signals – blank control signals) / (virus control signals – blank control signals) × 100%”. The neutralization percent of each sample was performed using the GraphPad Prism 8.4.2 software.
Competitive ELISA
To compare the antibody epitope-specific responses, competitive binding enzyme-linked immunosorbent assay (ELISA) was performed. For the competitive ELISA, the steps were the same as the ELISA method described previously. First, Costar™ 96-well assay plates (Costar, 9018) were coated overnight at 4 °C with 1 µg/mL of Marburg GP. Wash buffer was used to wash the 96-well plate three times; mouse antisera, which was serially diluted from 1:10, was added to the wells and incubated at 37 °C for 1 h. MR228 antibodies were conjugated with HRP by using the EZ-Link Plus Activated Peroxidase kit (Solarbio, EX7000) according to the instructions. The plates were washed 3 times prior to the addition of HRP-conjugated MR228 (0.03 µg/mL) to the wells and incubated at 37 °C for 1 h. Finally, the cleaning step was repeated, and the wells were developed with 100 µL of TMB (Solarbio, PR1200) for 3 min at 37 °C, then the reaction was stopped with 50 µL of termination buffer (Solarbio, C1058). After color development, colorimetric analysis was performed at 450 nm and 630 nm in a microplate reader (TECAN). The formula for calculating the inhibition rate is “(blank control signals – sample signals) / blank control signals × 100%.”
Statistical analysis
Where applicable, results are expressed as the mean ± SD of representative results. Comparisons of GP-specific antibody titers (Fig. 1B) and cell-surface binding results (Fig. 1C) were performed using Kruskal-Wallis one-way ANOVA. Comparisons of neutralization assays (Fig. 1D) and inhibition rates (Fig. 1F) between groups were performed using one-way ANOVA. Differences were considered statistically significant at a P value of 0.05 (*P < 0.05, **P < 0.01, ***P < 0.001, ****P < 0.0001). All statistical analyses were performed with GraphPad Prism 8.4.2 software.
Immunogenicity of GPs derived from Expi293F and S2 cells. (A) Mice immunization schedules. Mice (n = 8) were received 5 µg GP formulated with aluminum adjuvant at weeks 0 and 3. (B) GP-specific antibody titers induced by five GPs at week 5. (C) Binding of cell-surface Marburg GP proteins to mouse sera at week 5 measured by flow cytometry. P values for graphs B and C were determined using Kruskal-Wallis ANOVA, and significant P values between immunized groups are indicated (*P < 0.05). (D) Neutralization assay. Mouse antisera collected at week 5 were diluted 1:20 and then tested for neutralization of HIV-based pseudovirus-type virus. Each symbol represents one animal. (E) Competitive ELISA. Mouse antisera were serially diluted and tested for inhibition of MR228 binding of GP. Means ± SD of OD450-630 nm readings for all animals in each group are shown. (F) Inhibition ratio. The inhibition rate was calculated at a dilution of 1:10 in competitive ELISA. The higher value represented the more MR228-like antibodies contained in the serum. The asterisks in Figures D and F represented significant differences (one-way ANOVA) between groups: **P < 0.01, ****P < 0.0001. All significant differences from the PBS group are not labelled.