Description of confirmed malaria cases and precipitation data
A total of 5,522,650 confirmed malaria cases were reported during the study period in Togo (Table 1). Between 2013 and 2017, confirmed malaria cases increased from 915,117 to 1,204,192 cases. This increase was observed in all three target groups. Children < 5 years old, children ≥ 5 years old and adults, and pregnant women represented 36.6%, 58.5% and 4.9% of the total number of confirmed malaria cases, respectively.
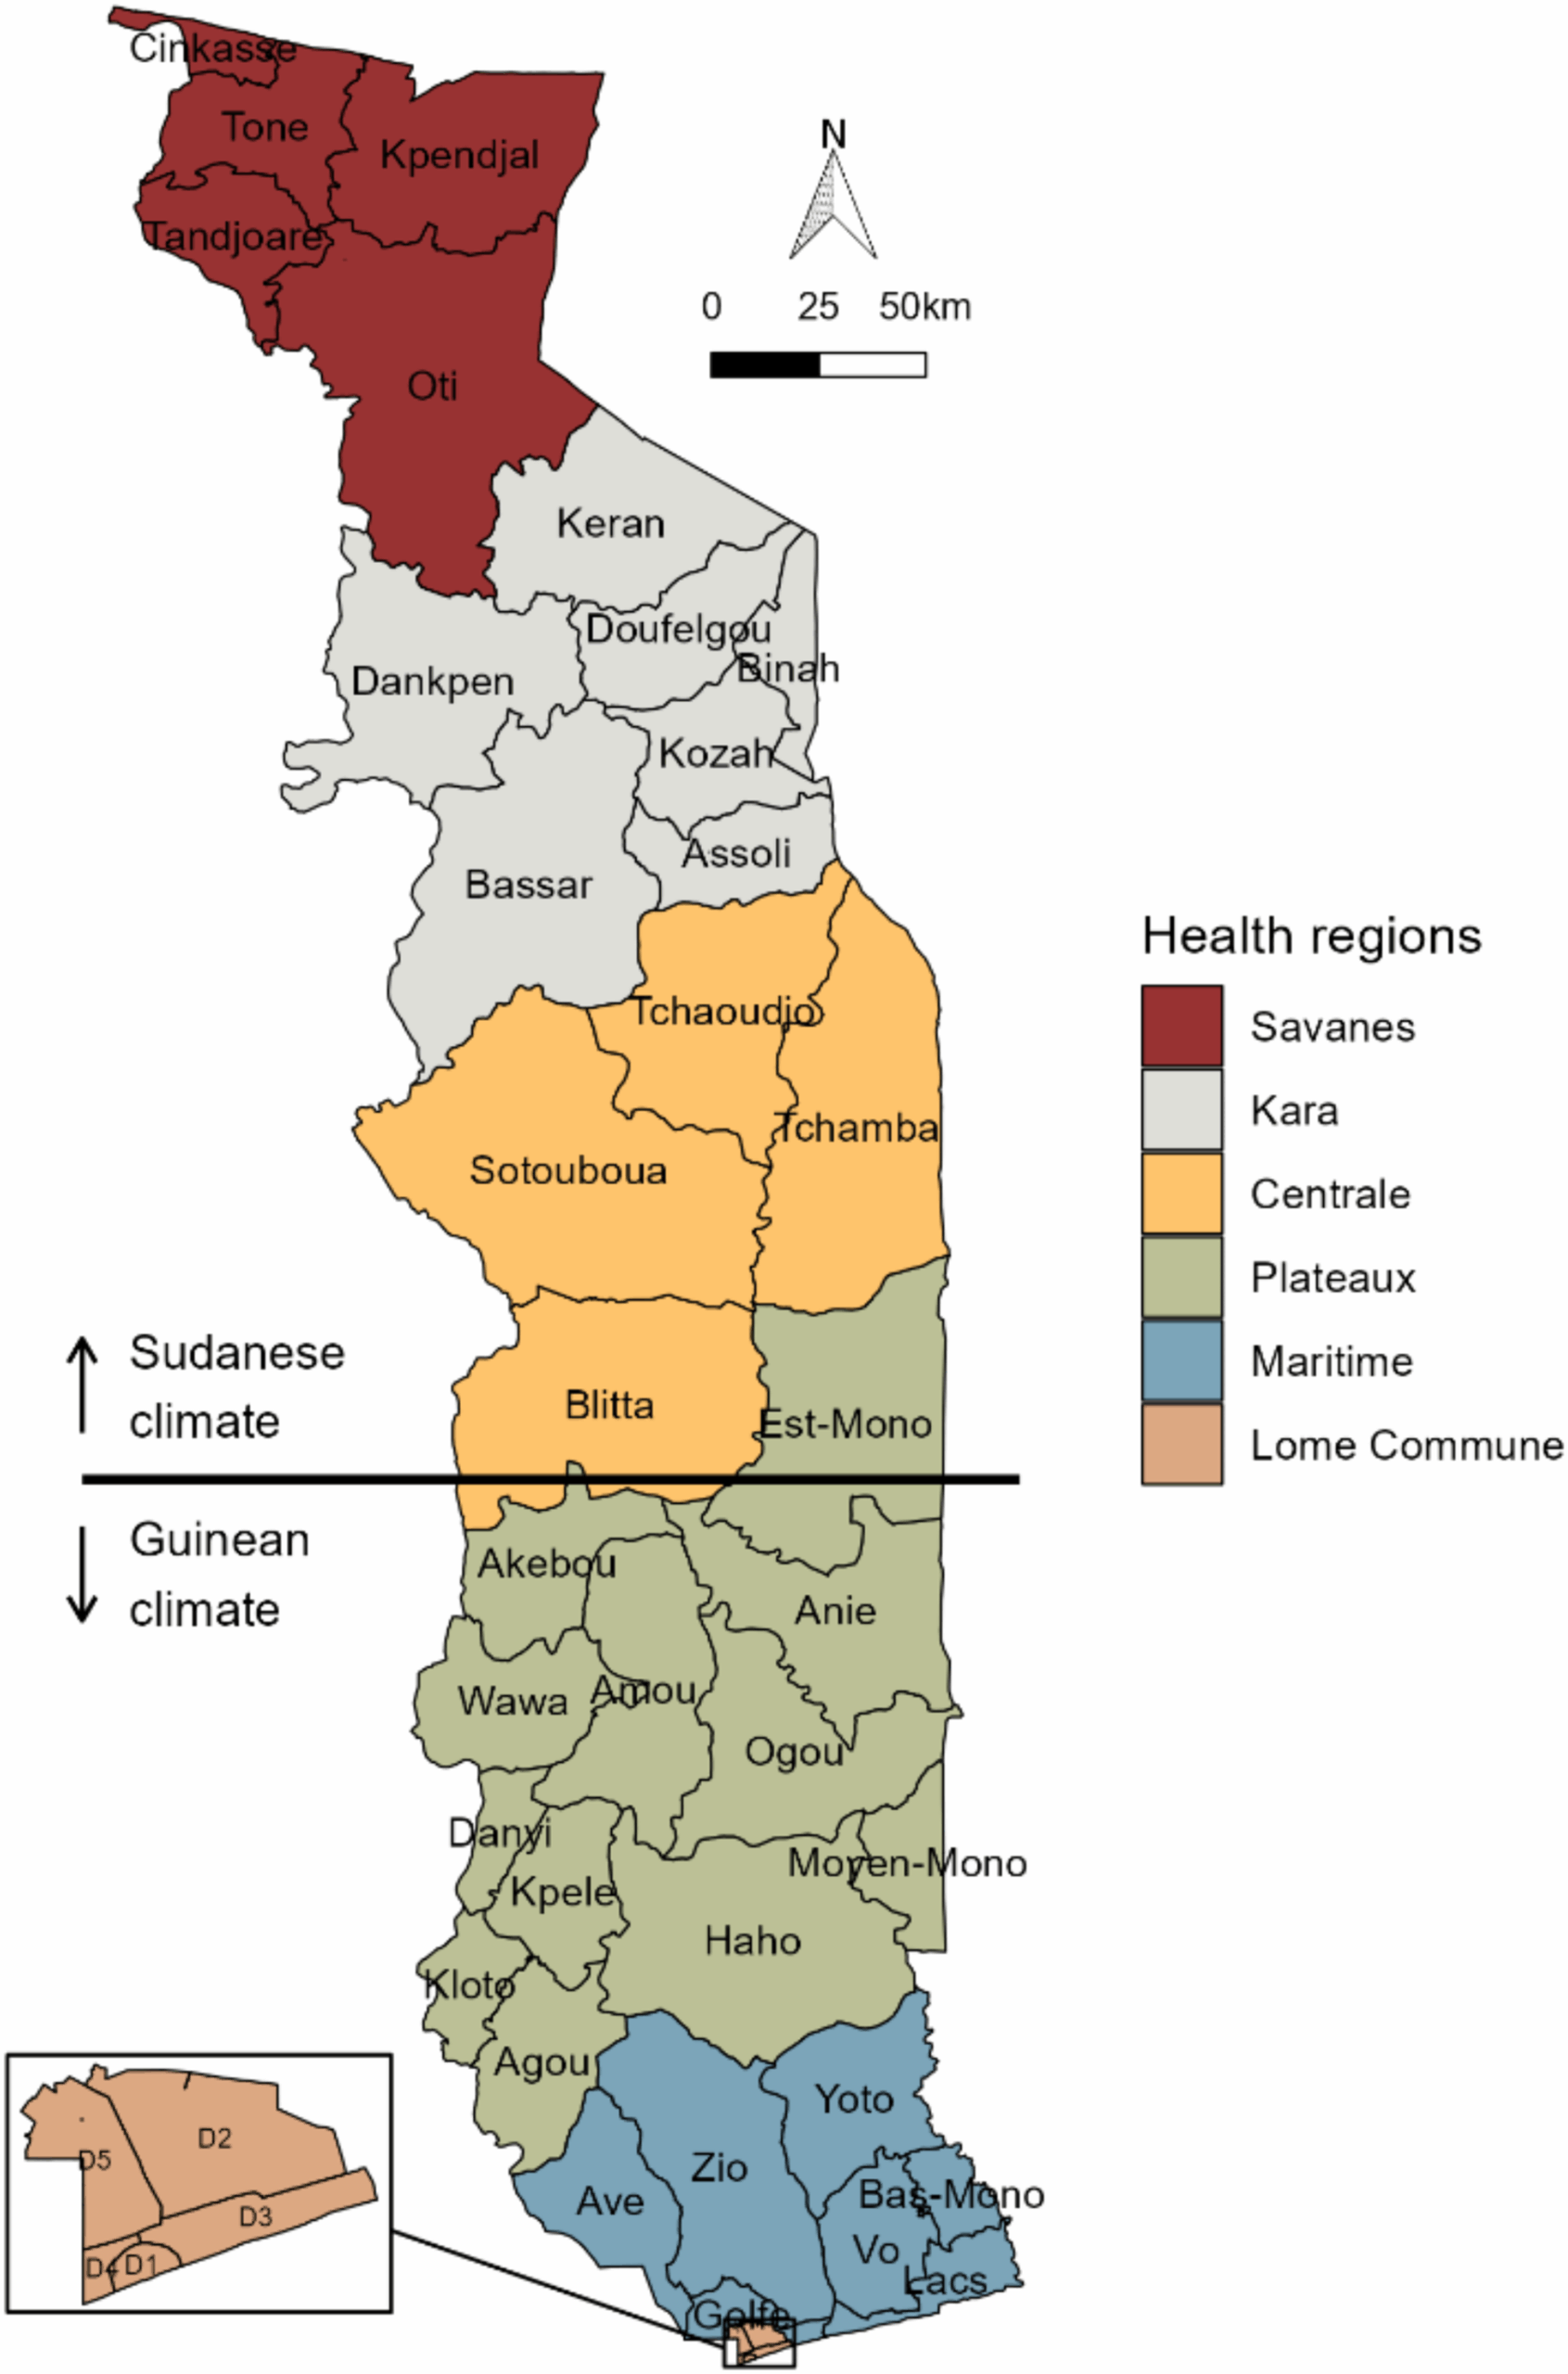
The intensity of monthly precipitation and duration of the rainy season varied between northern and southern health districts (Figure S1). In the north, precipitation was more intense than in the south, especially between July and September. The maximum monthly rainfall was observed in the Binah district in August 2017, with 411 mm. In the south, maximum precipitation occurred mainly in May, June, September or October depending on the year.
Epidemic periods in children < 5 years old
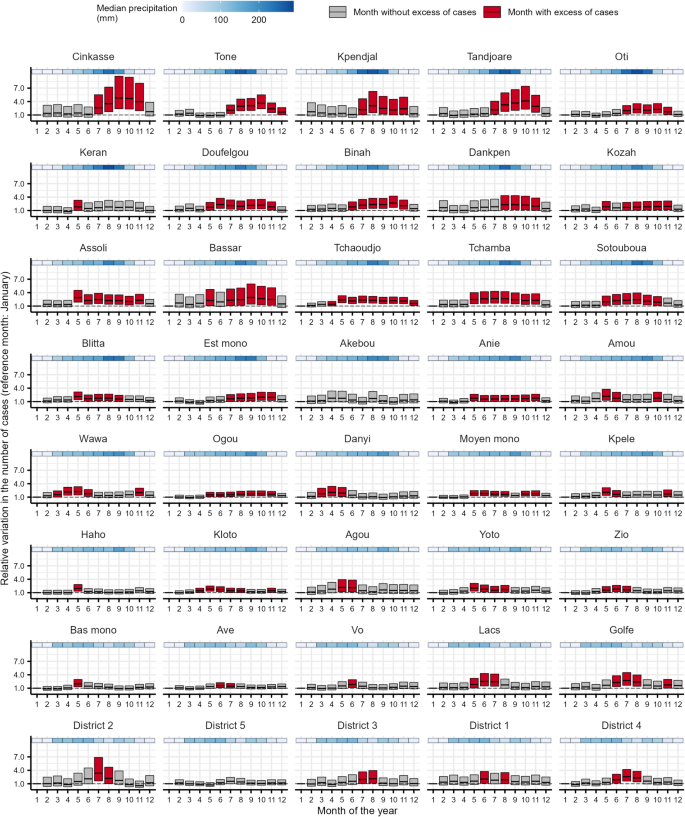
The monthly observed and predicted cases in children < 5 years old from 2013 to 2017 are shown in Figure S2 for each health district. In children < 5 years old, 29 health districts recorded one epidemic period per year, five health districts recorded two epidemic periods per year, one health district recorded three epidemic periods per year, and five health districts recorded no epidemic period (Fig. 2, Table S1). A time lag of at least one month was observed between the onset of precipitation and the start of the epidemic periods, except for the Wawa district. The duration of the epidemic periods varied from one to nine months. The maximum duration of an epidemic period was observed in the Kpele district from April to December.
In the health districts of the Savanes region, the epidemic periods were observed from July to November. The maximum relative increase in cases ranged from 168 to 347% and occurred in July, August or October.
In the health districts of the Kara region, the epidemic periods began between May and July, and ended in October or November. The maximum relative increase in cases occurred in July or August (increase ranging from 127 to 264%).
In the health districts of the Centrale region, the epidemic periods began in April or May, and ended between August and November. The months with the highest relative increase in cases were May and July (increase of between 140 and 230%).
In the Plateaux region, some districts had one long epidemic period (from six to nine months), and other had several short epidemic periods (from one to five months) or a single month with an excess of cases compared to January. The maximum relative increase in cases ranged from 46 to 164%.
In the health districts of the Maritime region, the epidemic periods began in May or June and varied from one to seven months. The maximum relative increase in cases ranged from 52 to 130%.
In the Lome-commune region, only the District 2 recorded a one-month epidemic period in July with a relative increase in cases of 123%.
Relative variation in the number of confirmed malaria cases for each month of the year compared to January with its 95% confidence interval in children < 5 years old by health district in Togo, 2013–2017. Estimates were derived from generalised additive models. At the top left is the northernmost district and at the bottom right is the southernmost district
Epidemic periods in children ≥ 5 years old and adults
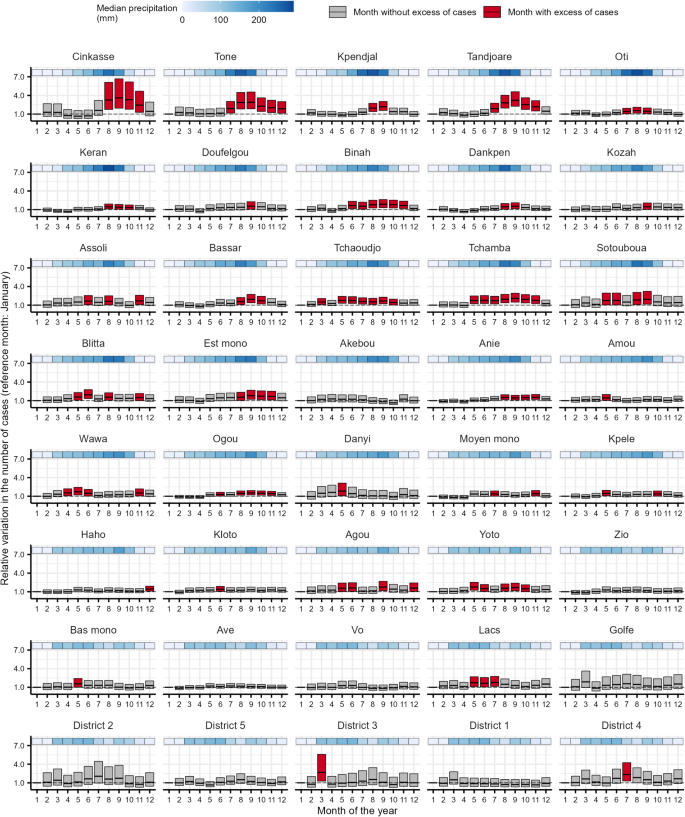
The monthly observed and predicted cases in children ≥ 5 years old and adults from 2013 to 2017 are shown in Figure S3 for each health district. In children ≥ 5 years old and adults, 29 health districts recorded one epidemic period per year, nine health districts recorded two epidemic periods per year, and two health districts recorded no epidemic period (Fig. 3, Table S2). A time lag of at least one month was observed between the onset of precipitation and the start of the epidemic periods, except for the Wawa and Danyi districts. The duration of the epidemic periods varied from one to nine months. The maximum duration of an epidemic period was observed in the Tchaoudjo district from April to December.
In the health districts of the Savanes region, the epidemic periods were observed from July to November or December. The maximum relative increase in cases ranged from 126 to 381% and occurred between August and October.
In the health districts of the Kara region, the epidemic periods began between May and August, and ended in November (except for the Keran district). The maximum relative increase in cases occurred in May, June or between August and November (increase ranging from 82 to 192%).
In the health districts of the Centrale region, the epidemic periods began in April or May, and ended between September and December. The months with the highest relative increase were May, July and August (increase of between 112 and 166%).
In the Plateaux region, some districts had one epidemic period from one to seven months, and other had several epidemic periods from one to five months. The maximum relative increase in cases ranged from 75 to 122% and occurred mainly in May or October.
In the health districts of the Maritime region, the epidemic periods began in May or June and varied from one to four months. The maximum relative increase in cases ranged from 57 to 172%.
In the health districts of the Lome-commune region, the epidemic periods began in June or July and varied from one to three months.
Relative variation in the number of confirmed malaria cases for each month of the year compared to January with its 95% confidence interval in children ≥ 5 years old and adults by health district in Togo, 2013–2017. Estimates were derived from generalised additive models. At the top left is the northernmost district and at the bottom right is the southernmost district
Epidemic periods in pregnant women
The monthly observed and predicted cases in pregnant women from 2013 to 2017 are shown in Figure S4 for each health district. In pregnant women, 22 health districts recorded one epidemic period per year, seven health districts recorded two epidemic periods per year, three health districts recorded three epidemic periods per year, and eight health districts recorded no epidemic period (Fig. 4, Table S3). A time lag of at least one month was observed between the onset of precipitation and the start of the epidemic periods, except for the Tchaoudjo district and the District 3. The duration of the epidemic periods varied from one to seven months. The maximum duration of an epidemic period was observed in the Tchamba district from May to November.
In the health districts of the Savanes region, the epidemic periods began in July or August, and ended between September and December. The maximum relative increase in cases ranged from 55 to 260% and occurred in August or September.
In the health districts of the other five regions, the epidemic periods did not follow a specific pattern as observed in the other target groups. A single long epidemic period was observed in the health districts of Binah, Tchamba, Est mono and Anie (4 to 7 months), while multiple short epidemic periods were observed in some health districts such as Assoli, Blitta or Agou. Of the 12 health districts in the Maritime and Lome-commune regions, seven districts recorded no epidemic period and three districts recorded a one-month epidemic period. In the health districts of these five regions, the maximum relative increase in cases ranged from 41 to 167%.
Relative variation in the number of confirmed malaria cases for each month of the year compared to January with its 95% confidence interval in pregnant women by health district in Togo, 2013–2017. Estimates were derived from generalised additive models. At the top left is the northernmost district and at the bottom right is the southernmost district