Baseline characteristics
In total, 17,718 subjects aged 20 years and older were finally eligible for analysis from the NHANES 1999–2018 in the current study, of whom 8914 (50.3%) were male, and the mean age was 50 ± 17.8 years. The participants’ baseline demographic, lifestyle, and clinical characteristics were summarized in Table 1 in accordance with their glucose metabolism status: NGR, pre-DM, and DM. Specifically, participants in the DM group tended to be older, with a significantly higher proportion of individuals aged 50 and above (80.7%) in contrast with the NGR (31.5%) and Pre-DM (57.3%) groups. They also exhibited lower educational attainment and PIR levels, higher proportions of former and current smokers, former drinkers, a higher prevalence of hypertension, and higher proportions of lipid-lowering therapy. Individuals with DM also exhibited significantly elevated levels of BMI, TG, fasting glucose, and HbA1c, as well as lower levels of TC, LDL-C, and HDL-C. Furthermore, the median values of the abdominal obesity indices—VAI, LAP, and WC—were considerably elevated in the DM group, indicating greater abdominal adiposity (Table 1).
Meanwhile, the study population was classified into four subgroups according to the quartile concentrations of the three abdominal obesity indices (Table S1, S2, and S3). Participants in the higher quartile of VAI, compared to those in the lower quartiles, were more likely to be older, female, white, have hypertension, Pre-DM, or DM, and were less likely to be never smokers. They also tended to have a high proportion of lower educational attainment and lower PIR, along with elevated levels of BMI, TC, TG, glucose, HbA1c, LAP, and WC, as well as lower levels of HDL-C (Table S1, all p for trend < 0.001). Additionally, in contrast with those in the lower quartiles, individuals in the higher quartiles of LAP and WC tended to be older, white, had higher proportions of former smokers and former drinkers, and were more likely to with lipid-lowering therapy, hypertension, and DM. They also presented elevated levels of BMI, TC, TG, glucose, and HbA1c, along with reduced levels of HDL-C (Table S2, S3, all p for trend < 0.001). Participants who experienced all-cause mortality were more likely to have pre-DM or DM and exhibited elevated levels of VAI, LAP, and WC compared to those who remained alive (Table S4, all p < 0.001).
Glucose metabolism status, abdominal obesity indices, all-cause and CVD mortality
Over a median follow-up duration of 9.4 years, a cumulative total of 2,685 deaths were documented, with 846 deaths attributable to CVD. The all-cause mortality rates in the NGR, pre-DM, and DM groups were 9.93%, 15.73%, and 26.63%, respectively, while the corresponding CVD mortality rates were 2.78%, 5.02%, and 9.12%. Kaplan-Meier analysis revealed a significant decline in survival rates for both all-cause and CVD mortality across glucose metabolism groups, from NGR to pre-DM and DM. (Figure S2A and S2B, all p < 0.001). Similarly, participants in the higher quartiles of VAI, LAP, and WC had lower event-free survival rates for both all-cause and CVD mortality, in contrast with those in the lower quartiles. (Figure S2C-S2H, all p < 0.001).
Univariate Cox regression models demonstrated that participants with pre-DM or DM had a considerably elevated risk of all-cause and CVD mortality as opposed to individuals with NGR. These relationships stayed consistent notwithstanding adjusting for multiple potential confounders, indicating the independent effect of glucose metabolism status on mortality risk (Table 2, all p < 0.01). In addition, participants in the highest quartiles of WC demonstrated considerably heightened risks of both all-cause and CVD mortality when contrasted with individuals in the lowest quartile after multivariable adjustment. These associations remained robust when WC was analyzed as continuous variables, further confirming their predictive value (Table 2, all p < 0.05). The LAP was correlated only with all-cause mortality and showed no association with cardiovascular mortality when analyzed as a continuous variable (Table 2). However, after multivariable adjustment, no significant differences were observed in the associations between VAI quartiles and mortality outcomes (Table 2, all p > 0.05). RCS analysis revealed linear relationships between LAP and WC with the risk of all-cause mortality, and between WC and the risk of CVD mortality in the study population (Figure S3-S4, all p for non-linear > 0.05).
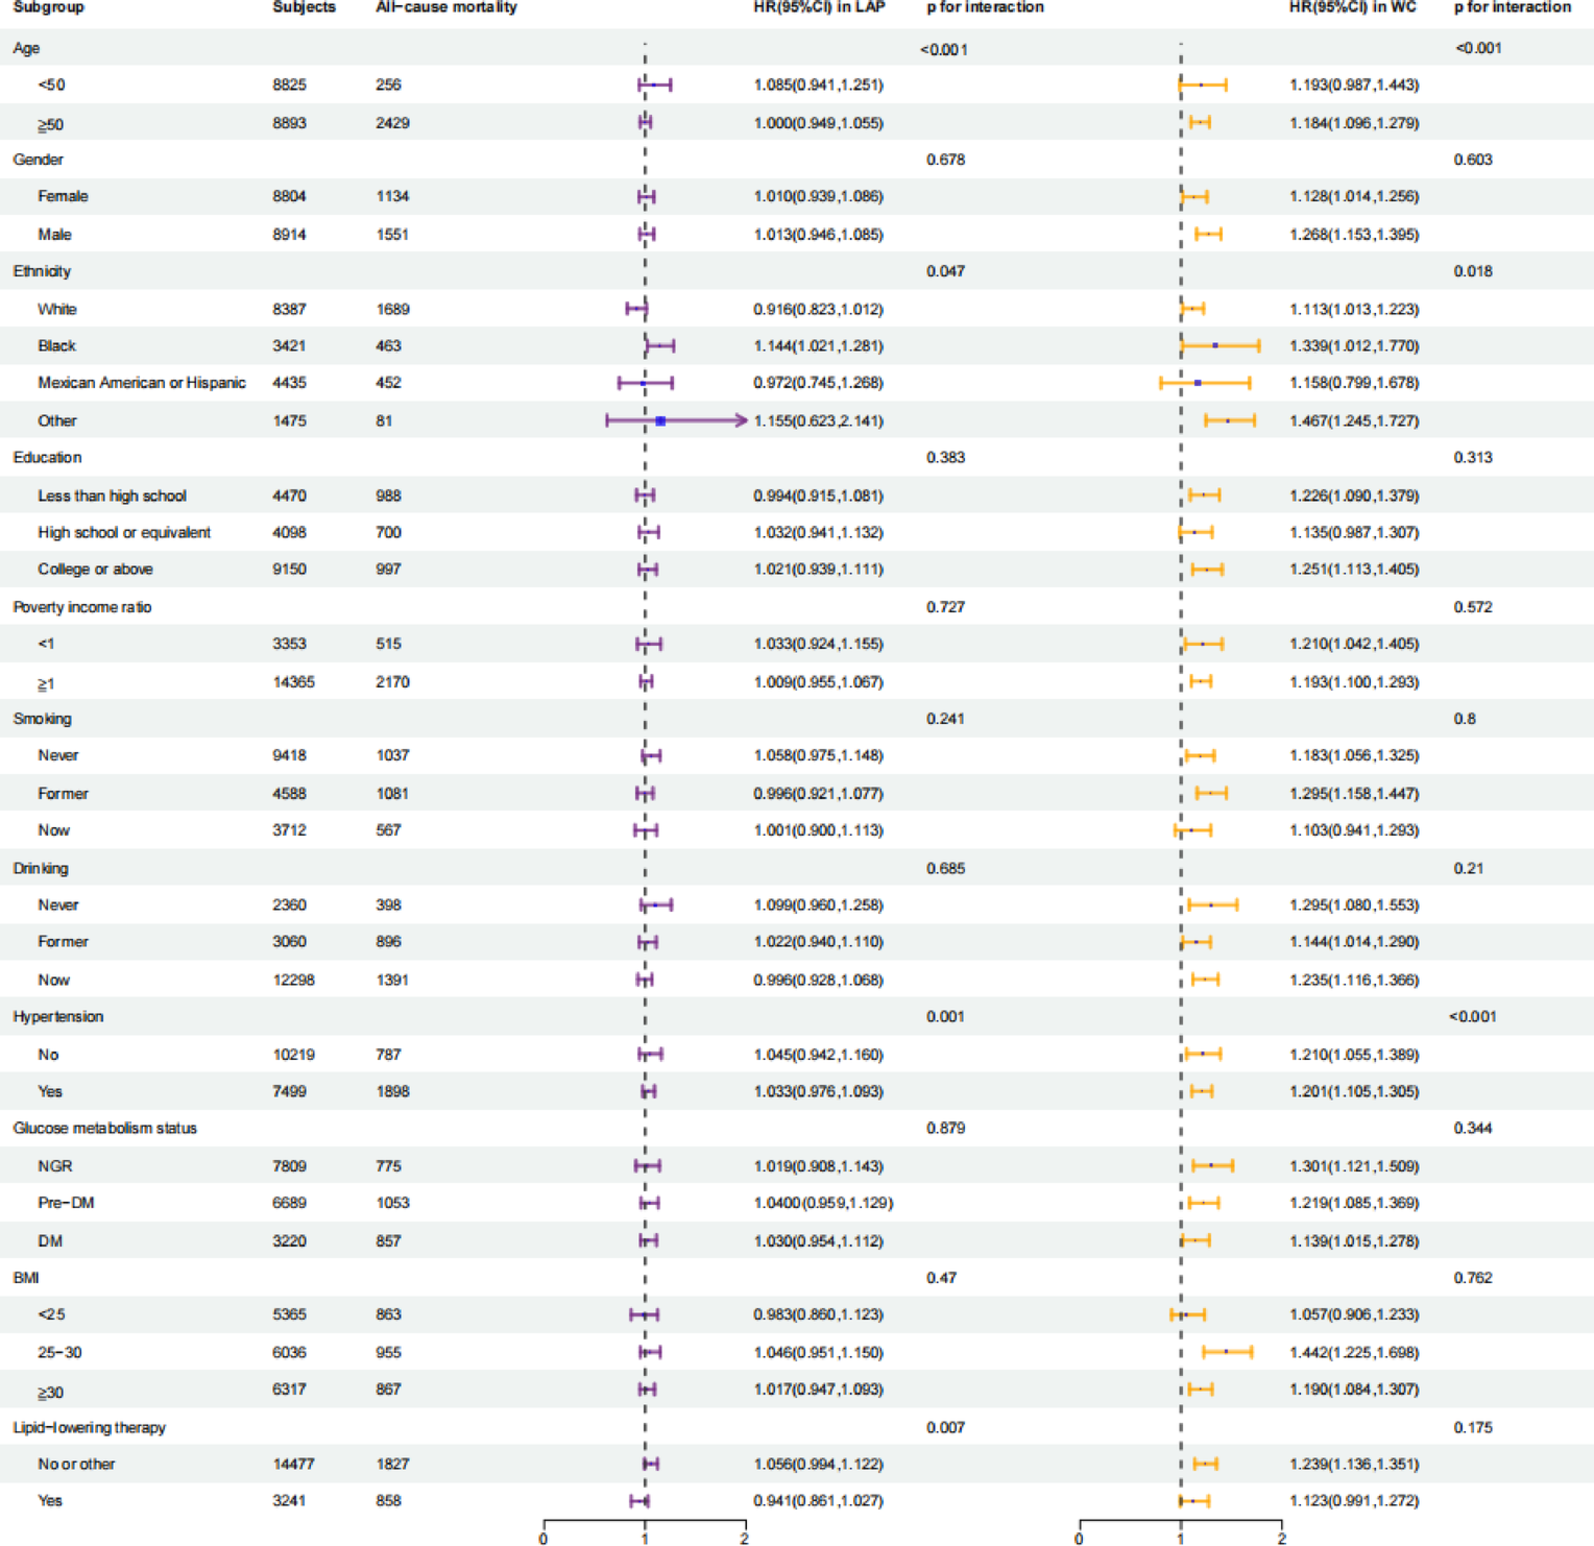
Stratified analyses revealed significant interactions of HR per 1-SD increase in LAP and WC with age, ethnicity, and hypertension for all-cause mortality risk (Fig. 1, all p for interaction < 0.05). Additionally, WC exhibited significant interactions with age and hypertension for CVD mortality risk (Figure S5, p for interaction < 0.05). Specifically, the relationships of LAP and WC with all-cause mortality were stronger in participants under the age of 50 compared with those of 50 years of age and above. Furthermore, Black participants exhibited a stronger association compared to White participants, and participants with hypertension had an elevated risk compared with individuals without hypertension (Fig. 1). Additionally, no interactions of the two abdominal obesity indices with all-cause mortality were observed across other subgroups (Fig. 1, all p for interaction > 0.05). These findings suggest that the associations between abdominal obesity indices and mortality may vary significantly across different demographic and clinical subgroups.
Associations of the hazard ratios for LAP (per-SD increase) and WC (per-SD increase) with all-cause mortality in different subgroups. Data were adjusted for age (< 50, ≥ 50 years), gender (male, female), ethnicity (White, Black, Mexican American or Hispanic, Other), education (less than high school, high school or equivalent, college or above), smoking (never, former, now), drinking (never, former, now), hypertension (no, yes), body mass index (< 25, 25–30, ≥ 30), lipid-lowering therapy, total cholesterol, low-density lipoprotein cholesterol, glucose and glycosylated hemoglobin A1c in multiple Cox regression analysis. CVD: cardiovascular disease; SD: standard deviation; HR: hazard ratio; CI confidence interval; LAP: lipid accumulation product; WC: waist circumference; NGR: normal glucose regulation; Pre-DM: pre-diabetes mellitus; DM: diabetes mellitus; BMI: body mass index. p < 0.05 suggests significant differences
Association of combined LAP, WC, and metabolic status with mortality risk
Given that only LAP and WC were related to elevated risks of all-cause mortality, we further investigated the predictive value of LAP and WC in combination with different glucose metabolism statuses for these outcomes. Kaplan-Meier analysis, stratifying participants by both glucose metabolism status and LAP or WC quartiles, demonstrated that individuals in the higher quartiles of LAP or WC exhibited significantly increased risks of all-cause and CVD mortality across all glucose metabolism statuses compared to the reference group (Fig. 2, p < 0.001). Furthermore, in fully adjusted Cox regression models, the HRs for all-cause mortality across the quartiles of LAP or WC, stratified by glucose metabolism status, are presented in Table 3. Notably, in comparison with the reference group, participants with pre-DM or DM who were in the highest LAP quartile exhibited a 1.397- and 1.936-fold elevated risk of all-cause mortality, respectively (Table 3, all p < 0.01). Furthermore, individuals in the highest quartile of WC had a 1.567- and 2.493-fold increased risk of all-cause mortality, and a 1.921- and 2.827-fold increased risk of CVD mortality in the pre-DM and DM groups, respectively (Table S5, all p < 0.01).
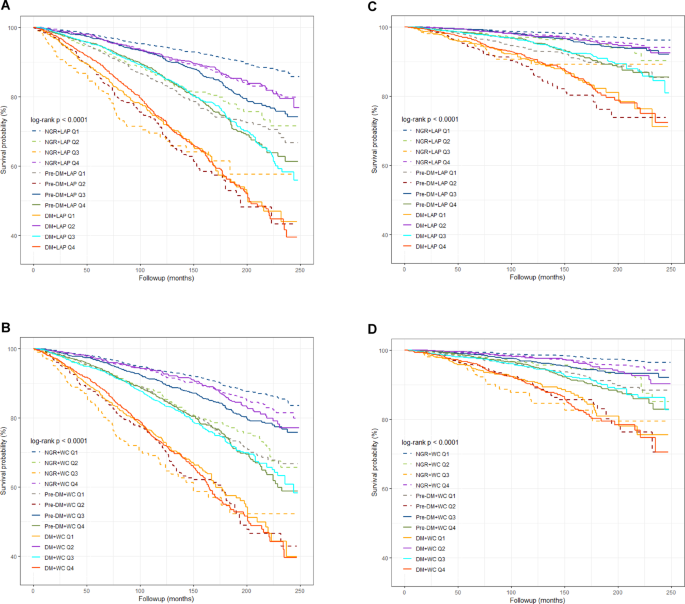
Kaplan-Meier analysis of all-cause (A and B) and CVD (C and D) mortality according to the status of the combination of LAP or WC quartiles and glucose metabolism. CVD: cardiovascular disease; LAP: lipid accumulation product; WC: waist circumference; NGR: normal glucose regulation; Pre-DM: pre-diabetes mellitus; DM: diabetes mellitus. p < 0.05 suggests significant differences
Risk prediction of LAP and WC for mortality in different glucose metabolism groups
The C-statistic was employed to evaluate the ability of the two abdominal obesity indices (LAP and WC) to predict mortality throughout various glucose metabolism statuses. In the Cox regression models, adding WC to the baseline models considerably enhanced the C-statistic for predicting all-cause mortality in participants with NGR and Pre-DM (Table S6, p < 0.05). However, adding LAP to the baseline models did not significantly enhance the prediction of all-cause mortality across different glucose metabolism statuses (Table S6, all p > 0.05). In addition, the inclusion of WC did not lead to a significant improvement in the C-statistic for predicting CVD mortality (Table S7, p > 0.05).