Study population
The data utilized in this study were obtained from the National Health and Nutrition Examination Survey (NHANES) database, constructed every two years from cross-sectional surveys conducted by the U.S. Centers for Disease Control and Prevention (CDC) between 2001 and 2008. It is noteworthy that the NHANES study protocol was approved by the National Center for Health Statistics (NCHS) Ethics Review Board, and all participants signed an informed consent form. By NIH policy, the NHANES data could be used directly for data analysis without additional review by the institutional ethics committee, as the NHANES data were not directly derived from participant contact.
At the study’s outset, data from 41,658 participants were included, derived from four consecutive cycles of the NHANES survey. The study’s inclusion criteria were as follows: men aged 65 years or older; completion of the Prostate Status Questionnaire; absence of a history of prostate cancer; availability of data necessary for complete FLI calculation; and comprehensive documentation of demographic characteristics and chronic medical history. Subsequently, some participants were excluded based on the following criteria: female, age less than 65 years, missing data related to prostate disease, diagnosed prostate cancer, missing indicators required for calculating the FLI, missing data on demographic characteristics, incomplete data on chronic diseases, and missing some biochemical indicators. Following the screening process, 1,875 participants were ultimately included in the study.
MASLD assessment
In the absence of data about the ultrasound assessment of hepatic steatosis and transient elastography of the liver during the follow-up phase of this study, the assessment of MASLD status was primarily based on the FLI [7]. The FLI was calculated according to the following formula:
$$:text{F}text{L}text{I}=frac{left({text{e}}^{0.953:times::text{ln}left(text{t}text{r}text{i}text{g}text{l}text{y}text{c}text{e}text{r}text{i}text{d}text{e}right):+:0.139:times:text{B}text{M}text{I}+0.718:times::text{ln}left(text{g}text{l}text{u}text{t}text{a}text{m}text{y}text{l}:text{t}text{r}text{a}text{n}text{s}text{p}text{e}text{p}text{t}text{i}text{d}text{a}text{s}text{e}right)+0.053:times:text{W}text{C}-15.745}right)}{left(1+:{text{e}}^{0.953:times::text{ln}left(text{t}text{r}text{i}text{g}text{l}text{y}text{c}text{e}text{r}text{i}text{d}text{e}right):+:0.139:times:text{B}text{M}text{I}+0.718:times::text{ln}left(text{g}text{l}text{u}text{t}text{a}text{m}text{y}text{l}:text{t}text{r}text{a}text{n}text{s}text{p}text{e}text{p}text{t}text{i}text{d}text{a}text{s}text{e}right)+0.053:times:text{W}text{C}-15.745}right)}:times:100$$
Previous studies have indicated that individuals with FLI values below 60 are at a lower risk of hepatic steatosis. In contrast, individuals with FLI values at or above 60 are at a higher risk and are diagnosed with hepatic steatosis [9]. Furthermore, a diagnosis of MASLD was confirmed if the following five cardiometabolic criteria were met: (1) Body mass index (BMI) ≥ 25 kg/m² or a waist circumference (WC) ≥ 94 cm in men and 80 cm in women; (2) Fasting plasma glucose (FPG) ≥ 100 mg/dL, or a two-hour post-load glucose level ≥ 140 mg/dL, or HbA1c ≥ 5.7%, or individuals diagnosed with diabetes mellitus (DM) or on glucose-lowering therapy for DM; (3) Blood pressure ≥ 130/85 mmHg, or on antihypertensive medication; (4) Triglyceride (TG) ≥ 150 mg/dL, or lipid-lowering therapy; (5) High-density lipoprotein cholesterol (HDL-c) < 40 mg/dL for males and < 50 mg/dL for females or the use of lipid-lowering medication [4].
BPH Assessment
The Prostate Status Questionnaire was employed during this study to assess the history of BPH. In particular, subjects who responded in the negative to the initial inquiry, “Have you ever been told by a doctor or health professional that you had an enlarged prostate gland?” were classified as having no history of BPH. If the answer was affirmative, the subject was further classified based on the second question, “Was it a benign enlargement -that is, not cancerous, also called benign prostatic hypertrophy?“. Those who responded in the affirmative were categorized as having a history of BPH.
Assessment of the TyG index
Following a minimum 8.5-hour fast, participants underwent TG and FPG measurements. To ensure data accuracy, an automated biochemical analyzer was utilized. Fasting blood glucose and triglyceride concentrations were measured strictly using standard operating procedures. The following scientifically validated formula was employed to calculate TyG [10]:
$$:text{T}text{y}text{G}=:text{ln}[text{T}text{G}:(text{m}text{g}/text{d}text{L}):times::text{F}text{P}text{G}:(text{m}text{g}/text{d}text{L})/2]$$
Assessment of covariates
A series of multivariate adjustment models were constructed in this study to investigate the effect of confounding variables on the relationship between FLI, MASLD, and BPH. The included covariates encompassed a multitude of sociodemographic characteristics, lifestyle habits, and chronic disease history, including age (years), race, level of education, marital status, alcohol consumption (yes/no), smoking status (yes/no), physical activity (vigorous/moderate/inactive), and history of chronic diseases such as DM, hypertension, coronary heart disease, and stroke.
Regarding racial classification, the data was divided into four distinct categories. The categories were as follows: Mexican American, non-Hispanic white, non-Hispanic black, and other races. Regarding educational attainment, the data is divided into three categories: below the 9th grade, between the 9th and 12th grades, and above the 12th grade. Marital status was dichotomized into two categories: cohabitation and solitude. About lifestyle habits, smoking status was determined by whether the participant had smoked at least 100 cigarettes in their lifetime and whether they were a current smoker. The consumption of alcohol was determined by whether the participant had consumed at least 12 alcoholic beverages of any type in any given year. The assessment of physical activity was based on the presence of two criteria: firstly, whether the participant had engaged in vigorous exercise that resulted in a significant increase in respiration or heart rate, and secondly, whether they had been involved in moderate-intensity exercise that resulted in a slight increase in respiration or heart rate. Regarding medical history variables, a history of diabetes was established based on whether the participant had been diagnosed with diabetes by a physician, had an FPG of 126 mg/dL or greater, or had an HbA1c of 6.5% or higher. Additionally, the use of diabetes medication or insulin was taken into account. A history of hypertension was established based on whether a physician had informed the participant that they had hypertension or were currently taking medication prescribed for hypertension. A history of coronary heart disease was dependent on whether the participant had been diagnosed with the condition by a physician or had experienced symptoms such as angina or a heart attack. A history of stroke was also dependent on whether a physician had informed the participant that they had suffered from such an episode.
Statistical analysis
For continuous variables, the normal distribution was assessed using the Kolmogorov-Smirnov test, which demonstrated that all continuous variables in this study did not conform to a normal distribution. Consequently, these variables were described using the median (25th and 75th percentiles) and analyzed for between-group differences using one-way ANOVA or the Kruskal-Wallis test. Categorical variables were presented as frequencies and percentages, and differences between groups were compared using chi-square tests.
We constructed logistic regression models to investigate the interrelationships between FLI, FLI quartiles, MASLD, and BPH and calculated the odds ratios (ORs) and their 95% confidence intervals (CIs). Three models were constructed to assess these relationships and address potential confounding variables accurately. Model 1 was unadjusted, while Model 2 was adjusted for age and race based on Model 1. Model 3 was further adjusted based on Model 2 by incorporating the variables of educational attainment, marital status, cigarette smoking, alcohol consumption, physical activity, diabetes, hypertension, coronary heart disease, and stroke. All logistic regression models were subjected to a multicollinearity assessment, and the variance inflation factors (VIF) were all found to be less than 1.5 (refer to the table below for specifics), indicating the absence of substantial multicollinearity issues. The model goodness-of-fit was verified by the Hosmer-Lemeshow test (p > 0.05), and the area under the receiver operating characteristic curve was 0.645, indicating good model discrimination. An E-value sensitivity analysis was performed to assess the impact of unmeasured confounders. This quantitative metric indicates the necessity of an unmeasured confounder associated with both exposure (FLI/MASLD) and outcome (BPH), with a risk ratio of at least an E-value to fully explain the currently observed association.
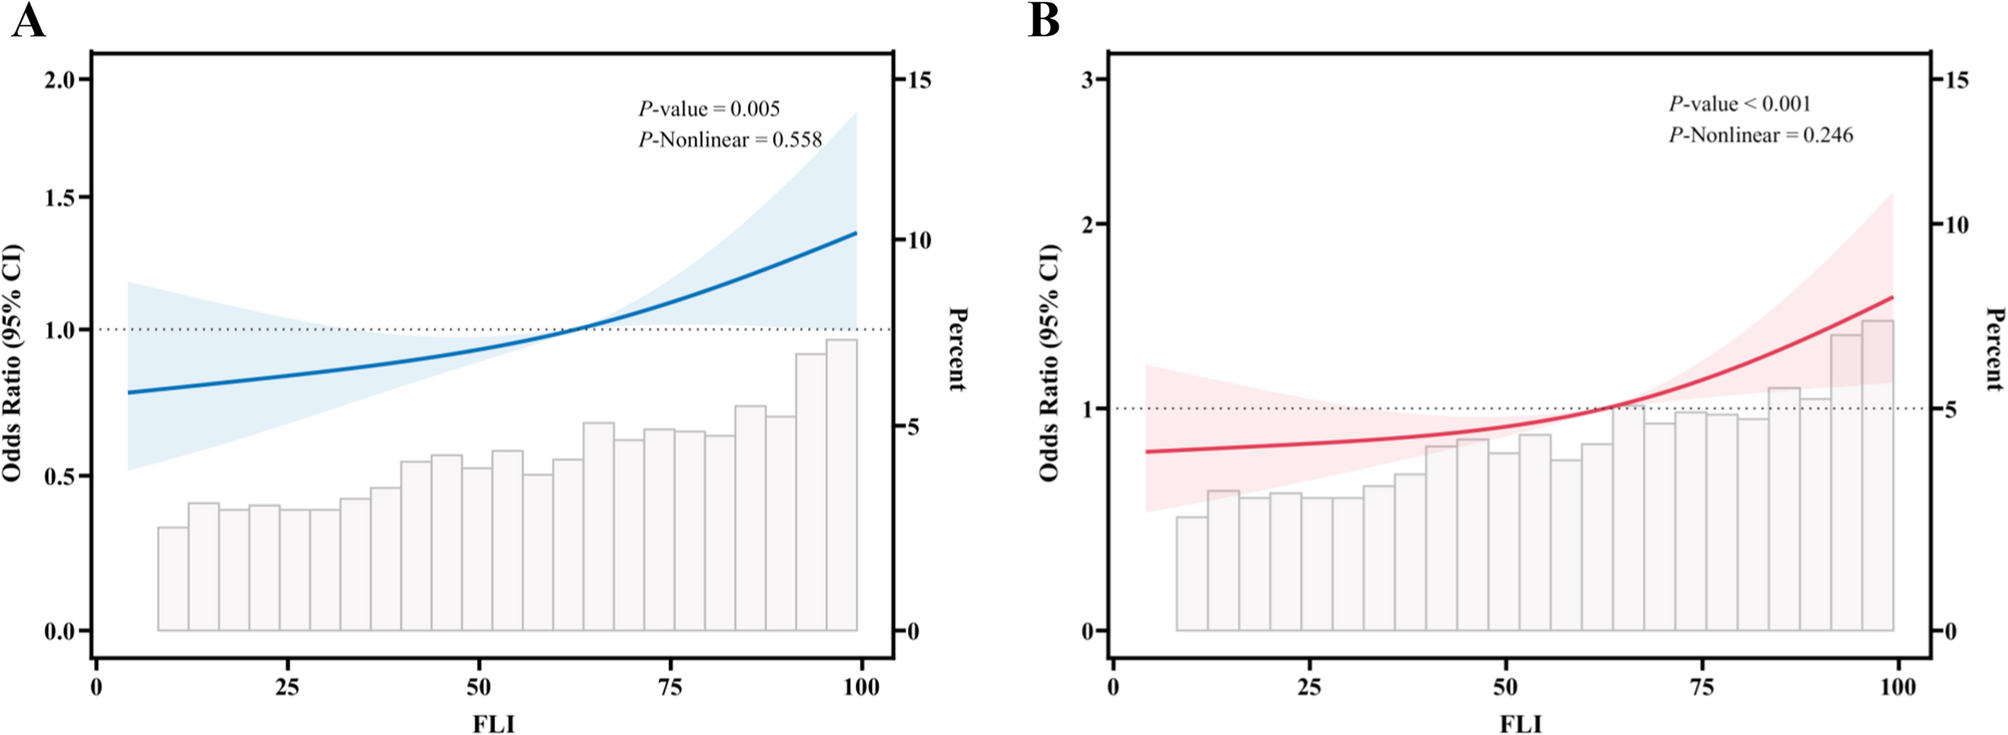
Furthermore, we employed restricted cubic spline curve (RCS) modeling to investigate the potential dose-response relationship between FLI and BPH. To further analyze the relationship between FLI, MASLD, and BPH risk in different subgroups, we performed stratification and interaction analyses based on race, education, marital status, smoking, alcohol consumption, physical activity, diabetes mellitus, hypertension, coronary heart disease, and stroke.
All statistical analyses were conducted using two-sided tests, with a P-value of less than 0.05 considered statistically significant. All statistical analyses were conducted using R 4.4.0 (courtesy of the R Foundation, http://www.R-project.org) and SPSS version 23.0 (IBM Corp., Armonk, NY, USA). Graphical representations were generated using GraphPad Prism version 9.0 (GraphPad Software, Inc., USA).