Population characteristics
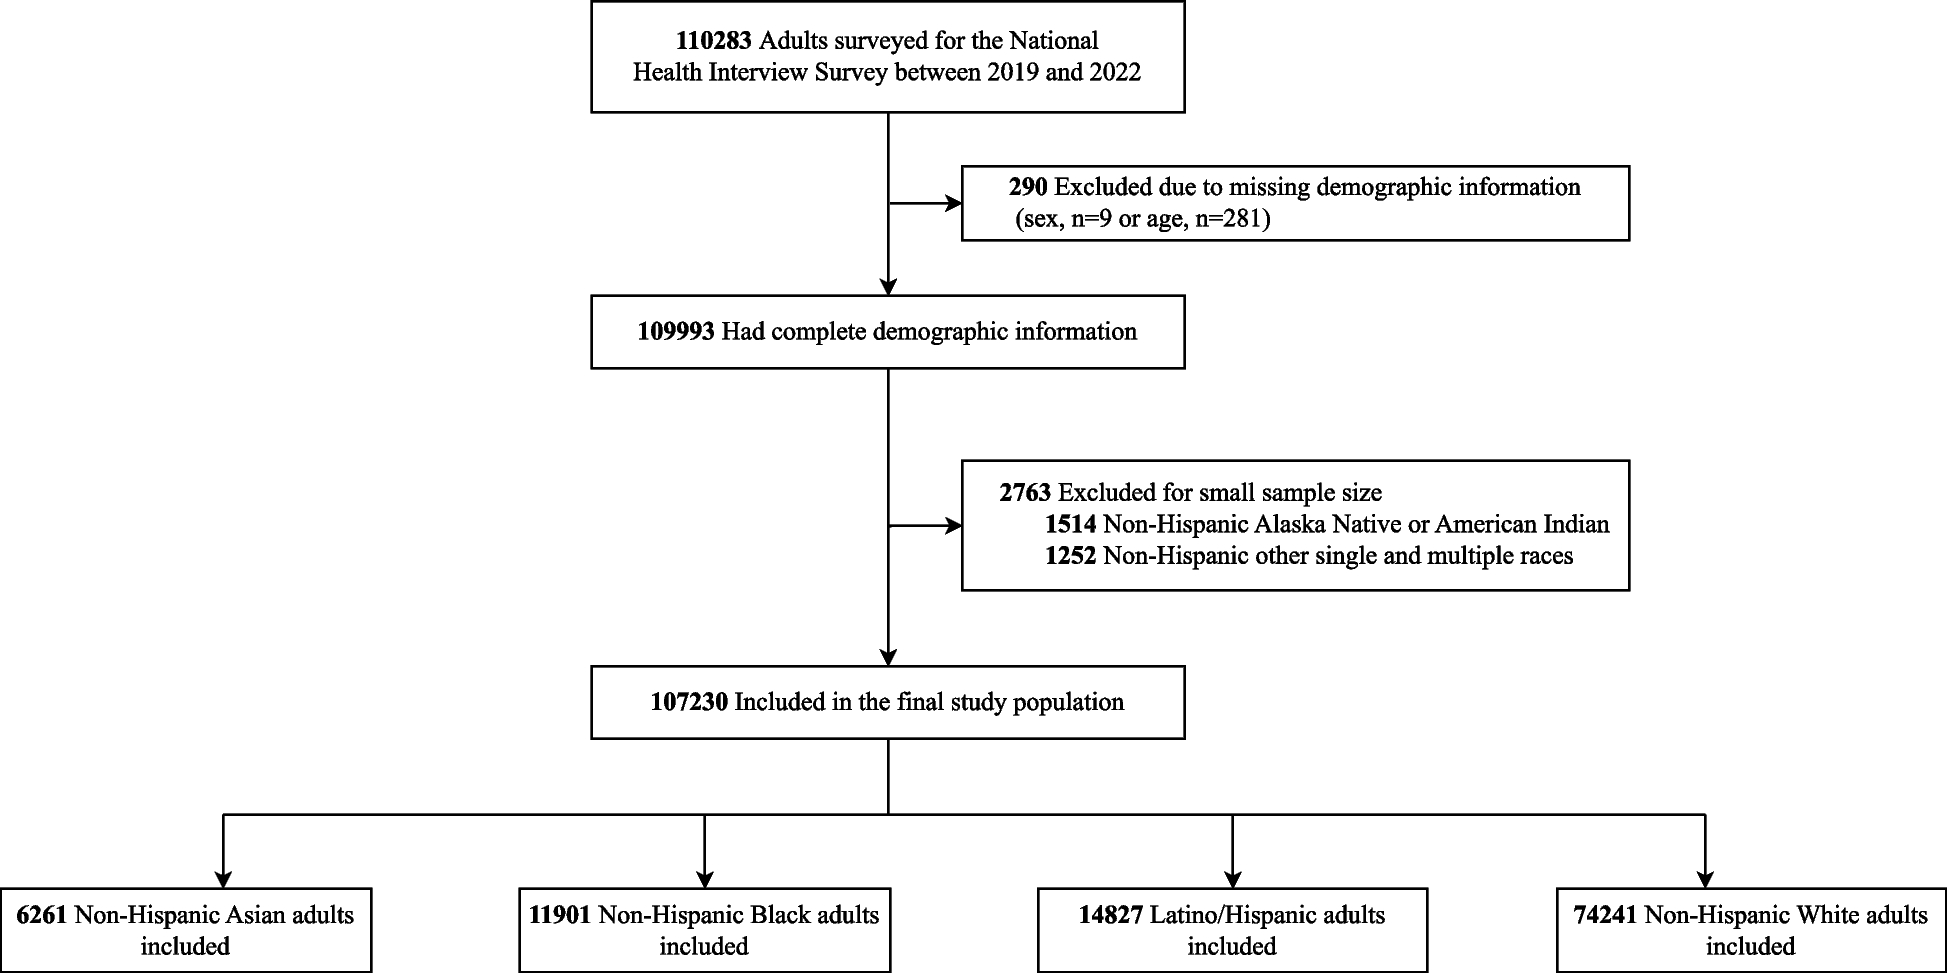
The study population initially included 110,283 NHIS adults between 2019 and 2022, from which we excluded 290 individuals with missing demographic information and 2763 individuals who identified their primary race as American Indian or Alaskan Native, did not identify as Latino/Hispanic and did not select a primary race, or identified their primary race as other because of small sample numbers (Fig. 1). The final sample size included 107,230 adults, of whom 6.1% were Asian, 12.1% were Black, 17.3% were Latino/Hispanic, and 64.5% were White. The characteristics of study population stratified by race and ethnicity is shown in Table 1. The year-specific participant number is presented in Additional file 2: Fig. S1. The estimated prevalence of low income was 24.8% (95% CI, 23.6% to 26.8%) among Asian individuals, 42.9% (95% CI, 41.1% to 44.6%) among Black individuals, 51.3% (95% CI, 50.2% to 52.4%) among Latino/Hispanic individuals, and 46.0% (95% CI, 44.3% to 47.6%) among White individuals. From 2019 to 2022, there were no significant changes in the proportion of individuals with low income among Asian and White participants (P > 0.05), while the estimated prevalence of low income changed by − 0.97 points (95% CI, − 1.38 to − 0.55; P = 0.010) among Black individuals and by − 1.38 points (95% CI, − 2.04 to − 0.71; P = 0.012) among Latino/Hispanic individuals (Additional file 2: Fig. S2). The overall adjusted trends in each self-reported health outcome and health care assess are shown in Additional file 2: Fig. S3, indicating an overall increase in clinician-diagnosed depression or anxiety disorders and some measures of health care access during the pandemic era. The rates of missingness were less than 1.1% for each outcome (Additional file 1: Table S2).
Study population selection
Health status
Poor or fair health status
In 2019, the estimated percentage of poor or fair health status was 21.6% (95% CI, 19.7%–23.6%) among Black individuals, 21.7% (95% CI, 19.6%–23.9%) among Latino/Hispanic individuals, 13.7% (95% CI, 13.0%–14.3%) among White individuals, and 9.6% (95% CI, 7.8%–11.8%) among Asian individuals (Fig. 2; Additional file 1: Table S3). Between 2019 and 2022, there was no significant change in the estimated prevalence of poor or fair health status across all racial/ethnic groups (Table 2) and no significant change in the estimated gap between White compared to any of the other race/ethnicities (P = 0.45, P = 0.44, and P = 0.38, respectively) (Table 3). Black individuals with low income had the highest prevalence of poor or fair health status (30.9% [95% CI, 27.8%–34.3%] in 2019 and 28.4% [95% CI, 25.1% to 32.0%] in 2022), while Asian individuals with middle and high income had the lowest prevalence (7.9% [95% CI, 6.0%–10.2%] in 2019 and 8.5% [95% CI, 6.7% to 10.8%] in 2022) (Additional file 2: Fig. S4; Additional file 1: Table S3). When stratified by income, there was no significant change in the estimated prevalence of poor or fair health status across all racial/ethnic groups and no significant change in the estimated gap between White and other racial/ethnic groups (Tables 2 and 3). There was no significant linear trend in poor or fair health status by race/ethnicity and income from 2019 to 2020 (Additional file 1: Table S4); however, trends in difference between Asian and White individuals increased (+ 0.38 [95% CI, + 0.30 to + 0.47] percentage points; P = 0.003) and trends in difference between Black and White individuals decreased (− 0.41 [95% CI, − 0.82 to − 0.01] percentage points; P = 0.048; Additional file 1: Table S5).
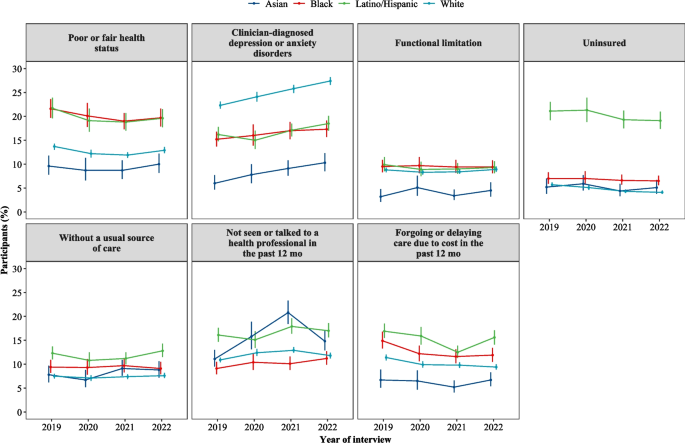
Trends of self-reported poor or fair health status, clinician-diagnosed depression or anxiety disorders, functional limitation, health care access, utilization, and affordability measures by race and ethnicity, 2019–2022
Clinician-diagnosed depression or anxiety disorders
In 2019, the estimated percentage of depression and/or anxiety was 15.2% (95% CI, 13.7%–16.8%) among Black individuals, 16.2% (95% CI, 14.8%–17.8%) among Latino/Hispanic individuals, 22.3% (95% CI, 21.6%–23.1%) among White individuals, and 6.0% (95% CI, 4.7%–7.7%) among Asian individuals (Fig. 2; Additional file 1: Table S6). Between 2019 and 2022, the estimated prevalence of clinician-diagnosed depression or anxiety disorders increased significantly for White individuals, irrespective of income level (P < 0.001 for all), and for Asian, Black, and Latino/Hispanic individuals with middle and high income (P = 0.003, P = 0.003, and P = 0.001, respectively) (Table 2). Between 2019 and 2022, the estimated gap in the prevalence of clinician-diagnosed depression or anxiety disorders when comparing White vs. Black and Latino/Hispanic individuals significantly widened (P = 0.03 and P = 0.03, respectively) (Table 3). White individuals with low income had the highest prevalence of clinician-diagnosed depression or anxiety disorders (32.6% [95% CI, 30.8%–34.4%] in 2019 and 38.2% [95% CI, 36.4%–40.1%] in 2022), while Asian individuals with middle and high income had the lowest (5.1% [95% CI, 3.7%–7.0%] in 2019 and 9.0% [95% CI, 7.3% to 11.2%] in 2022) (Additional file 2: Fig. S4; Additional file 1: Table S6). When stratified by income, the estimated gap of clinician-diagnosed depression or anxiety disorders between White and Black and Latino/Hispanic individuals widened in those with low income (Tables 2 and 3). There was significant linear trend in clinician-diagnosed depression or anxiety disorders among Asian and White individuals regardless of income levels (Additional file 1: Table S4). Moreover, trends in difference between Black and White individuals decreased (− 0.94 [95% CI, − 1.24 to − 0.64] percentage points; P = 0.006; Additional file 1: Table S5).
Functional limitation
In 2019, the estimated percentage of functional limitation was 9.5% (95% CI, 8.3%–10.9%) among Black individuals, 9.9% (95% CI, 8.5%–11.5%) among Latino/Hispanic individuals, 8.8% (95% CI, 8.3%–9.3%) among White individuals, and 3.2% (95% CI, 2.1%–4.8%) among Asian individuals (Fig. 2; Additional file 1: Table S7). Between 2019 and 2022, there was no significant change in the estimated prevalence of functional limitation across all racial/ethnic groups (Table 2) and no significant change in the estimated gap between White and Asian or Black or Latino/Hispanic individuals (Table 3), with no significant differences across income groups. White individuals with low income had the highest prevalence of functional limitation (18.7% [95% CI, 17.3%–20.1%] in 2019 and 19.0% [95% CI, 17.4% to 20.8%] in 2022), while Asian individuals with middle and high income had the lowest (1.7% [95% CI, 1.1%–2.7%] in 2019 and 3.2% [95% CI, 2.0% to 5.1%] in 2022) (Additional file 2: Fig. S4; Additional file 1: Table S7). The trends in difference and gaps by race/ethnicity and income were similar when analyzing the annualized prevalence from 2019 to 2022 (Additional file 1: Tables S4 and S5).
Health care access, utilization, and affordability
Lack of health insurance
In 2019, the estimated percentage of people reported being uninsured was 7.0% (95% CI, 5.9%–8.3%) among Black individuals, 21.1% (95% CI, 19.2%–23.0%) among Latino/Hispanic individuals, 5.7% (95% CI, 5.3%–6.2%) among White individuals, and 5.2% (95% CI, 3.8%–7.0%) among Asian individuals (Fig. 2; Additional file 1: Table S8). Between 2019 and 2022, the estimated rates of uninsured people decreased significantly for White (P < 0.001), but not for other racial/ethnic subgroups, without significant differences across income groups (Table 2). Between 2019 and 2022, the estimated difference of uninsured prevalence between White and Asian and Black individuals with low income significantly enlarged (6.41 percentage points higher for Asian individuals [95% CI, 1.22–11.60], P = 0.02; and 3.51 percentage points higher for Black individuals [95% CI, 0.28–6.74], P = 0.03, respectively) (Table 3). In 2022, Latino/Hispanic individuals with low income were the most likely to be uninsured (28.3% [95% CI, 25.3%–31.6%]), while White individuals with middle and high income were least likely (3.4% [95% CI, 3.0%–3.7%]) (Additional file 2: Fig. S4; Additional file 1: Table S8). Trends in adjusted annualized rate of change in lack of health insurance increased in Asian individuals with low income, while decreasing in White individuals (Additional file 1: Table S4). Trends in the gap between Asian and White individuals with low income increased (+ 2.10 [95% CI, + 1.44 to + 2.76] percentage points; P = 0.005; Additional file 1: Table S5).
Lack of usual source of care
In 2019, the estimated percentage of people reported being without a usual source of care was 9.4% (95% CI, 8.2%–10.9%) among Black individuals, 12.3% (95% CI, 11.0%–13.7%) among Latino/Hispanic individuals, 7.5% (95% CI, 7.0%–8.0%) among White individuals, and 7.8% (95% CI, 6.2%–9.7%) among Asian individuals (Fig. 2; Additional file 1: Table S9). Between 2019 and 2022, the estimated prevalence of people without a usual source of care did not significantly change across the different racial/ethnic groups, irrespective of income (Table 2; Additional file 1: Table S4). Between 2019 and 2022, the estimated difference between White and Asian, Black, and Latino/Hispanic individuals also did not significantly change (Table 3; Additional file 1: Table S5).
Not seen or talked to a health professional in the past year
The estimated percentage of people who reported not having seen or talked to a health professional in the past year in 2019 was 9.1% (95% CI, 7.9%–10.5%) among Black individuals, 16.1% (95% CI, 14.7%–17.6%) among Latino/Hispanic individuals, 10.9% (95% CI, 10.4%–11.4%) among White individuals, and 11.1% (95% CI, 9.5%–13.0%) among Asian individuals (Fig. 2; Additional file 1: Table S10). Between 2019 and 2022, the estimated prevalence of people who did not see a health professional in the past year significantly increased for Asian, Black, and White (P = 0.007, P = 0.03, and P = 0.04, respectively) individuals. Similar results were observed in people with middle and high income. The differences between White and Black, and Latino/Hispanic individuals did not significantly change during the study period, but difference between Asian and White increased (2.89 percentage points [95% CI, 0.08–5.70], P = 0.04) (Table 3). There was no significant linear trend in the rate and differences for health care utilization (Additional file 1: Tables S4 and S5).
Foregone or delayed medical care due to cost
In 2019, the estimated percentage of individuals who reported having foregone or delayed medical care due to cost in the past 12 months was 14.9% (95% CI, 13.3%–16.8%) among Black individuals, 16.9% (95% CI, 15.5%–18.5%) among Latino/Hispanic individuals, 11.4% (95% CI, 10.8%–12.0%) among White individuals, and 6.7% (95% CI, 5.1%–8.9%) among Asian individuals (Fig. 2; Additional file 1: Table S11). Between 2019 and 2022, the estimated prevalence of foregone or delayed medical care due to cost significantly decreased in Black and White individuals with low income, but not Latino/Hispanic individuals (Table 2; Additional file 1: Table S4). The differences between White and Black, and Latino/Hispanic individuals did not significantly change during the study period (Table 3; Additional file 1: Table S5).