Demographics and clinical baseline characteristics
The SCM group and the Control group did not differ significantly in body mass index, gender, age, comorbidities (including coronary artery disease and diabetes), infection site (respiratory system, urinary system, etc.), diastolic blood pressure, and heart rate (P > 0.05). However, the SCM group displayed markedly higher SOFA scores (P = 0.047), cTnI (P < 0.001), and NT-proBNP (P = 0.004) levels in compared to both the Control group and the reference ranges, alongside remarkably lower systolic blood pressure (P < 0.001). These findings suggested more severe impairment in cardiac function and overall organ function in SCM patients(Table 1).
Analysis of the complete blood count
Compared to the Control group and the reference ranges, the SCM group demonstrated remarkably dropped lymphocyte and monocyte counts (P < 0.001), and notably elevated neutrophil counts (P < 0.001). Additionally, in comparison with the Control group, the MLR, NLR, PLR, and SII levels were evidently raised in the SCM group (P < 0.05). The SCM group and the Control group did not exhibit significant differences in platelet count, white blood cell count, hemoglobin, and red blood cell count (P > 0.05). These results suggest that SCM patients exhibit a heightened inflammatory response and a trend toward reduced lymphocyte counts (Table 2).
Analysis of inflammatory factor levels
In the SCM group, the TNF-α (P = 0.009), PCT (P = 0.014), IL-6 (P = 0.034), and CRP (P < 0.001) levels were notably upregulated as opposed to the Control group, indicating a stronger systemic inflammatory response in SCM patients(Table 3).
Analysis of potential risk factors for SCM
SOFA score, cTnI, NT-proBNP, neutrophil count, lymphocyte count, monocyte count, PLR, MLR, NLR, CRP, IL-6, PCT, SII, and TNF-α were all significant risk factors for SCM, as presented by univariate logistic regression analysis (P < 0.05). Identification of independent risk factors for SCM was conducted through multivariate logistic regression analysis(Table 4), including cTnI (OR = 4.548, 95% CI: 1.164–19.452, P = 0.041), NLR (OR = 4.231, 95% CI: 2.443–7.328, P < 0.001), and CRP (OR = 1.138, 95% CI: 1.061–1.221, P < 0.001). Although several variables such as PLR, PCT, IL-6, and TNF-α showed significance in univariate analysis, they were not included in the final model due to either overlapping predictive information or multicollinearity with other variables. We employed stepwise forward logistic regression for variable selection. Furthermore, we assessed the multicollinearity using variance inflation factor (VIF) analysis, and all variables retained in the final model (cTnI, NLR, and CRP) had VIF values less than 5, indicating low collinearity and good model stability.
Correlation between inflammatory markers and cardiac injury indicators
To explore the relationship between inflammatory indices and myocardial injury, we performed partial correlation analyses adjusted for SOFA score. As presented in Table 5, NLR exhibited a significant positive correlation with cTnI (r = 0.296, p = 0.0002) and a weaker but significant correlation with NT-proBNP (r = 0.165, p = 0.0377). CRP was also significantly correlated with cTnI (r = 0.277, p = 0.0004), while its association with NT-proBNP did not reach statistical significance (p = 0.0537). PLR showed a weaker but still significant association with cTnI (r = 0.215, p = 0.0066), but no significant correlation with NT-proBNP (p = 0.1612).
ROC curve analysis for predicting SCM
The predictive capacity of CRP, PLR, and NLR combined, as determined by ROC curve analysis, resulted in an AUC of 0.962, with sensitivity and specificity values of 91.5% and 93.3%, respectively. The optimal cut-off value for the combined prediction was 0.635, determined using the Youden index. The ROC curve of the combined model showed a steep rise with minimal false positives, indicating excellent discriminative ability. For PLR, NLR, and CRP, the AUCs were 0.734 (95% CI: 0.648–0.819), 0.927 (95% CI: 0.888–0.966), and 0.804 (95% CI: 0.734–0.874), respectively. The comparative analysis between single markers and the combined model is summarized in Table 7, demonstrating the superior performance of the combined biomarker model in terms of AUC, sensitivity, and specificity. (Table 6) (Fig. 2). A detailed comparison of diagnostic metrics for individual and combined markers is presented in Table 7, demonstrating the added value of the combined approach.
ROC curves for the prediction of septic cardiomyopathy (SCM)
The predictive performance of cardiac troponin I (cTnI), neutrophil-to-lymphocyte ratio (NLR), platelet-to-lymphocyte ratio (PLR), and C-reactive protein (CRP) is shown. The combined model (NLR + PLR + CRP) demonstrated the highest diagnostic accuracy. The shaded areas represent the 95% confidence intervals for each curve. The combined model yielded AUC = 0.962, P < 0.001.
Comparative analysis revealed that NLR + PLR + CRP outperformed all two-marker combinations. Specifically, the three-marker model achieved significantly higher AUC values than NLR + CRP (AUC = 0.955, P = 0.034), NLR + PLR (AUC = 0.933, P = 0.029), and CRP + PLR (AUC = 0.843, P < 0.001).
To further assess model performance, a bootstrap-based calibration curve demonstrated good agreement between predicted and observed probabilities (Fig. 3), with a Brier score of 0.047, indicating excellent calibration.
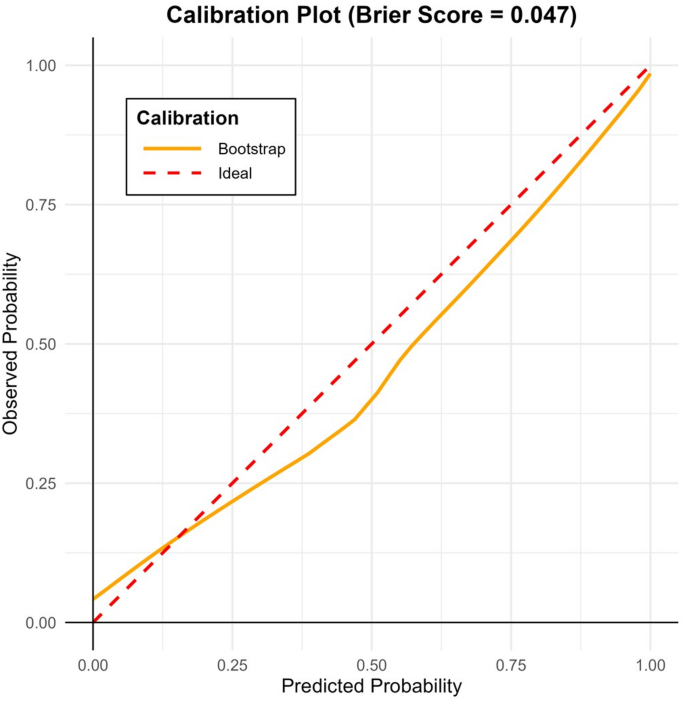
Calibration curve of the combined predictive model using 1,000-bootstrap resampling. The dashed red line represents the ideal calibration. The yellow curve shows the actual model performance, and the Brier score was 0.047, indicating good calibration accuracy