Study population
The study included subjects from two cohorts, the ARIC (Atherosclerosis Risk in Communities) and the CHS (The Cardiovascular Health Study). Details of the study have been described previously [8, 9]. The ARIC study is a community-based, biracial cohort established to investigate atherosclerosis etiology, clinical outcomes, and variations in cardiovascular risk factors, medical care, and disease. From 1987–1989, 15,792 participants aged 45–64 years were recruited from four US communities: Forsyth County, NC; Jackson, MS; suburban Minneapolis, MN; and Washington County, MD. Participants underwent baseline cardiovascular risk assessment and completed four in-person follow-up visits (1990–1992, 1993–1995, 1996–1998, 2011–2013). Semiannual telephone follow-up ascertained study endpoints. The CHS study is a prospective cohort study of coronary heart disease risk factors in older adults. It enrolled community-dwelling adults ≥ 65 years identified via Medicare eligibility lists from four US sites (North Carolina, California, Maryland, and Pennsylvania).An initial cohort (n = 5201) enrolled in 1989/1990, supplemented by a second cohort (n = 687) in 1992/1993. Annual clinic visits assessed demographics, medical history, hospitalizations, and lifestyle through 1998/1999. Continuous semiannual telephone interviews tracked health status, incident events, and mortality. Both of the two studies were approved by the Institutional Review Board, and informed consent signed by all subjects was obtained. The cohort data sets were obtained from the NIH Biologic Specimen and Data Repository Information Coordinating Center (BioLINCC) [10, 11].
Although ARIC and CHS were initiated to study atherosclerosis and cardiovascular risk in aging, respectively, both cohorts systematically collected incident arrhythmia data through standardized ECGs, hospital surveillance, and adjudication. Given the established role of cardiovascular risk factors in arrhythmogenesis, these cohorts provide a well-phenotyped platform for evaluating novel predictors of arrhythmias, including pulmonary function. Following the exclusion of participants with baseline cardiac arrhythmias (88 in ARIC; 62 in CHS), inadequate spirometry data (888 in ARIC; 850 in CHS), and missing follow-up for incident arrhythmias (1,887 in ARIC; 221 in CHS), the final analytical cohort included 12,929 ARIC participants and 4,755 CHS participants. This yielded an aggregate population of 17,684 individuals (9,592 women [54.2%]; 8,092 men [45.8%]).
Assessment of ventilatory parameters
For the present study, the main measures of lung function of interest were FEV1% predicted, FVC% predicted, and FEV1/FVC% predicted. FEV1% predicted was the volume of gas exhaled in the first second of expiration expressed as a percentage of the predicted value based on age, sex, and race and ethnicity according to recommendations from the Epidemiology Standardization Project. FVC% predicted represents the maximal volume of gas exhaled after maximal inspiratory expressed as a percentage of the predicted value. FEV1/FVC% predicted was derived as the ratio between the 2 values. At baseline, spirometry was conducted using a water-sealed Collins Survey Ⅱ volume displacement spirometer (Collins Medical, Inc.) and Pulmo-Screen Ⅱ software (PDS Healthcare Products, 496 Inc), as has been described previously in ARIC [12]. At least 3 acceptable spirograms were obtained from a minimum of 5 forced expirations, and the best single spirogram was identified by a computer and confirmed by a technician. Quality control was conducted carefully throughout the study. The spirometry protocols used in ARIC and CHS followed standardized procedures that are consistent with current American Thoracic Society (ATS) and European Respiratory Society (ERS) recommendations. Therefore, the lung function parameters derived from these cohorts remain directly comparable to those used in present-day clinical and epidemiological practice [13].
Pulmonary disease phenotypes were classified into 4 categories: Obstructive spirometry pattern: (FEV1/FVC ≤ lower limit of normal (LLN) without bronchodilator administration); Restrictive impairment pattern: (FEV1/FVC > LLN and FVC < LLN); Respiratory symptoms with normal spirometric results (without obstructive or restrictive impairment) and normal spirometry (without respiratory symptoms, obstructive, or restrictive impairment) [14].
Assessment of covariates
Interviewers collected information on age, race and ethnicity, sex, smoking status, education level, medical history, and other demographic factors. For smoking history, subjects identified themselves as current, former, or never smokers. Body mass index was calculated by dividing weight (kilograms) by height (meters) squared. In addition, diabetes, hypertension, coronary heart disease, chronic heart failure, and lung diseases at baseline were ascertained based on self-reported diseases and the ICD-9-CM codes. Medication use history was obtained by self-reported medication intake and by reviewing medication brought by subjects to their visit. Each medication was coded by trained and certified interviewers using a computerized medication classification system. The use of calcium antagonist, adrenergic β-agonists, and digoxin was examined as a potential confounder.
Race and ethnicity data were obtained through participant self-identification using fixed categories defined by the original cohort studies. Consistent with epidemiological best practices, these variables were analyzed as social constructs reflecting differential exposure to systemic inequities (e.g., structural racism, healthcare access barriers), not as biological determinants [15].
Outcome ascertainment
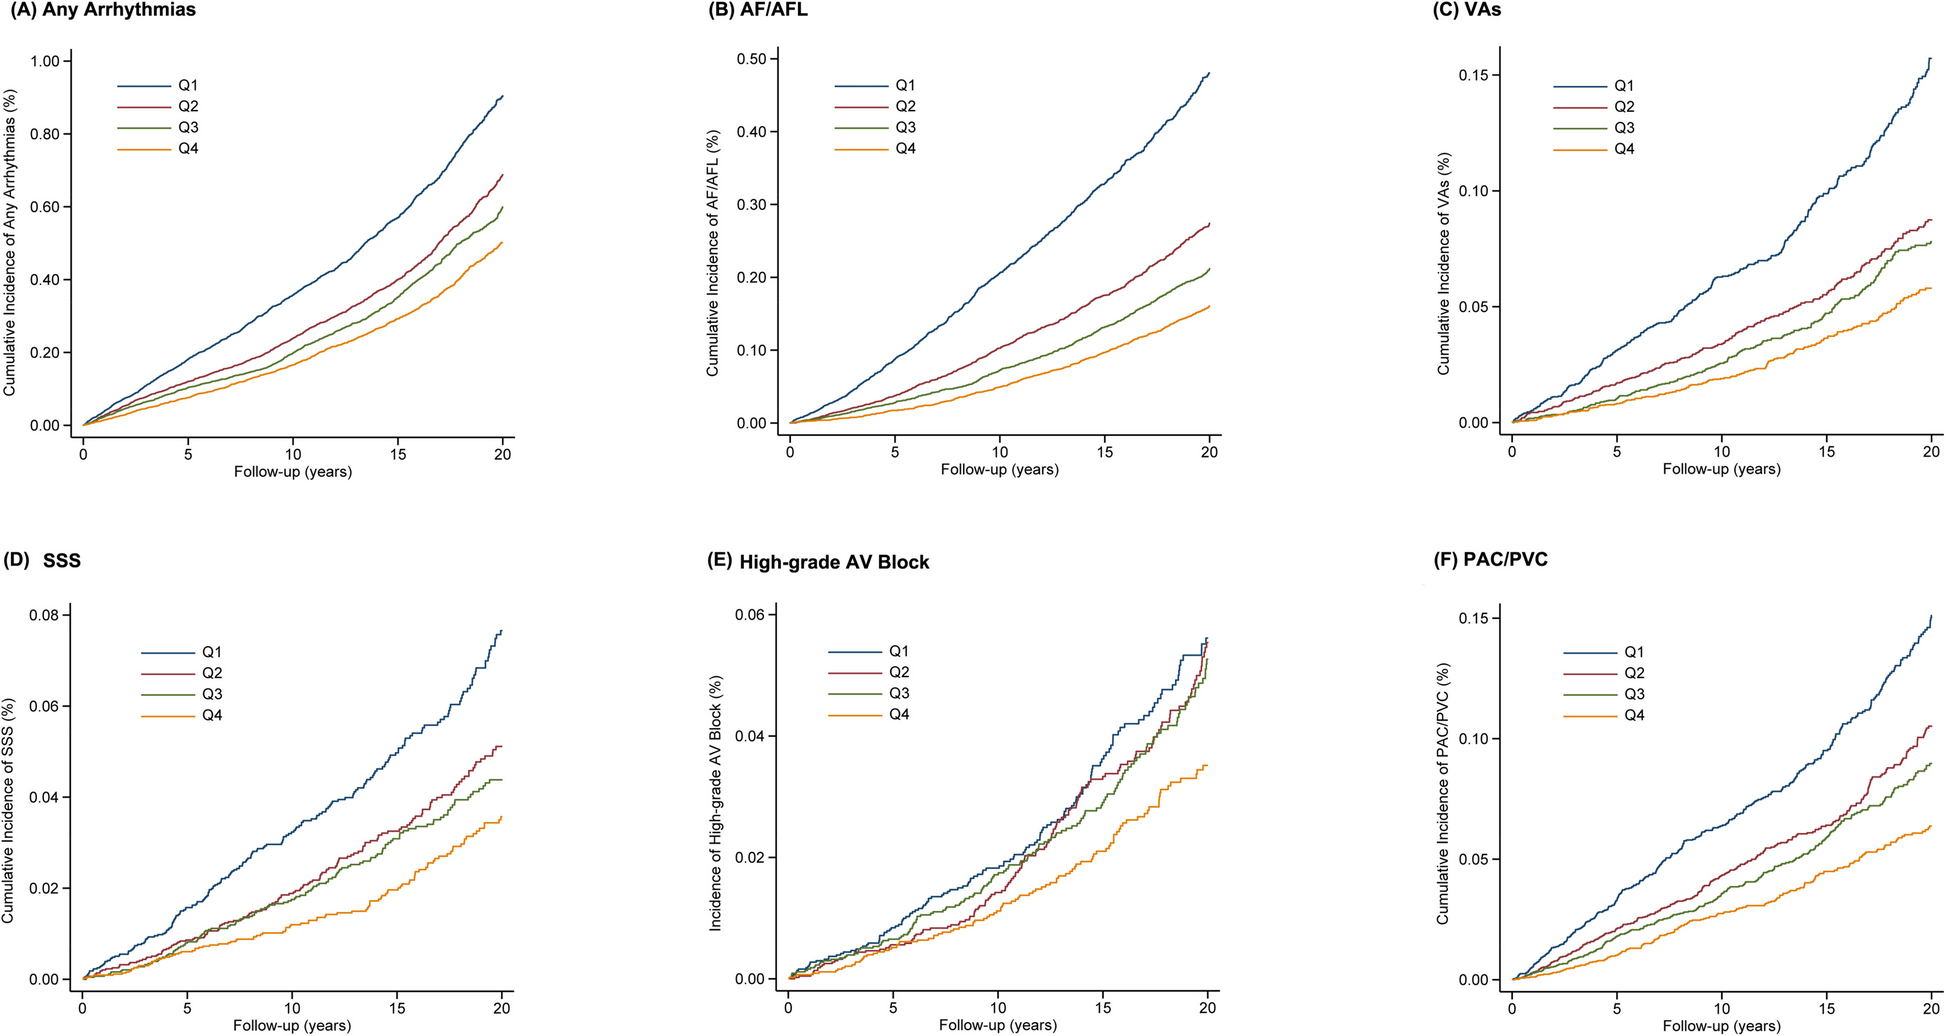
Primary outcomes comprised incident arrhythmias, including any arrhythmias, AF/AFL, VAs, high-grade AV block, SSS, and PAC/PVC. Although modern technologies such as wearable monitors have expanded arrhythmia detection, the core definitions of clinically significant arrhythmias-including atrial fibrillation, ventricular tachycardia, and bradyarrhythmia-have remained stable [16, 17]. Incident arrhythmia cases were ascertained from study visit electrocardiograms (ECGs), hospital discharge diagnoses, and death certificates. Using AF/AFL as an illustrative example, a 12-lead resting ECG was obtained at each study examination and transmitted to the ECG Reading Center for automated coding using the Marquette 12-SL program. AF/AFL detected automatically was subsequently adjudicated by a cardiologist. Hospitalizations during follow-up were identified via telephone interviews and surveillance of local hospitals, with trained abstractors collecting discharge diagnoses. The ascertainment of AF/AFL from hospital discharge codes has been validated in epidemiological studies. AF/AFL was defined by ICD-9-CM codes 427.31 (atrial fibrillation) or 427.32 (atrial flutter) in clinical records, or by ICD-9 427.3 or ICD-10 I48 codes listed as underlying or contributing causes of death on death certificates [18, 19]. VAs encompassed ventricular tachycardia (ICD-9-CM: 427.1), ventricular fibrillation/flutter (427.4, 427.41, 427.42), cardiac arrest (427.5), and sudden cardiac death [20]. Sudden cardiac death was defined underlying cardiac origin because of the absence of conditions clearly unrelated to cardiac arrhythmias [21]. High-grade AV block included second-degree (ICD-9-CM: 426.1, 426.10) or complete AV block (426.0) [3]. SSS was classified as ICD-9-CM 427.81 [22]. PAC/PVC were identified using ICD-9-CM codes 427.6, 427.60 (unspecified), 427.61 (atrial), and 427.69 (ventricular or other). The follow-up duration started from the time lung function was measured to the occurrence of the studied outcomes, death, loss to follow-up (informative censoring), or end of follow-up in the original cohorts (administrative censoring).
Statistical analysis
Participant characteristics were described according to quartiles of FEV1% predicted in the pooled cohort. Baseline variables were reported as mean and standard deviation for normally distributed data, and categorical variables were represented by proportion. Baseline characteristics were compared across FEV1% predicted quartiles using the chi-square test and one-way ANOVA test for categorical and continuous variables.
Multivariate Cox proportional hazard models were used to estimate the hazard ratios (HRs) and 95% confidence interval (CI) 1each type of arrhythmias with FEV1% predicted quartiles, FVC% predicted quartiles, and FEV1/FVC% predicted quartiles, respectively. The proportional hazards assumption was tested by plotting log (-log) survival curves and interaction with time, and no significant violation was present. For each arrhythmia endpoint, we ran a multivariate-adjusted model, with adjustment for sex, race and ethnicity, age, education level, history of hypertension, diabetes, prevalent coronary heart disease, heart failure, cigarette smoking, alcohol drinking, total cholesterol, high-density lipoprotein cholesterol, low-density lipoprotein cholesterol, triglycerides, fasting glucose, body mass index, systolic blood pressure, diastolic blood pressure, resting heart rate, QTc interval, left ventricular hypertrophy and use of cardiac medications. The covariates in the adjusted model are selected based on the known literature on potential factors that may be associated with abnormalities in cardiac arrhythmias. Kaplan–Meier survival curves were constructed to describe the cumulative incidence of individual outcome with different FEV1% predicted strata. With ventilatory parameters as continuous variables, we used restricted cubic splines with 5 knots placed at the 5th, 27.5th, 50th, 72.5th, and 95th percentile to assess the potential non-linear association of FEV1% predicted, FVC% predicted, and FEV1/FVC% predicted on arrhythmias. Adjusted Cox proportional hazard models were used to evaluate the association between pulmonary disease phenotypes and each type of arrhythmias separately.
In our primary analysis, missing data were addressed using full information maximum likelihood, assuming missingness at random. The proportion of missing values is detailed in Additional file 1: Table S1. The missing data of covariates were imputed via Markov Chain Monte Carlo (MCMC) multiple imputation prior to inclusion in fully adjusted models [23]. The imputation model incorporated total cholesterol, high-density lipoprotein cholesterol, low-density lipoprotein cholesterol, triglycerides, fasting glucose, body mass index, systolic blood pressure, diastolic blood pressure, resting heart rate, and QTc interval. Results from 10 imputation cycles were pooled to generate the final estimates.
To better evaluate the impact of different pulmonary disease phenotypes on the studied outcomes, PAFs were calculated using the equation pdi*[(HR-1)/HR] where pdi represents the proportion of total events in the population arising from the ith exposure category in comparison to the normal spirometry [24]. To further verify the robustness of our findings, we performed sensitivity analyses that included: (1) exclusion of participants with prevalent heart failure or coronary heart disease to mitigate confounding by these conditions; (2) restriction to individuals with complete covariate data; (3) reevaluation of adjusted associations between quartiles of FEV1, FVC, and FEV1/FVC with incident arrhythmia risk; (4) incorporation of time-updated covariates (measured during follow-up visits prior to arrhythmia onset) as time-dependent variables in extended Cox regression to address time-varying confounding; and (5) implementation of Fine-Gray subdistribution hazards models treating mortality as a competing risk, with censoring at death dates [25].
Consistent with established arrhythmia disparities across ethnic groups and by sex, stratified analyses were performed to evaluate potential effect modification by race and ethnicity and sex on ventilatory parameter-arrhythmia associations. Given smoking’s potential mediating role between pulmonary function and cardiovascular outcomes, subgroup analyses further examined smoking status. Multivariable Cox regression models separately assessed adjusted associations of FEV1% predicted, FVC% predicted, and FEV1/FVC% predicted quartiles with incident arrhythmia risk in ARIC and CHS cohorts. Likelihood ratio tests evaluated interactions between ventilatory parameters and (a) race and ethnicity, (b) sex, (c) smoking status, and (d) cohort. Where significant interactions emerged, subgroup-specific hazard ratios were derived from models incorporating relevant interaction terms [26].
All statistical analyses were performed with the Stata V.15.0. All p values were two-sides and p < 0.05 was considered statistically significant.