Baseline characteristics
The baseline characteristics of the participants in the study are shown in Table 1. In total, 3,778 people were included and arthritis was present in 36.3% of this population. In addition to the levels of sodium, and HDL, and ALB, there were significant differences in baseline parameters between the arthritis and non-arthritis groups. Participants in the arthritis group were older and had higher level of BMI, waist circumference, Hb, FBG, Alk, phosphorus, calcium, potassium, TC, TG, BUN, Scr, and UA than those in the non-arthritis group.
Association of female reproductive factor with arthritis
The RCS showed that U-shaped were found between AFB, and number of pregnancies with arthritis (P for nonlinear < 0.05; Fig. 2A, and C). However, non-linear association was not detected in this association (P for nonlinear > 0.05), which demonstrated that ALB, and number of live births is negatively correlated with the prevalence of arthritis (Fig. 2B, and D). Tables 2 and 3 also shown the results of multivariate logistic regression analyses for the association of AFB, ALB, and number of pregnancies, and live births with risk of arthritis. Compared to female individuals with AFB of ≤ 23 years old (reference group), the fully adjusted odds ratios (ORs) and 95% confidence intervals (CIs) in women with arthritis in 24–26, 27–29, 30–32, 33–35, ≥ 36 years were 0.88 (0.79, 0.99), 0.99 (0.86, 1.14), 0.95 (0.78, 1.16), 0.81 (0.62, 1.08), and 1.02 (0.71, 1.46), respectively. In addition, after controlling for underlying cofounders, compared to female individuals with ALB of ≤ 23 years old (reference group), the fully adjusted the ORs with 95% CIs for arthritis were 0.94 (0.84, 1.05), 0.84 (0.75, 0.94), 0.81 (0.72, 0.93), and 0.65 (0.53, 0.78) for 25–29, 0–34, 35–39, and ≥ 40 years (Table 2). Finally, after adjusting for interfering factors, in the fully adjusted model, the ORs with 95% CIs for association of number of pregnancies, and live births with arthritis across 3, 4 and ≥ 5 times were (0.91 (0.82, 1.02), 0.98 (0.88, 1.09), 1.03 (0.93, 1.14)) and (0.99 (0.90, 1.09), 0.96 (0.86, 1.08), and 0.96 (0.85, 1.08)), respectively, compared with ≤ 2 times (Table 3).
Restricted cubic spline curve for the association of female reproductive factor with the prevalence of arthritis. A Age at first birth and arthritis; (B) Age at last birth and arthritis; (C) number of pregnancies; (D) number of live births and arthritis. Abbreviations: OR, odd ratio; CI, confidence interval
Association of female reproductive factor with OA, RA, and other arthritis
The RCS model showed a nonlinear U-shaped association of AFB with OA, RA, and other arthritis (P for non-linearity < 0.05, Fig. 3A, B, and C). ALB was found to be U-shaped in relation to the prevalence of OA (P for non-linearity < 0.05), but linearly negative in relation to RA, and other arthritis (P for non-linearity > 0.05; Fig. 4A, B, and C). There was a negative linear correlation between number of pregnancies and other arthritis (P for non-linearity < 0.05; Fig. 5C), but a J-shaped correlation with OA, and RA (P for non-linearity < 0.05; Fig. 5A, and B). A negative linear correlation existed between number of live births and OA, and other arthritis (Fig. 6A, and C), but it was positively related to RA (Fig. 6B). Separate multivariate logistic regression analyses were conducted to examine the association of female reproductive factor with OA, RA, and other arthritis (Tables 4, 5, and 6).
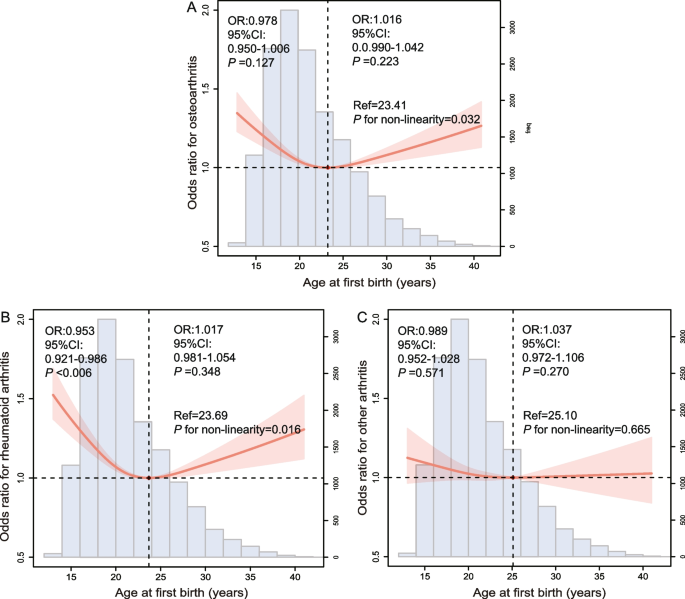
Restricted cubic spline curve for the association of age at first birth with the prevalence of osteoarthritis, rheumatoid arthritis, and other arthritis. Abbreviations: OR, odd ratio; CI, confidence interval
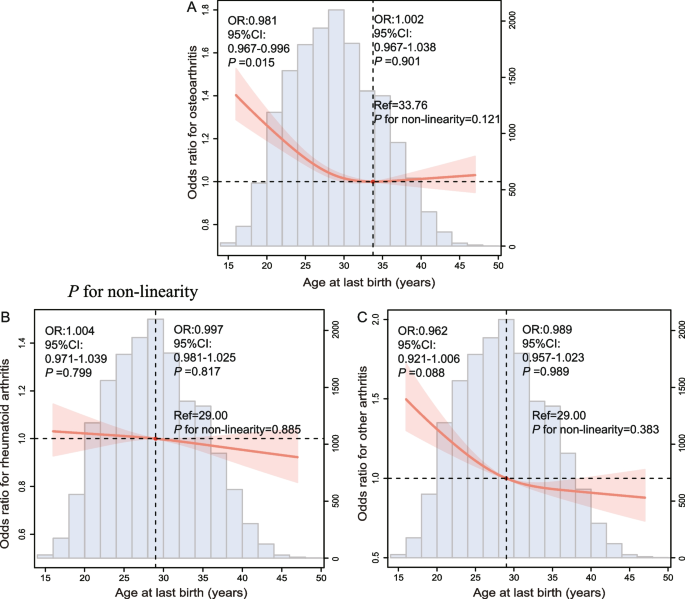
Restricted cubic spline curve for the association of age at last birth with the prevalence of osteoarthritis, rheumatoid arthritis, and other arthritis. Abbreviations: OR, odd ratio; CI, confidence interval
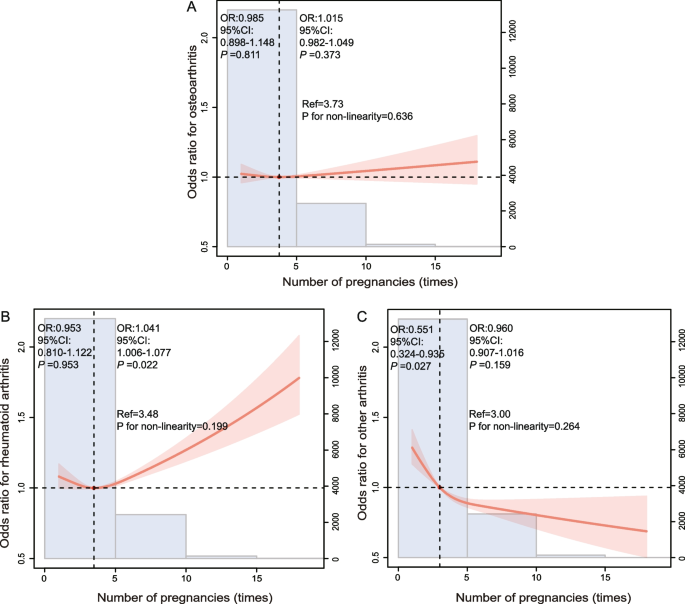
Restricted cubic spline curve for the association of number of pregnancies with the prevalence of osteoarthritis, rheumatoid arthritis, and other arthritis. Abbreviations: OR, odd ratio; CI, confidence interval
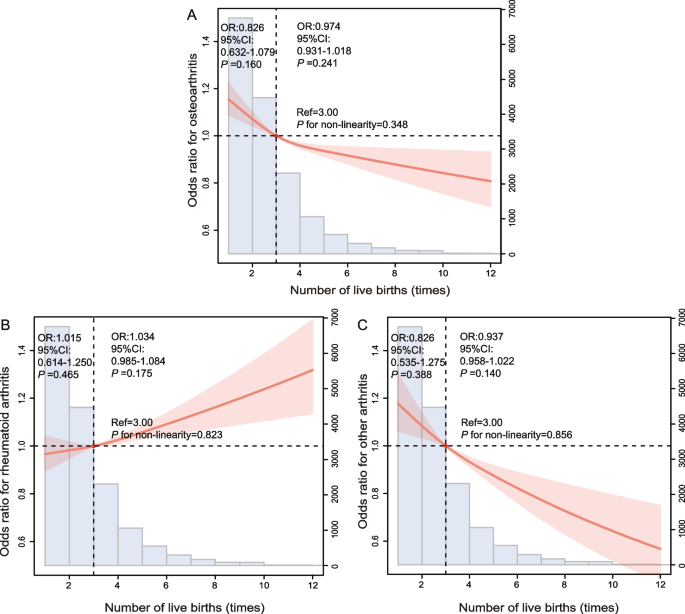
Restricted cubic spline curve for the association of number of live births with the prevalence of osteoarthritis, rheumatoid arthritis, and other arthritis. Abbreviations: OR, odd ratio; CI, confidence interval
Subgroup analyses
Subgroup analyses were carried out based on age (< 45 or ≥ 45 years), menopause status (no or yes), race/ethnicity (Non-Hispanic Black, Other Hispanic, Mexican American, Other Race, and Non-Hispanic White), age at menarche (< 12, 12–13, and > 13 years), ever used female hormone therapy (no or yes), and fertile lifespan (< 28, 28–35, and > 35 years) to find the association of AFB, ALB, number of live births, and pregnancies with prevalence of arthritis (Supplementary Table 1, 2, 3, and 4; Supplementary Fig. 1, 2, 3, and 4).