Data source
We used data from the Japanese Diagnosis Procedure Combination database [6]. This inpatient database contains information on the disease causing the admission, as well as the primary and comorbid diagnoses, which were recorded using the International Statistical Classification of Diseases and Related Health Problems, 10th Revision (ICD-10) codes. The Japanese Diagnosis Procedure Combination database also includes the following information: age, sex, height and weight, smoking status, and discharge status. In this database, documentation of each A-DROP parameter and pneumonia classification (CAP or hospital-acquired) is required for patients hospitalized with pneumonia. The A-DROP system [7], a CURB-65 modification for pneumonia severity classification, shows correlation with CURB-65. The A-DROP components comprise: (i) Age (men ≥ 70 years, women ≥ 75 years); (ii) Dehydration (blood urea nitrogen ≥ 21 mg/dL or clinical signs of dehydration); (iii) Respiratory failure (SpO₂ ≤ 90% or PaO₂ ≤ 60 Torr); (iv) Orientation disturbance (confusion); and (v) Pressure (systolic blood pressure ≤ 90 mmHg).
Study population and data
We selected patients with NTM-PD (ICD-10 codes: A31.0 and A31.9) aged ≥ 18 years who were hospitalized for pneumonia (J10.0, J11.0, J12–18, and A48.1) between April 1, 2012, and March 31, 2020. This period, which preceded the coronavirus disease 2019 (COVID-19) epidemic in Japan, was chosen for analysis. During the COVID-19 pandemic, it has been difficult to accurately assess the prognosis of CAP owing to insufficient medical care, including restricted access to health facilities for patients presenting with respiratory symptoms and fever. We excluded patients with human immunodeficiency virus infection (B20.0) and Mendelian susceptibility to mycobacterial diseases (D84.8), both conditions predisposing to disseminated NTM infection. Additionally, we excluded patients with missing A-DROP parameters.
We analyzed the first hospitalization during the study period as the index hospitalization. The following comorbidities were identified using ICD-10 codes: pulmonary aspergillosis (B44); chronic obstructive pulmonary disease (J43, J44.0, J44.1, and J44.9); interstitial lung disease (J84.1, J84.8, and J84.9); congestive heart failure (I11.0, I50.0, I50.1, and I50.9); cerebrovascular disease (I60–I69); renal disease (N00–N08 and N10–N19); autoimmune disease (M05, M06, M08, and M30–M35); diabetes mellitus (DM; E10–E14); and malignant neoplasm (C00–C97).
Category of BMI
We categorized patients into four BMI groups according to the World Health Organization classification: severely underweight (BMI < 16 kg/m2), mild-to-moderately underweight (16–18.4 kg/m2), normal weight (18.5–24.9 kg/m2), and overweight–obese (≥ 25.0 kg/m2).
Outcomes
The primary outcome was in-hospital mortality. The secondary outcomes were the length of hospital stay (excluding discharges due to death) and readmission for CAP within 1 year after discharge from the index hospitalization, identified using diagnostic codes.
Statistical analysis
We calculated summary statistics of patient characteristics by BMI category. Continuous variables were compared using the Kruskal–Wallis test, and categorical variables were compared using the chi-squared test.
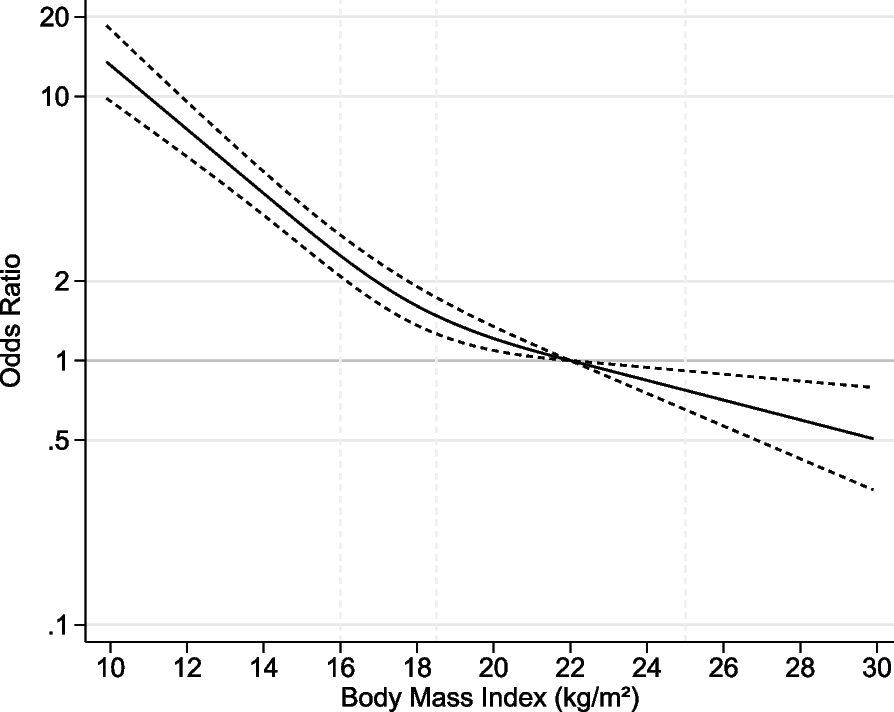
To ascertain any potential linear or non-linear association in the regression model and allow for flexible interpretation of the relation between BMI as a continuous variable and study outcomes, we evaluated continuous changes in BMI using shape-restricted cubic spline (RCS) regression models. All models were adjusted for age, sex, smoking history, clinical parameters included in the A-DROP system, and comorbidities. We placed three knots at the 10th, 50th, and 90th percentiles of BMI values [8]. For missing data on BMI and smoking history, we used multiple imputation under the missing-at-random assumption, which assumes that missingness depends only on observed variables. Multiple imputation introduces less bias than complete case analysis [9]. Missing data were imputed using the chained equations technique with 20 iterations [10], incorporating all variables. The results for each outcome were obtained using Rubin’s rules [11]. We conducted multivariate analysis for each outcome using generalized estimating equations to account for within-hospital clustering. Odds ratios (ORs) and 95% confidence intervals (CIs) for in-hospital mortality and readmission for pneumonia within 1 year were calculated for each BMI value, with a reference value of 22.0 kg/m2. For the RCS curve assessing the length of hospital stay, reference categories for binary variables were female sex and the absence of comorbidities or risk factors.
For sensitivity analysis, we performed a complete-case analysis, excluding patients with missing data. Statistical analyses were conducted using STATA/SE software (version 18.0; StataCorp LLC, College Station, TX, USA).
Ethics
The study was approved by the Institutional Review Board of the University of Tokyo and was conducted in accordance with the Declaration of Helsinki. The requirement for informed consent was waived because of data anonymity.