Thousands of differentially methylated CpGs characterize individual FTLD-TDP pathological subtypes
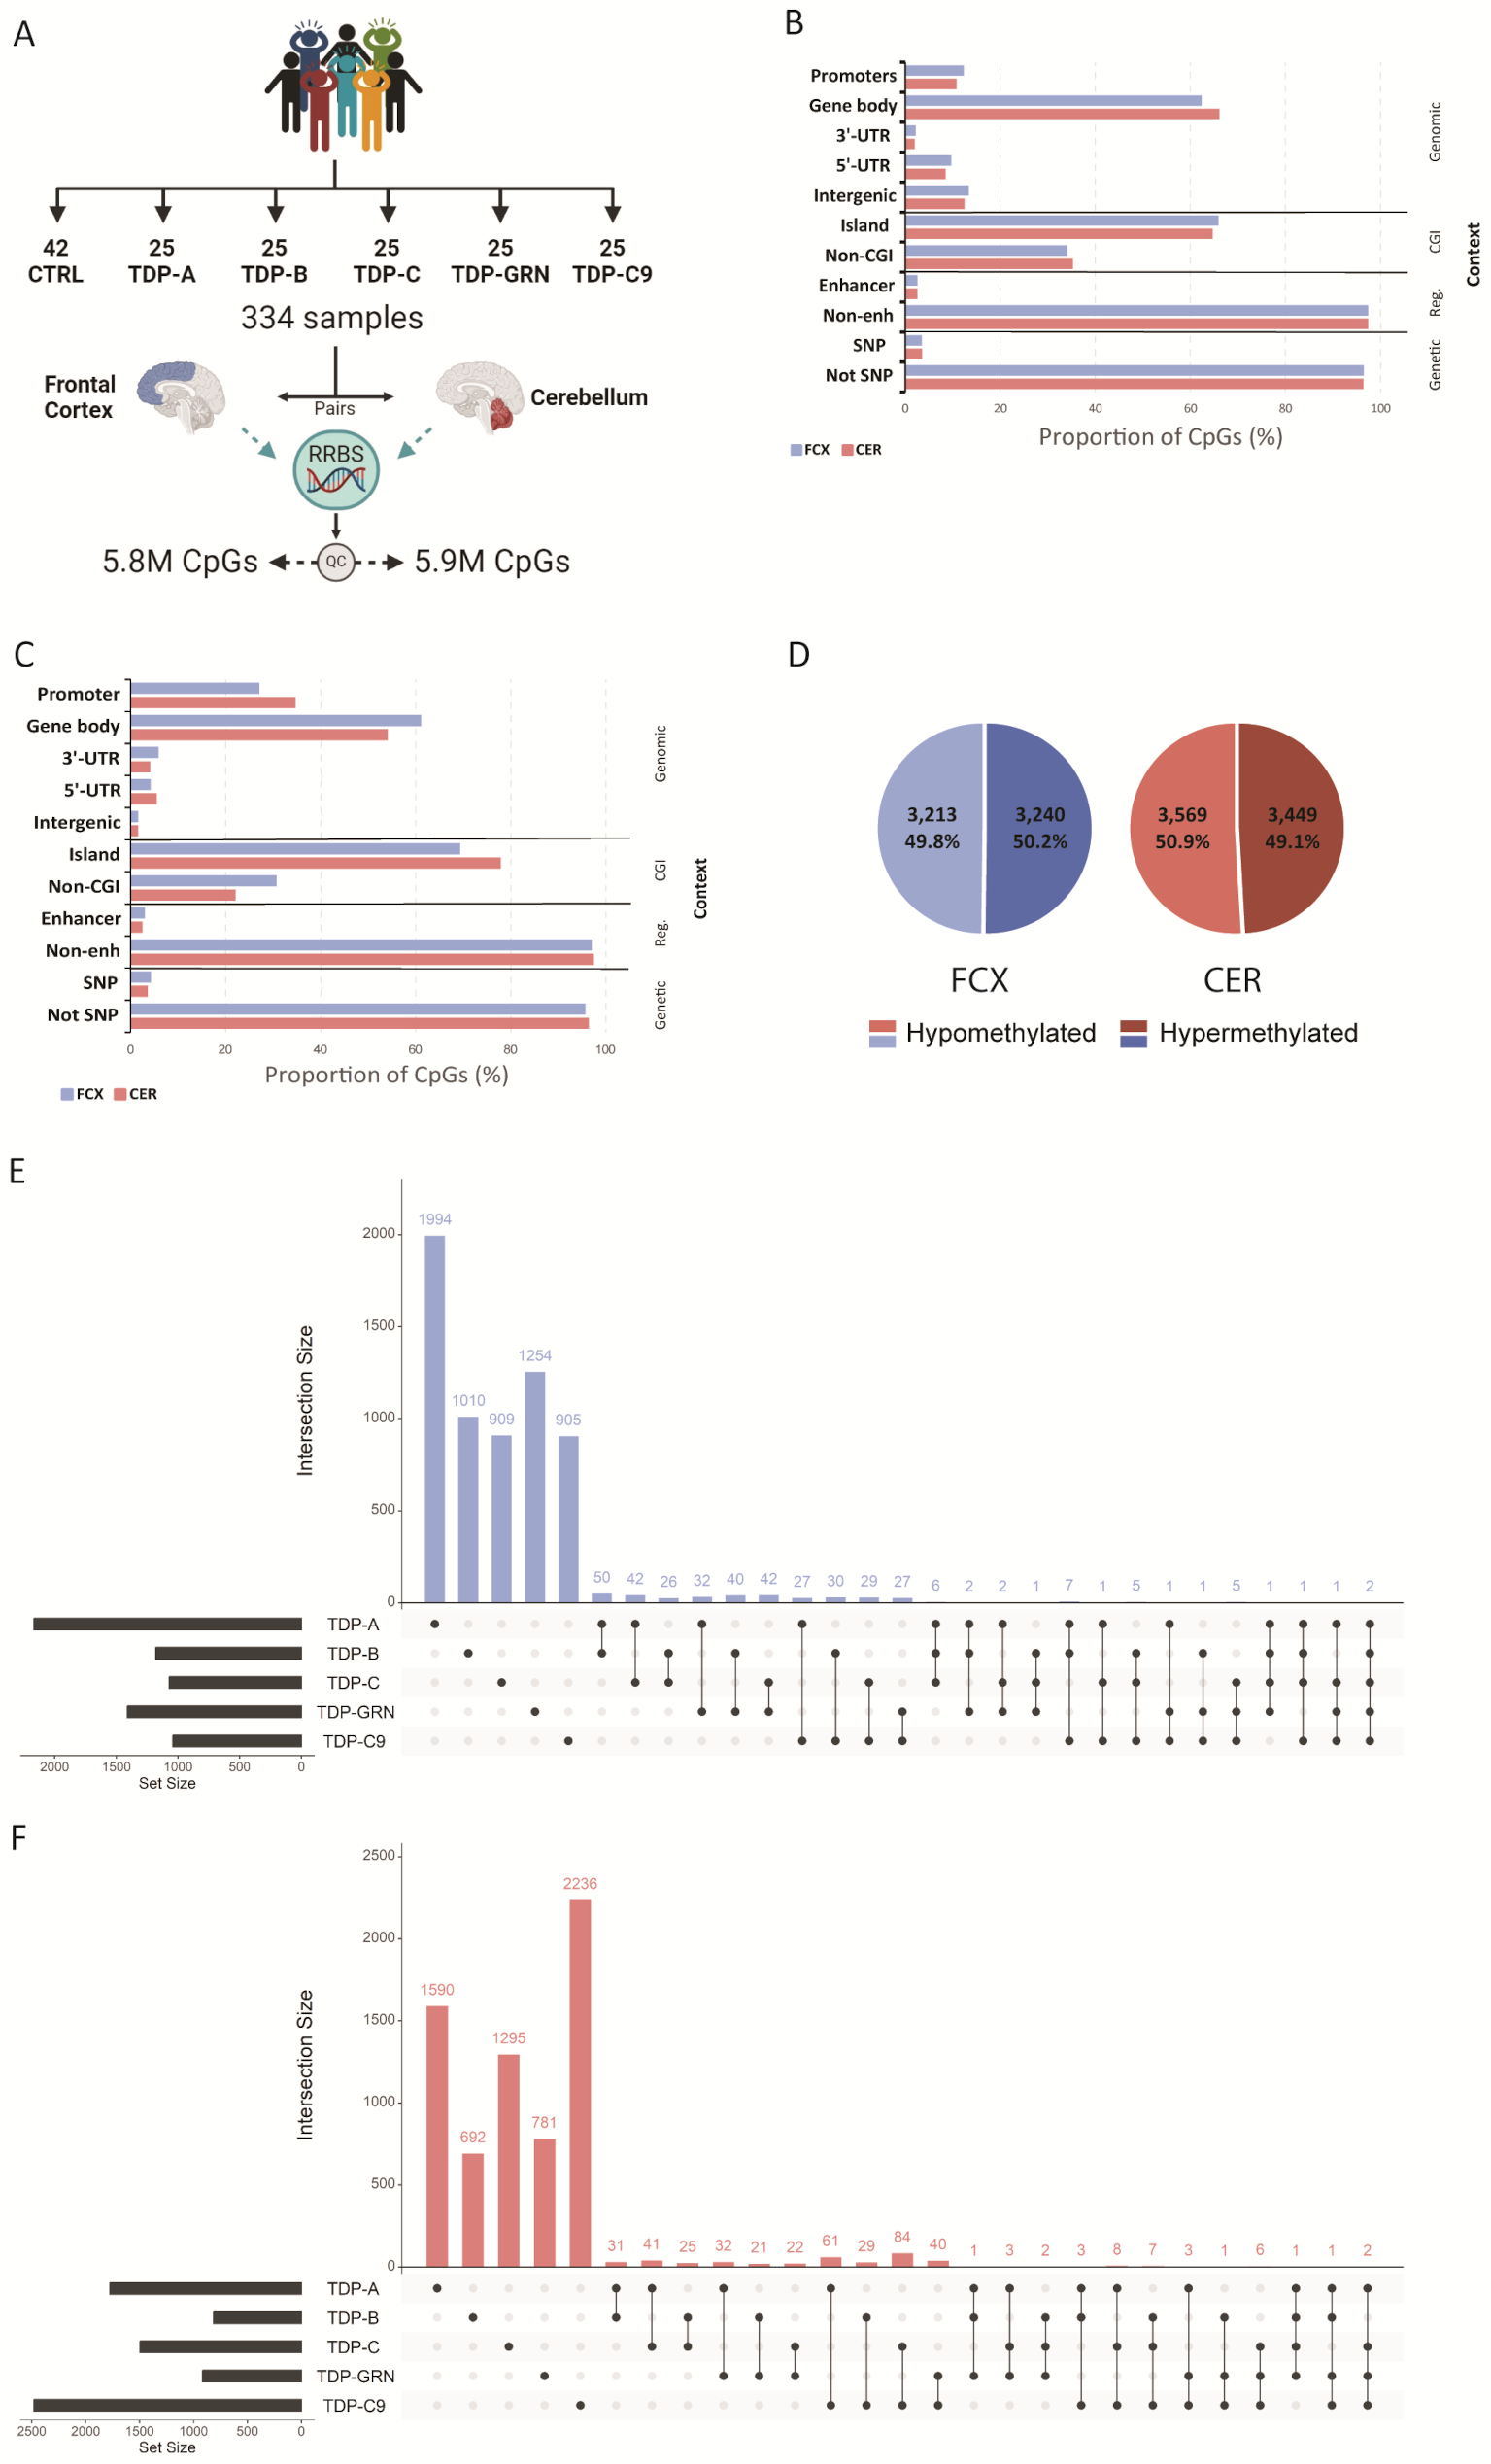
RRBS was performed to generate DNA methylation profiles from pairs of frozen post-mortem FCX and CER from FTLD-TDP patients (FTLD-TDP types A, B and C, GRN mutation carriers and C9orf72 repeat expansion carriers) and neuropathologically normal controls (Fig. 1A). After QC, 5,819,868 CpGs in FCX and 5,936,364 in CER were included in the analyses. 90% of the total number of retained CpGs overlapped between both tissues, with similar distributions with respects to genomic region, CpG island and regulatory element context (Fig. 1B). Differential methylation analysis was then performed at the CpG site level in both tissues, between each individual pathological subgroup and controls (Supp. Tables 2 and 3). Across all groups, we found 6,453 differentially methylated CpG sites (FDR < 0.05) in FCX and 7,018 in CER. In both brain regions, the majority of differentially methylated CpGs were in a gene body (61.1% in FCX and 54.1% in CER), followed by gene promoters (27.1% in FCX and 34.7% in CER), 3’-UTRs (5.9% in FCX and 4.1% in CER), 5’-UTRs (4.2% in FCX and 5.5% in CER), and a small proportion of intergenic CpGs (1.6% in both FCX and CER; Fig. 1C). In each tissue we found approximately the same number of CpGs to be hypo- and hypermethylated in FTLD-TDP patients, when compared to controls (Fig. 1D). Interestingly, the vast majority of differentially methylated CpGs we identified were unique to a disease subtype, with less than 10% of sites shared between two or more individual patient subgroups in both FCX (381 CpGs representing 6%; Fig. 1E) and CER (424 sites representing 6%; Fig. 1F). Of the overlapping CpGs in FCX, only six were found to be differentially methylated only in genetically unexplained groups of patients (TDP-A, TDP-B and TDP-C), annotated to CDH15, FN3KRP, HS1BP3, CYP2W1, NDUFAF6, TP53INP1 and ZIC3, whereas only two CpGs (within PLCB3 and UBE2A) were found differentially methylated across all pathological subtypes. In CER, no CpG sites were found in common between only genetically unexplained subgroups or all patients. Although we found that CpG positions were not commonly shared between disease groups, we did identify overlaps when analyzing the intersection of annotated genes from all differentially methylated CpGs. We found that 28.2% of genes overlapped between the different groups in FCX (1,327 genes; Supp. Figure 2 A) and 29.4% in CER (1,592 genes; Supp. Figure 2B). In FCX, the largest overlap was observed between TDP-A and all other disease subtypes, the majority being shared with TDP-GRN and TDP-B. Furthermore, we identified 25 genes in FCX and 20 in CER harboring differentially methylated CpG sites only within the sporadic patient groups (none of which was in common between both tissues), and 41 genes in FCX and 16 in CER where differentially methylated CpG sites were found across all patient groups, of which four were detected in both brain regions (HDAC4, PRDM16, PTPRN2 and RASA3, Supp. Tables 2 and 3). When analyzing the genes containing the most differentially methylated CpGs (≥ 5 CpGs) within each pathological subgroup, we found that in FCX, the TDP-A group had the highest number of such genes (N = 16), followed by TDP-GRN (N = 5), TDP-C (N = 5), TDP-B (N = 2) and finally TDP-C9 (N = 1) (Supp. Table 2). In CER however, we found the TDP-C9 group to have the highest number of such genes (N = 12), followed by TDP-A (N = 8), TDP-C (N = 7), and lastly TDP-GRN (N = 1) with none in TDP-B (Supp. Table 3). We next sought to investigate shared epigenetic mechanisms between patients, by combining groups of patients and comparing those to controls (genetically unexplained group ‘ABC’ including TDP-A/B/C and group ‘TDP’ including all TDP patients). We found that group ‘ABC’ only contributed 54 unique CpG sites in FCX and 108 in CER, representing 24 and 58 unique genes in FCX and CER, respectively (Supp. Tables 2 and 3). Group ‘TDP’ further contributed only a few additional unique CpGs with 13 in FCX and 8 in CER, representing 10 unique genes in FCX and 5 in CER, further supporting the specificity of findings to pathological subtypes, rather than shared disease mechanisms (Supp. Tables 2 and 3). Finally, to determine whether our findings are also brain region specific, we compared FCX to CER and found that only 64 CpG sites are common between brain regions across all disease groups (Supp. Tables 2 and 3). In terms of genes harboring differentially methylated CpGs, we also found a limited overlap between tissues, with 406 genes in TDP-A, 141 in TDP-B, 200 in TDP-C, 151 in TDP-GRN and 301 in TDP-C9, supporting the specificity of disease-associated methylation patterns not only to pathological subtypes but also to the brain region.
RRBS identifies thousands of differentially methylated CpGs in brain tissue from FLTD-TDP patients. Study outline (A). Proportion of CpGs in different contexts including: genomic region, which relates to the CpG position relative to the annotated genes; overlap with a known CpG island (CGI); overlap with regulatory features (enhancers, enh); and genetic context considering only common single nucleotide polymorphisms (SNP). Graphs show the proportion of CpGs in both FCX (blue bars) and CER (red bars) including either all CpGs retained in the study (B) or only significantly differentially methylated sites across all patient groups (C). Distribution of differentially hypomethylated (light shades) and hypermethylated (dark shades) CpGs across all groups, in FCX (left; blue graph) and CER (right; red graph) (D). Upset plot showing the number of unique and overlapping CpGs in each pathological group, considering all differentially methylated CpGs in FCX (E) and CER (F)
RRBS identifies differentially methylated CpGs in known FTLD genes
Next, we employed a targeted approach to investigate the presence of differentially methylated CpGs (FDR < 0.05) in both FCX and CER within known FTLD genes [8], including CHCHD10 [55], CHMP2B [56], CSF1R [57], C9orf72 [58, 59], FUS [60], GRN [61, 62], hnRNPA1 [63], hnRNPA2B1 [63], LRRK2 [64], MAPT [65], OPTN [66], SQSTM1 [67], TARDBP [5], TBK1 [66], TIA1 [68], UBQLN2 [69], VCP [70], as well as the recently implicated UNC13A [71,72,73], TNIP1 [73] and ANXA11 [74, 75]. We also included three additional genes previously reported to be differentially methylated in FTLD patients: SERPINA1 specifically in the C9orf72 repeat extension carrier group [76], and NFATC1 and OTUD4 which were reported across different FTLD pathological subtypes [29]. Overall, only few differentially methylated CpGs were found in these genes (Table 2); however, in the case of GRN and C9orf72 the previously identified differentially methylated regions in these genes were poorly covered in our study. Furthermore, and despite none of them overlapping with the previously reported CpG in intron 9, we did find that NFATC1 harbored numerous differentially methylated CpGs across multiple patient subgroups (Supp. Figure 3A). Of the differentially methylated CpGs in NFATC1 that we identified in the FCX, several showed high regulatory potential due to their location within the gene (promoter and both 5’- and 3’-UTRs). Given the previously reported finding that the expression of NFATC1 is increased in FCX from FTLD patients, we investigated NFATC1 expression in our previously generated bulk RNA sequencing dataset [10] and also found higher expression of NFATC1 in FCX from FTLD-TDP patients, when compared to controls (Supp. Figure 3B). We next tested the correlation between methylation levels at each differentially methylated CpG site in FCX and NFATC1 expression, in all FTLD-TDP patients for which both datasets were available, and found that methylation levels at the 5’-UTR CpG negatively correlated with the expression level of NFATC1 (r= -0.29; P = 0.0034; Supp. Figure 3C) suggesting that in addition to the previously reported intronic CpG, this 5’-UTR CpG may also play a role in regulating NFATC1 in FCX.
Promoter level differential methylation analysis identifies 12 promoter loci in FCX and 8 in CER
The single-base resolution of our data allows the investigation of individual CpG sites, much like array-based studies where methylation is profiled at single CpG sites and with only a few sites being profiled per gene; however, CpGs are most often clustered within CpG islands located in genomic areas with likely functional significance. As such, we sought to investigate whether aberrant methylation patterns are observed in CpG islands, in the brain of FTLD-TDP patients. For this, CpG sites were grouped into regions, and differential methylation analysis at the region level was performed. First, we included only loci located within gene promoters (defined by location ± 500 bp from the TSS) and performed differential methylation analysis in FCX and CER separately. We identified 12 differentially methylated regions (DMRs) in FCX and eight in CER, annotated to the promoters of 15 and 13 genes, respectively (Tables 3 and 4). In both tissues, we identified both hypo- and hypermethylated loci (67% hypo- and 33% hypermethylated in FCX; 50% hypo- and 50% hypermethylated in CER). None of the loci overlapped between brain regions and interestingly, promoter DMRs were mostly identified in genetically unexplained FTLD-TDP patients (subtypes TDP-A, TDP-B and TDP-C in FCX; subtype TDP-C in CER). Finally, in FCX only two loci were found in common between patient groups (TRIM34 and LINC01954) whereas in CER no shared loci were identified.
Genome wide region level analysis identifies hundreds of differentially methylated loci in FCX and CER
Next, we expanded our analyses beyond promoters to genome wide level, while still performing group comparisons in each brain region separately. From these analyses we identified hundreds of differentially methylated DMRs, with a total of 131 in FCX and 215 in CER across all patient groups, annotated to 123 and 203 genes, respectively (Fig. 2A and B; Supp. Fig. 4A and B; Supp. Tables 4 and 5). Of these, we found a similar proportion of hyper- and hypomethylated loci in both tissues, with most loci being hypomethylated (Fig. 2C; Supp. Tables 4 and 5). Regarding the genomic context of these loci in both tissues, the overwhelming majority was located within a gene body (75% in FCX and 80% in CER), followed by gene promoters (12% in FCX and 11% in CER), 3’-UTRs (9.5% in FCX and 6% in CER), and a small proportion in intergenic regions (2% in FCX and 1% in CER) and within 5’-UTRs (1.5% in FCX and 2% in CER; Fig. 2D; Supp. Tables 4 and 5). Akin to our findings from the CpG-level analyses, most DMRs are unique to pathological subtypes and thus, combining patient subgroups for analysis only contributed a limited amount of additional DMRs with three in FCX (annotated to PSMA6 in group ABC, and to NDUFA10 and SEMA3C in group TDP) and four in CER (annotated to FHL2, PDGFRA, and BLCAP in group ABC, and DHDDS in group TDP). In FCX, the strongest finding overall was a hypomethylated gene body DMR within GFPT2 (which spans exons 14 and part of the adjacent introns) in several group comparisons (TDP-B, TDP-C, TDP-GRN, group ABC, and group TDP; Supp. Table 4). Interestingly, and although not as strong as in FCX, GFPT2 is one of only five genes where DMRs were found in both FCX and CER (TDP-B; Table 5). We selected this locus to validate our RRBS finding, focusing on TDP-C which showed the strongest effect (logFC= -2.27; FDR = 1.2E-03; Supp. Figure 4C). We selected one highly methylated sample (> 80% methylation), one lowly methylated sample (< 20% methylation), as well as two samples with intermediate methylation per group (N = 4 TDP-C and N = 4 neuropathologically normal controls) based on methylation values across the region, measured by RRBS. Bisulfite sequencing (BS) targeted to the GFPT2 DMR showed at most a 10% difference in methylation level (range 1–10%) as compared to RRBS, with none of the samples changing their categorical classification of high/intermediate/low methylation, providing support and validation to our RRBS findings (Supp. Figure 4D).
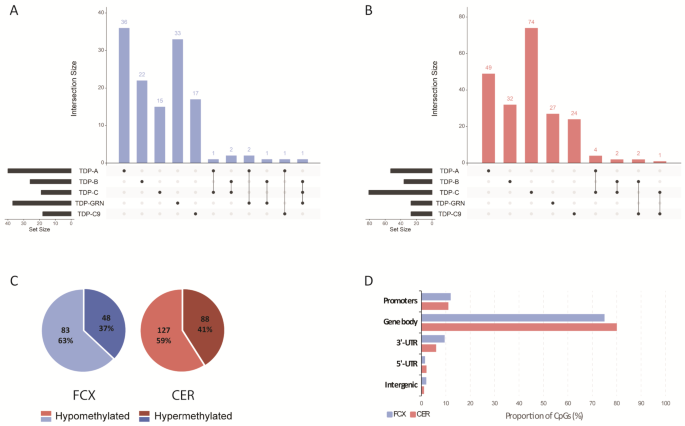
RRBS identifies hundreds of DMRs in brain tissue from FLTD-TDP patients. Upset plot showing the number of unique and overlapping DMRs in each pathological group, in FCX (A) and CER (B). Distribution of hypomethylated (light shades) and hypermethylated (dark shades) DMRs across all groups, in FCX (left; blue graph) and CER (right; red graph) (C). Proportion of DMRs in the context of its position relative to the annotated genes. Proportions are shown for both FCX (blue bars) and CER (red bars) DMRs across all groups (D)
Additionally, between the two DMR analyses (promoter and genome-wide), we identified only three loci in common, with one in FCX (overlapping PARVG/PARVB; Table 3 and Supp. Table 4), and two in CER (overlapping DHX33/DHX33-DT and a known CpG island within OTX2/OTX2-AS1; Table 4 and Supp. Table 5).
Finally, we investigated whether an impaired epigenetic machinery could represent a potential mechanism underlying the widespread DNA methylation changes we observed in FTLD-TDP patients. Using our previously generated bulk RNA sequencing dataset [10] we assessed expression levels of a subset of genes encoding for DNA methylation ‘writers’ or methyltransferase enzymes (DNMT1 responsible for methylation maintenance, and DNMT3A/B responsible for de novo methylation), as well as DNA methylation ‘erasers’ (TET1, TET2 and TET3, which are key players in the first step of the demethylation process), in FTLD-TDP patients and neuropathologically normal controls. Results from these analyses highlight expression changes in FCX in genes from both groups of DNA methylation regulators, namely DNMT1 (higher in FTLD-TDP; P = 4E-03) and TET3 (lower in FTLD-TDP: P = 2.7E-05), whereas in CER we found changes in TET1 (lower in FTLD-TDP; P = 1.3E-02) (Supp Fig. 5A). Furthermore, besides global changes across all FTLD-TDP patients, we also observed specific expression patterns of the assessed genes to some pathological subtypes (Supp Fig. 5B), suggesting that to some extent, differential expression of epigenetic machinery components may contribute to the methylation changes we observe with both pathological subtype and brain region specificity.
Enrichment analysis identifies distinct processes in TDP pathological subtypes
To gain insight into potential underlying functions or pathways in genetically unexplained FTLD-TDP patients (sporadic patient groups TDP-A, TDP-B, TDP-C and combined ‘ABC’) where we identified the most changes, we next performed Gene Ontology (GO) analyses focusing on the “Biological Process” (BP) and “Molecular Function” (MF) categories and using the differentially methylated genes from all analysis in each pathological group as input in FCX and CER separately (Supp. Tables 6 and 7). In the BP category, we identified 53 clusters of related terms in FCX and 52 in CER. In the MF category, we identified substantially less clusters with seven in FCX and eight in CER (Supp. Tables 6 and 7).
In the BP category, although we observed overall a large overlap of identified clusters (several related enriched terms that cluster together; Supp. Table 6), the top 3 processes are largely non-overlapping between pathological subtypes as well as tissue types (Fig. 3A). In TDP-A, terms related to nervous system and synapse development and regulation were the most significant in both FCX and CER (cluster 43; top GO term “Nervous system development”; 3.82E-10 in FCX and 7.11E-06 in CER). We further detect enrichment in FCX for terms related to regulation of phosphorylation, glycolysis, and protein modification (cluster 15; top GO term “Protein autophosphorylation”; P = 4.29E-06). Of note, and albeit not in the top 3, we identified two clusters that are not only unique to FCX but also to a specific pathological subtype. These included cluster 2 in TDP-A including terms related to DNA damage repair (top GO term “Recombinational repair”, P = 0.039), and cluster 37 in TDP-B including terms related to cholesterol biosynthesis (top GO term “Regulation of cholesterol biosynthetic process”, P = 0.011) (Supp. Table 6; Supp Fig. 6). In CER from TDP-B, we found the strongest enrichment in terms related to regulation of signaling pathways and transduction (cluster 31, top Go term “Regulation of signal transduction”; P = 6.64E-04). In TDP-C, we found an enrichment in terms related to protein localization and membrane receptor clustering in FCX (cluster 55; top GO term “Protein localization to membrane”; P = 1.01E-04), and to regulation of DNA-templated transcription in CER (cluster 1; top GO term “Positive regulation of transcription by RNA Polymerase II”; P = 2.27E-06). Across all groups in FCX, terms related to ion transport were highly enriched (cluster 51), whereas in the combined ABC group, we detected the strongest enrichment in terms related to protein and histone deubiquitination processes (cluster 52; top GO term “Protein K48-linked deubiquitination”; P = 3.25E-04).
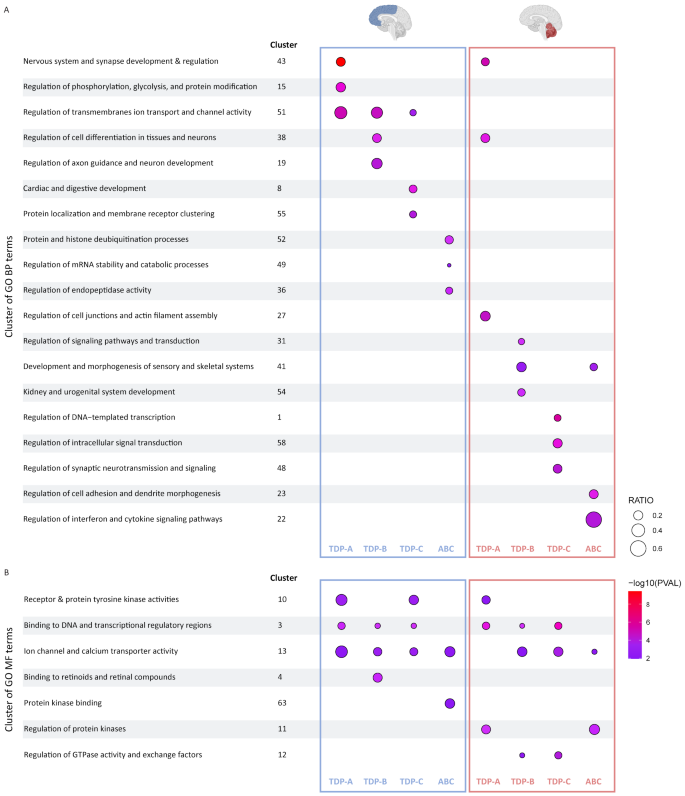
Top 3 clusters of Gene Ontology terms enriched in FTLD-TDP pathological groups. Clusters of GO terms significantly enriched in each sporadic pathological group in FCX (left; blue boxes) and CER (right; red boxes) from the biological process (A) and molecular function (B) categories. Results are shown for the most significant enriched terms in the top 3 clusters from each group, with circle color representing Pvalue and circle size representing the gene ratio in the term
Finally, in the MF category, we observed a large overlap of enriched clusters between pathological subtypes and across tissues (Supp. Tables 6 and 7). Importantly, we found two clusters in common between all TDP subtypes in both brain regions, namely terms related to binding to DNA and transcriptional regulatory regions (cluster 3), as well as ion channel and calcium transporter activity (cluster 13) (Fig. 3B; Supp Fig. 6).
Methylation levels at several DMRs correlate with gene expression levels
Given that altered gene expression is the most common and well-studied consequence of aberrant methylation, we next interrogated our previously generated bulk brain transcriptomic dataset [10] to assess correlations between methylation levels within all DMRs (from both promoter and genome-wide analyses) and the expression of the associated gene(s) for which expression was measured in FCX or CER. When several overlapping DMRs were identified within the same gene, they were merged into one single DMR with the coordinates of the largest region, whereas if several non-overlapping DMRs were identified within the same gene, they were treated as independent DMRs with correlations calculated for each. To increase statistical power, correlations were calculated including all study individuals (ALL; FTLD-TDP and controls combined) (Fig. 4; Supp. Tables 8 and 9). We found correlations between methylation and expression of the annotated gene for nine DMRs in FCX (CCDC169-SOHLH2, CAMTA1, DYSF, ICMT, LINC02139, NDUFA10, PDZD4, SPAG7 and WBP2NL; Fig. 4A) and 14 in CER (ARMC2, ATP2B3, BARHL1, BBS9, CSAG1, DEF8, MTAP, MYO15B, OTX2, PLD5, PLXNA3, PM20D1, PWWP3A and SORCS2; Fig. 4B). Interestingly, for four genes in FCX, we found that the correlations became stronger when including only FTLD-TDP patients, namely CAMTA1, PDZD4, WBP2NL, and DYSF, suggesting that disease environment may play a role in the methylation effect (Supp. Table 8). Next, for each of the 23 genes, we investigated whether differential expression was observed in the pathological subtypes where the DMR was identified, which was the case for nine genes: (i) five in FCX, namely CAMTA1 (lower expression in the TDP-A group; P = 1.9E-10); PDZD4 (lower expression in the TDP-GRN group; P = 4.12E-08); SPAG7 (lower expression in the TDP-GRN group; P = 5.6E-04); NDUFA10 (lower expression in all FTLD-TDP combined; P = 9.6E-04); and WBP2NL (higher expression in the TDP-A group; P = 0.011) (Fig. 5A); and (ii) four in CER, with three in the TDP-C group, namely ATP2B3 (lower expression in TDP-C; P = 5.9E-05); PLD5 and OTX2 (higher expression in TDP-C; P = 4.0E-03 and P = 0.034, respectively), and BBS9 in the TDP-C9 group (higher expression in TDP-C9; P = 2.1E-03) (Fig. 5B). No differential expression was observed for the other genes within the groups where the DMR was identified, compared to controls. In addition, for some genes we observed differential expression in pathological subtypes beyond those where the DMR was identified (Supp. Figure 7), suggesting that additional factors besides DNA methylation may modulate the expression of these genes. One such factor could be altered expression of epigenetic machinery components that regulate transcription via epigenetic modulation. To explore this hypothesis, we investigated whether the expression of a subset of genes encoding for methyl-CpG binding proteins (MBPs; namely MBD1, MBD2, MBD3 and MECP2), which bind to methylated DNA and recruit additional factors to modulate gene expression, was altered in FLTD-TDP patients. Results from these analyses show that in FTLD-TDP patients, MBD2 expression is increased in both FCX and CER (P = 1.6E-02 and P = 3.6E-03, respectively), as well as MBD3 in CER (P = 4.7E-03), as compared to neuropathologically normal controls (Supp Fig. 8), suggesting that differential expression of such components may play a role in the limited correlation between differentially methylated genes and their expression.
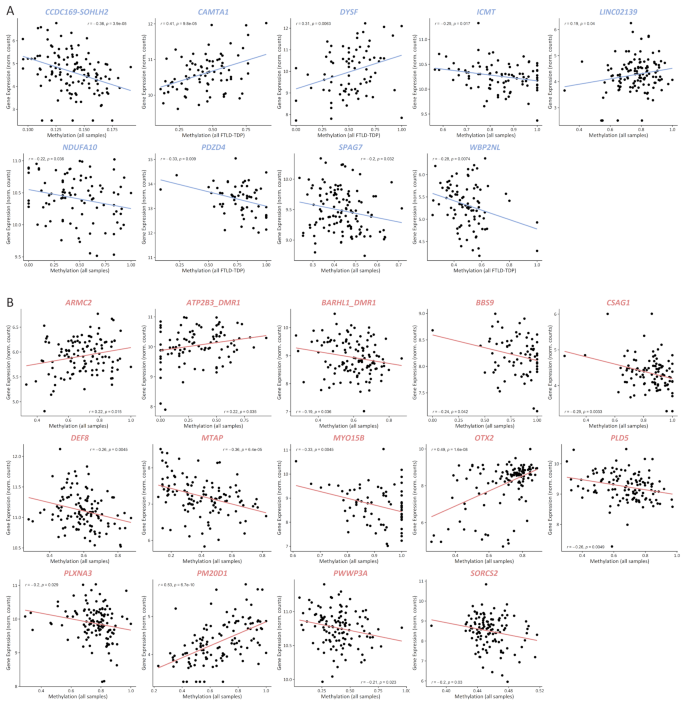
DMR methylation levels correlate with expression of annotated genes. Pearson correlation between DMR methylation and expression levels of the annotated genes for 9 genes in FCX (A) and 14 genes in CER (B). Only significant correlations are shown, and plotted are the strongest correlations for each gene, either including controls (all samples) or only FTLD-TDP patients (all FTLD-TDP) as indicated in the X-axis (see also Supp. Table 8)
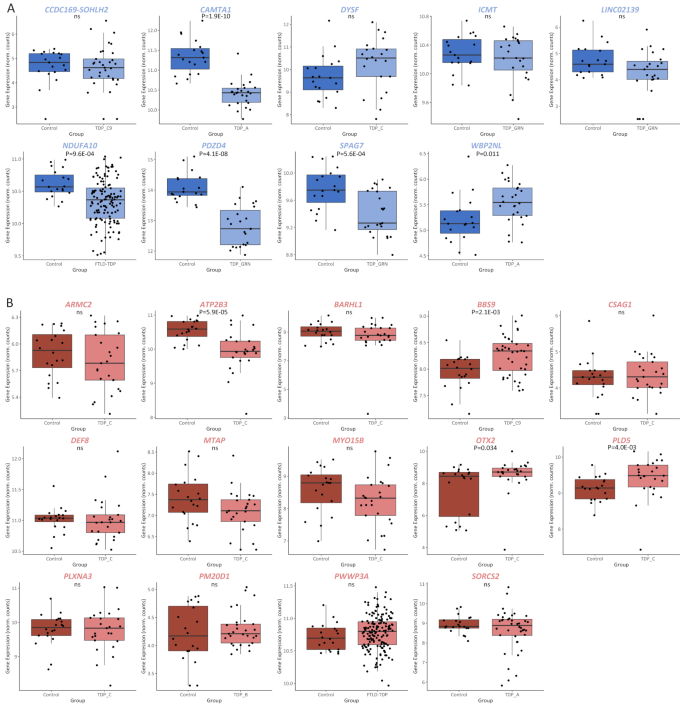
DMR containing genes are differentially expressed. Gene expression of all genes for which expression correlates with methylation levels in FCX (A) and CER (B). Comparisons are shown for expression levels of the annotated gene between controls and the pathological group in which the DMR was identified, as indicated in the X-axis. Pvalue from each comparison is shown, with ns = not significant
CAMTA1 expression is mediated by both methylation changes and TDP-43 levels
Its pivotal role in several processes such as regulating long-term memory [77] as well as neuronal development, maturation and survival [78], together with evidence of being a TDP-43 target [11, 79,80,81], made CAMTA1 an especially interesting and relevant finding in the context of FTLD-TDP pathology. As such, we selected this locus for further follow up. A closer inspection of the 185 bp CAMTA1 DMR revealed that it is located within intron 6 of CAMTA1 (NM_015215) in chromosome 1p36 (Supp Fig. 9A), and harbors several hypomethylated CpGs in the TDP-A group compared to controls (Supp. Figure 9B). First, to validate our CAMTA1 DMR finding, we investigated whether we could detect differential methylation at the CAMTA1 DMR, measured with an alternative technique to RRBS. For this, FCX DNA samples from TDP-A (N = 25) and control (N = 28) individuals overlapping with the RRBS study, were sequenced using ONT long-read sequencing, which also profiles CpG methylation. With ONT long-read sequencing we also confirmed the lower methylation levels in the TDP-A group compared to controls (logFC = -0.366; P = 0.0176; Fig. 6A). Next, also using ONT long-read sequencing, we sought to replicate this finding using an independent cohort of TDP-A (N = 80) and control (N = 22) samples, which corroborated the finding showing a hypomethylated DMR in TDP-A patients compared to controls (logFC = -0.276; P = 0.0363) (Fig. 6B). When combining the discovery and replication cohorts, a similar effect was observed (logFC = -0.27; P = 3.76E-03; Supp Fig. 9C). Next, using ONT sequencing data in the full cohort, we analyzed individual CpG sites within the CAMTA1 DMR to determine the most relevant CpGs driving the hypomethylation signal. We observed lower methylation in the TDP-A group at all CpGs measured in the locus, with CpG numbers 6, 7, 8 and 11 showing the strongest effect (Fig. 6C), suggesting that these sites have the highest predictive value as proxy for the methylation levels within the region. Finally, to confirm previous reports of CAMTA1 being a TDP-43 target, we used an additional transcriptomic dataset from TARDBP KD hiPSC-derived cortical neurons [50], which revealed a positive correlation between the expression of CAMTA1 and TARDBP genes, albeit just below significance using the limited data points available (r = 0.74, P = 0.057; Supp. Figure 9D), suggesting that CAMTA1 is indeed a TDP-43 target. To disentangle the relationship between the effects of TDP-43 dysfunction and methylation on the levels of CAMTA1, we next compared CAMTA1 levels within the group of TDP-A patients using stratification by methylation level, based on RRBS values across the CAMTA1 DMR (N = 20; comparing 10 samples with the highest methylation to 10 samples with the lowest methylation levels). This again showed lower CAMTA1 expression in the lower methylation group compared to the higher methylation group (P = 7.5E-03; Fig. 6D), suggesting that methylation changes at this DMR affect CAMTA1 expression independently and cumulatively to TDP-43 dysfunction.
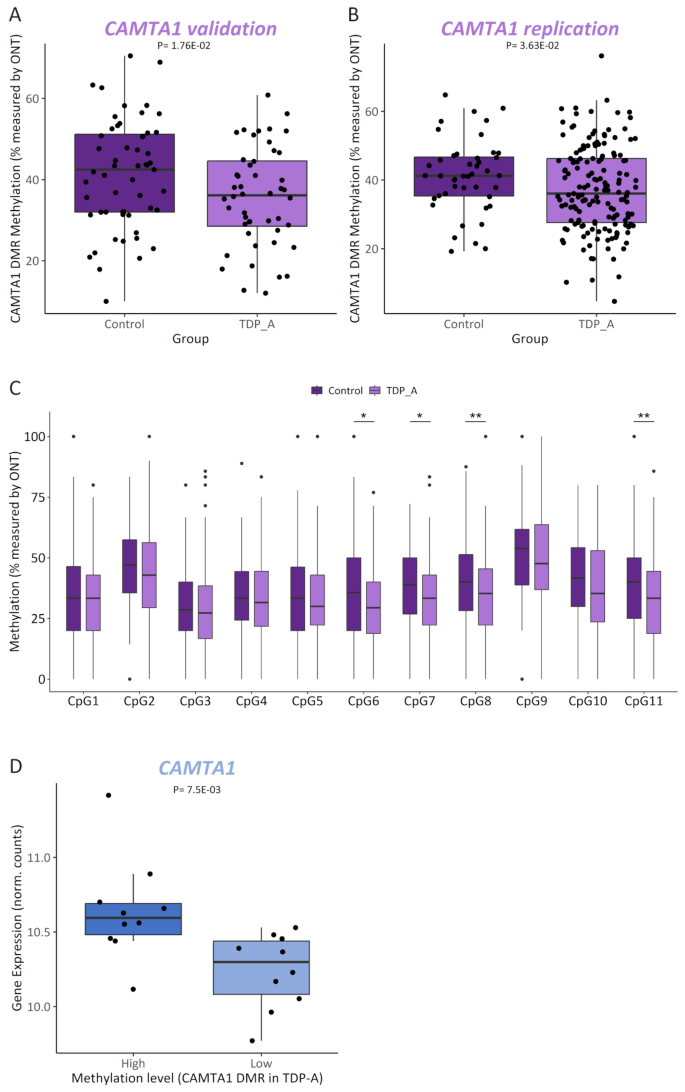
CAMTA1 is differentially methylated in TDP-A. Methylation levels measured by ONT long-read sequencing in FCX from controls (N = 28) and TDP-A (N = 25) overlapping with the RRBS study (CAMTA1 validation) (A) or in an independent replication cohort of controls (N = 22) and TDP-A (N = 80) (B). Plotted are both haplotypes from each sample and the adjusted Pvalue from each comparison is shown. Methylation levels measured by ONT long-read sequencing in the full cohort (combined validation and replication) of controls (dark shade boxes) and TDP-A (light shade boxes) at each CpG profiled within the CAMTA1 DMR. Wilcoxon signed-rank test with *P < 0.05 and **P < 0.01 (C). CAMTA1 expression levels in TDP-A patients (N = 20) stratified by methylation levels (N = 10 highest and N = 10 lowest samples; dark and light shades, respectively) as measured by RRBS
Aberrant methylation at the CAMTA1 DMR alters expression of additional genes in the 1p36 locus
Mining the UCSC Genome Browser [82] revealed that this intronic DMR, which is not within a known CpG island, overlaps with an open chromatin region (defined by the DNaseI hypersensitivity clusters track from ENCODE V3), as well as several transcription factor binding sites (defined by the Transcription factor ChiP-seq clusters track from ENCODE V3), suggesting a high regulatory potential (Supp. Figure 10). Analyzing additional datasets aimed at profiling genome-wide regulatory elements (Roadmap Epigenomics [83], GeneHancer [84]) further revealed that the DMR overlaps an enhancer element (GH01J006404; GeneHancer) of which CAMTA1 is a predicted target (Supp. Figure 10). Broadening the analysis to the intron that harbors the DMR revealed a region rich in enhancer elements predicted to target several genes within the locus. Specifically in brain tissue [85], evidence supports the existence of enhancer elements in several brain regions predicted to target the neighboring gene VAMP3 (Supp. Figure 10). Given that methylation changes may alter chromatin conformation and thus affect the functioning of regulatory elements, we investigated whether aberrant methylation at the CAMTA1 DMR alters the expression of additional genes in the locus, besides CAMTA1. Testing all genes within 1 MB from the DMR, we found that methylation levels within the region correlate with the expression of VAMP3 (rTDP = -0.3, PTDP = 6.2E-03) and PARK7 (rTDP=0.25, PTDP=0.022) in FCX; however, only within TDP patients (Supp Table 10; Fig. 7A). When comparing TDP-A to controls, we found that only VAMP3 is differentially expressed in FCX (increased in the TDP-A group; P = 1.1E-03; Fig. 7B; Supp Fig. 11A) and that expression changes are also observed in additional pathological groups (Supp. Figure 11B). Furthermore, when investigating the effect of methylation on gene expression, within TDP-A patients stratified by methylation levels, we found that VAMP3 is differentially expressed between the two groups, with higher VAMP3 expression in the low methylation group (P = 0.015; Fig. 7C). Finally, querying the CLIPdb module of the POSTAR3 database [81] revealed no TDP-43 binding sites within VAMP3 in brain tissue, which is corroborated by our own transcriptomic dataset from TARDBP KD neurons (Supp. Figure 11C), suggesting that VAMP3 is not a TDP-43 target and that expression changes might be, at least in part, modulated by methylation changes at the CAMTA1 DMR. Taking ours and others’ findings together, we propose a working model for the CAMTA1 DMR and locus where on the one hand, in healthy brains, CAMTA1 levels are maintained both via nuclear TDP-43 (i.e. promoting adequate CAMTA1 splicing and expression through direct binding to the 5’-UTR), as well as correct gene body methylation. On the other hand, aggregation and subsequent accumulation of TDP-43 in the cytoplasm leads to TDP-43 loss-of-function and lower TDP-43-dependent CAMTA1 levels. In addition, and independently from TDP-43 dysfunction in TDP-A patients, hypomethylation within the CAMTA1 gene body alters chromatin availability and/or function of regulatory elements in the locus, further reducing CAMTA1 expression while activating nearby genes such as VAMP3. Dysfunction of both CAMTA1- and VAMP3-dependent mechanisms may contribute to neurodegeneration and the pathology observed in TDP-A patients. (Fig. 8).
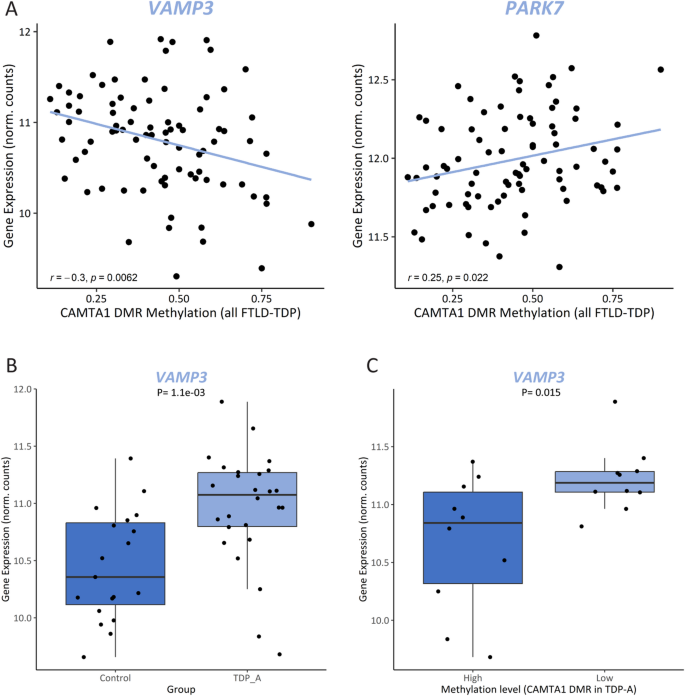
Methylation changes at the CAMTA1 DMR alters expression of additional genes in the locus. Pearson correlation between methylation levels at the CAMTA1 DMR and the expression levels of VAMP3 (left panel) and PARK7 (right panel) in FCX from FTLD-TDP patients (A). VAMP3 expression levels in FCX from controls and TDP-A (B) and only in TDP-A patients (N = 20) stratified by methylation levels (N = 10 highest and N = 10 lowest samples; dark and light shades, respectively) as measured by RRBS (C)
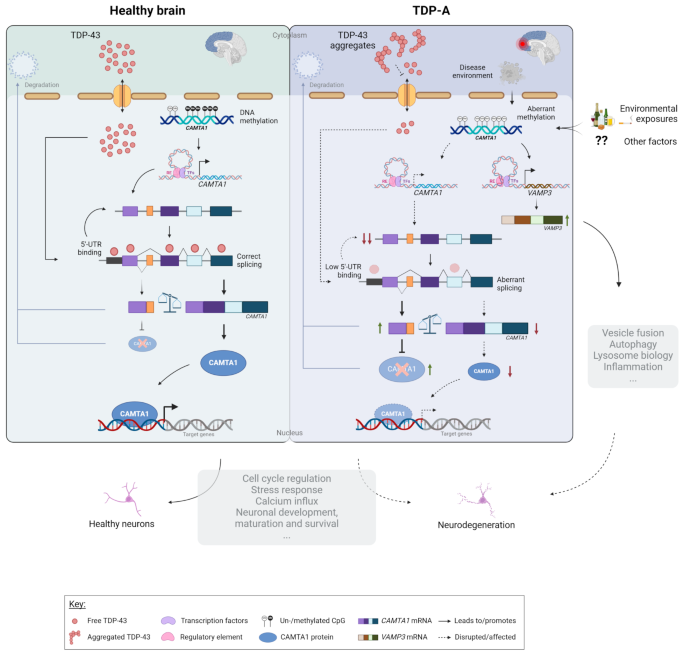
Proposed CAMTA1 double-hit model. In normal physiological conditions, TDP-43 is shuttled between the cytoplasm and the nucleus where it exerts its function. Once in the nucleus, TDP-43 ensures correct splicing of CAMTA1 and enhances CAMTA1 expression through direct binding to the 5’-UTR. Physiological levels of CAMTA1 are thus maintained by proper TDP-43 function and normal CAMTA1 methylation. In FTLD-TDP brains, as a consequence of TDP-43 aggregation, TDP-43 is less available in the nucleus and no longer ensures proper CAMTA1 splicing and/or binding to its 5’-UTR, thereby reducing CAMTA1 expression. In addition, and independently from TDP-43 dysfunction in TDP-A patients, due to a combination of factors such as disease environment and/or environmental exposures, methylation within the CAMTA1 gene body is lost. Hypomethylation in this region affects the expression of CAMTA1 and additional genes in the locus such as VAMP3, possibly through altering chromatin conformation and/or transcription factor binding, which in turn modulates the function of regulatory elements in the locus. As a transcriptional activator of several target genes, CAMTA1 is involved in a multitude of processes that are critical for neuronal health. Impairment of such CAMTA1-dependent mechanisms in a double-hit fashion produced by both nuclear TDP-43 and CAMTA1 methylation levels, together with alterations in processes regulated by VAMP3, may contribute to neurodegeneration and the pathology observed in TDP-A patients