Data source and study population
The UK Biobank is a large-scale, population-based prospective cohort study that included over half a million individuals between 2006 and 2010 at 22 assessment centers across the UK. Study participants were enrolled from diverse regions across England, Scotland, and Wales [18, 19]. During enrolment, participants completed a comprehensive touchscreen survey, underwent physical assessments, and submitted biological samples. Additionally, the UK Biobank includes data from the UK’s electronic health records; further details regarding the UK Biobank can be found online (http://www.ukbiobank.ac.uk). Ethical approval for research activities conducted within the UK Biobank was granted by the Research Ethics Committee (reference 11/NW/0382), with participants providing duly informed written consent. We applied for and were granted permission to use data from the UK Biobank (Application ID: 104830).
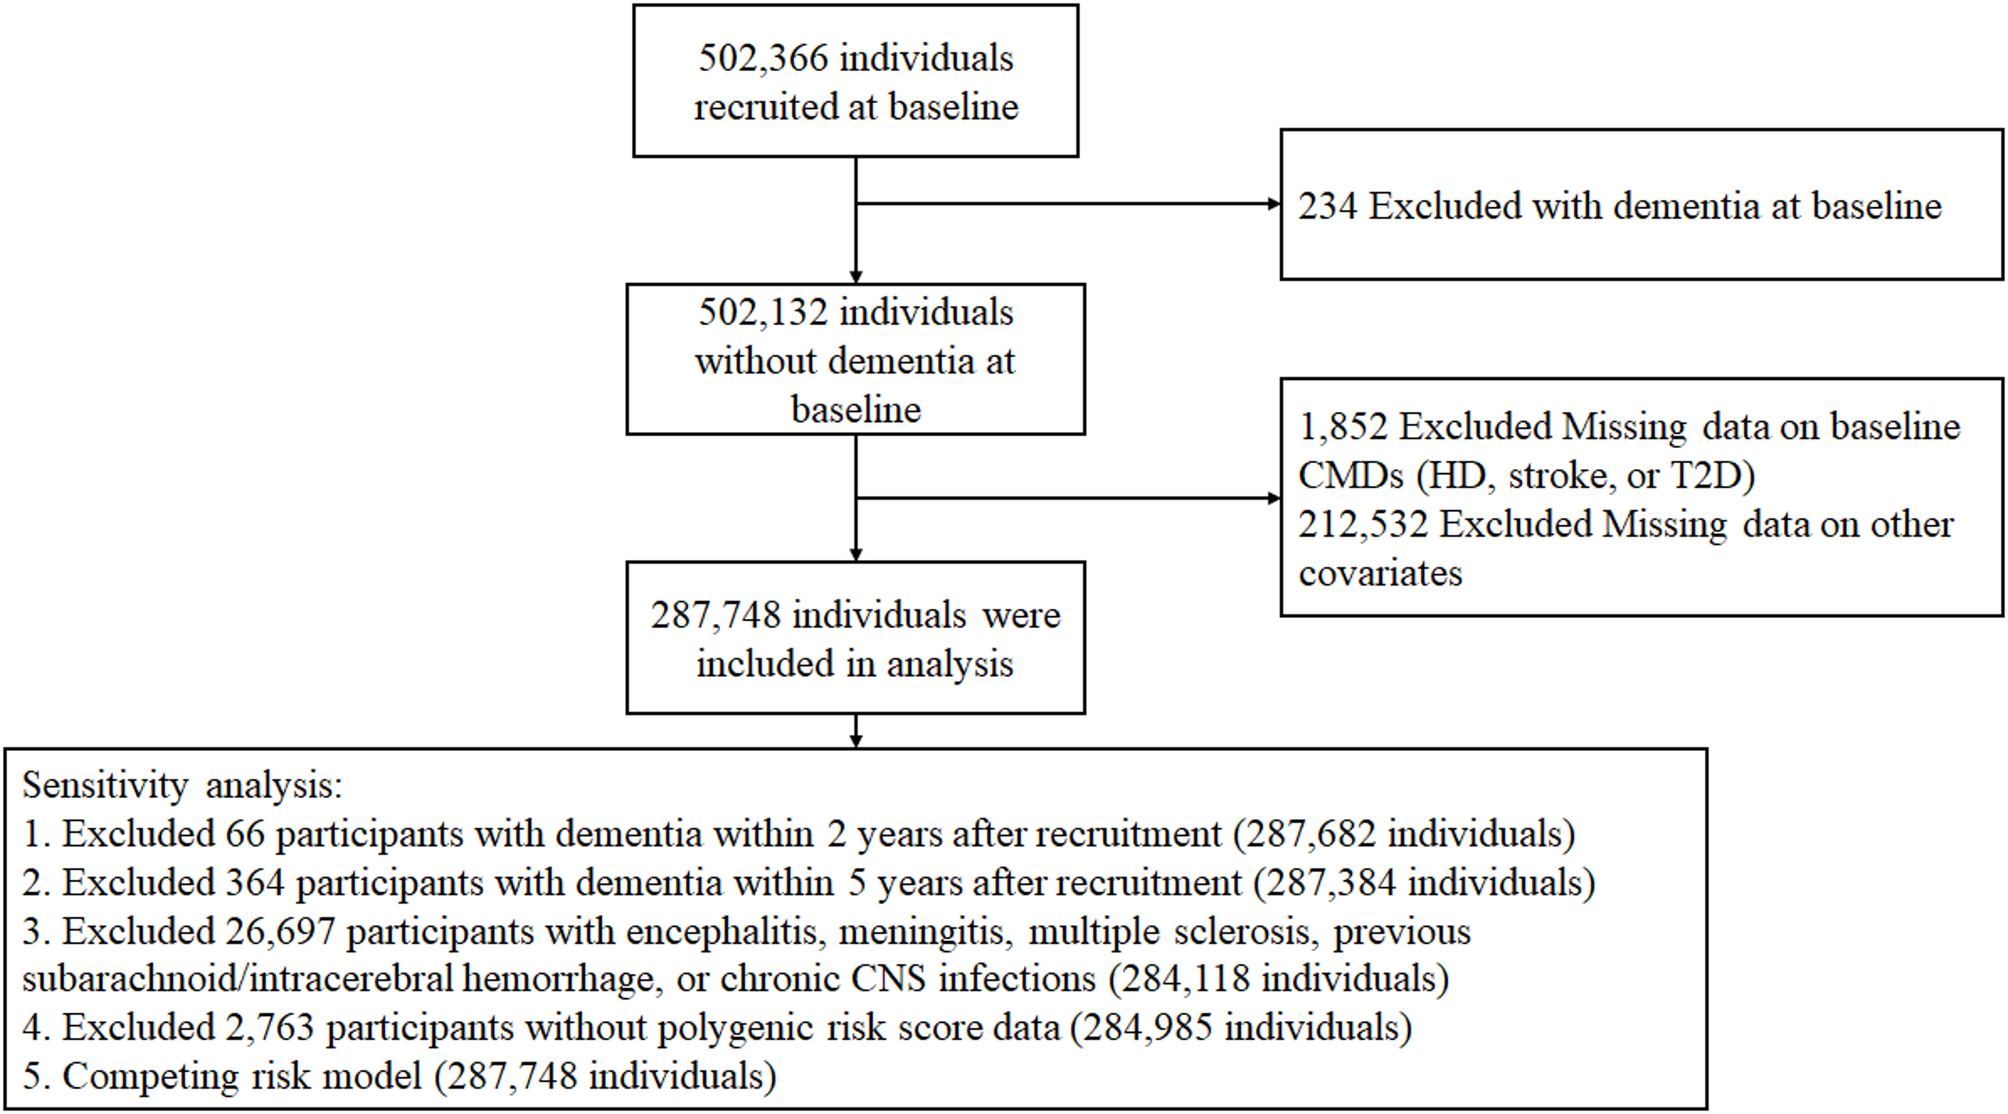
During the baseline period from 2006 to 2010, detailed data were collected on demographic covariates, lifestyle, disease diagnosis information, and blood test indicators (e.g., leukocyte count, lipid profile, fasting glucose). From the initial cohort of 502,366 individuals, we excluded individuals with: (1) preexisting diagnosis of ACD, AD or VD at baseline (n = 234), (2) missing data on baseline CMDs (HD, stroke, or T2D) (n = 1,852), and (3) other incomplete covariates information (e.g., demographic characteristics, laboratory test result, and clinical covariates) (n = 212,532). After these rigorous exclusion criteria were applied, a cohort of 287,748 individuals was retained for primary analyses. Sensitivity analyses were conducted in five subsets: (1) 287,682 participants after excluding dementia cases within 2 years of baseline; (2) 287,384 participants after excluding dementia cases within 5 years of baseline; (3) 284,118 participants after excluding those with encephalitis, meningitis, multiple sclerosis, previous subarachnoid/intracerebral hemorrhage, or chronic central nervous system infections; (4) 284,985 participants after excluding participants without available polygenic risk scores (PRS) for dementia; (5) competing risk model treating all-cause mortality as a competing event (Fig. 1).
Flowchart of study participants
Assessment of cardiometabolic diseases
CMDs that included HD (including acute ischemic heart disease, chronic ischemic heart disease, atrial fibrillation, and heart failure), stroke, and type 2 diabetes [14] were ascertained via self-reported medical history, primary care records, and hospital admission records with International Classification of Diseases (ICD)-10 coded diagnoses (the field codes were shown in Table S1). A CMD diagnosis required confirmation by at least one objective source (primary care records or ICD codes). CMD status was determined based on the total number of CMDs at baseline, and categorized as CMD-free, single CMD (such as HD alone, stroke alone, or T2D alone), or CMD multimorbidity (i.e. two or more comorbid CMDs). Furthermore, CMD multimorbidity was further stratified into the following subtypes based on distinct combinations: HD + stroke, HD + T2D, stroke + T2D, and HD + stroke + T2D [9].
Outcomes
The primary outcome of this study was ACD; the secondary outcomes were AD and VD. Dementia outcomes were defined according to algorithms developed and validated by the UK Biobank as ACD (Field 42018), AD (Field 42020) and VD (Field 42022). The follow-up time was determined as the earliest of the following: the moment of the registered death, the occurrence of the outcome event, or the point at which the ultimate outcome occurred (on or before April 30, 2024).
Covariates
The following covariables were included as covariables in the analysis: age at baseline (years), sex (male/female), ethnicity (white/not white), education level (high [college or university degree]/intermediate [A levels/AS levels or equivalent, or O levels/GCSEs or equivalent]/low [none of the aforementioned]) [20], duration of moderate activity (low/intermediate/high) [21], body mass index (BMI), hypertension (yes/no), depression (yes/no), smoking (never/previous/current), and drinking status (never/previous/current). Otherwise, we collected the following data including Townsend deprivation index (TDI), sleep duration (< 6 h/night, 6–9 h/night, and > 9 h/night), total cholesterol (TC), triglycerides (TG), low-density lipoprotein cholesterol (LDL-C), high-density lipoprotein cholesterol (HDL-C), hemoglobin A1c (HbA1c), and fasting glucose. The calculation of BMI involves the division of an individual’s weight in kilograms by the square value of the height measured in centimeters. These baseline data were recorded upon enrolment. The standardized PRS for AD, constructed using UK Biobank genotype data (post-imputation and quality control), served as a quantitative measure of genetic susceptibility to dementia. This PRS, previously validated in studies of AD heritability and risk stratification [22, 23], directly correlates with increasing genetic predisposition (higher scores indicating elevated risk). The PRS was categorized into quintiles: low genetic risk (quintile 1), moderate genetic risk (quintiles 2–4), and high genetic risk (quintile 5).
Mediators
Inflammatory and metabolic biomarkers were obtained from baseline blood samples collected at the time of enrollment in the UK Biobank. Inflammatory markers included: leukocyte, lymphocyte, monocyte, neutrophil, platelet, C-reactive protein (CRP), systemic inflammation index (SII), neutrophil-to-lymphocyte ratio (NLR), and platelet-to-lymphocyte ratio (PLR). Metabolic markers included: glucose, hemoglobin A1c, insulin-like growth factor 1, LDL-C, HDL-C, triglycerides, total cholesterol, albumin, uric acid, triglyceride glucose index (TyG), TyG-body mass index, TyG-waist circumference, waist circumference, and BMI. We collected the above indicators based on their associations with dementia reported in previous studies [24,25,26,27,28,29,30,31,32,33,34,35,36].
Statistical analysis
Baseline characteristics are reported as percentages, mean ± standard deviations, or medians with interquartile ranges on the basis of the individual variable characteristics. The study population was stratified into three groups based on CMD status for baseline characteristic description: CMD-free, single CMD, and CMD multimorbidity. Additionally, we further categorized the CMD multimorbidity group into four subgroups based on different combinations of conditions: HD + stroke, HD + T2D, stroke + T2D, and T2D + HD + stroke, and described their baseline characteristics. Categorical data were analyzed via either the chi-square test or Fisher’s exact test, whereas continuous data were evaluated using one-way ANOVA or the Kruskal‒Wallis test, depending on each method’s suitability. Participants with missing data on cardiometabolic diseases (HD, stroke, T2D) at baseline or covariates (e.g., demographic characteristics, laboratory results and clinical covariates) were excluded. The missing PRS values (0.96%) were imputed using multiple imputation by chained equations to minimize information loss.
CMD-free status was used as a reference. Kaplan–Meier (KM) survival analysis and the Cox proportional hazards model were utilized to estimate the hazard ratios (HRs) of CMD status in relation to different outcomes (ACD, AD, and VD). The model was adjusted for age (continuous, in years), sex (male/female), ethnicity (white/not white), education level (high/intermediate/low), duration of moderate activity (low/intermediate/high), BMI (continuous, kg/m²), hypertension (yes/no), smoking status (never/previous/current), and drinking status (never/previous/current). Given the established impact of depression on cognitive function [37, 38], we further adjusted for depression status in our multivariable models. The proportional hazards assumption was examined via Schoenfeld residuals. The violation of proportionality was met for the sex variable in the model for ACD and AD, therefore, the Cox model was employed with stratification by sex. P-values for trends were determined through the application of the Cochran‒Armitage trend test. The outcomes are presented as hazard ratios (HRs) with their corresponding 95% confidence intervals (95% CIs).
Furthermore, we investigated whether the genetic predisposition to AD modifies the association between CMD multimorbidity and the risk of AD. We employed a multivariate Cox proportional hazards model to evaluate the correlation between CMD multimorbidity and the PRS for AD.
We performed subgroup analyses with survival analysis model to assess heterogeneity across different categories according to age (≥ 60 or < 60 years), sex (male or female), smoking status (never, previous or current), drinking status (never, previous, current), ethnicity (white or not white), education (high, intermediate, or low), duration of moderate activity (low, moderate, or high), and sleep duration (< 6 h/night, 6–9 h/night, or > 9 h/night).
A mediation analysis was applied to explore whether inflammation and metabolism-related indicators could mediate the associations between CMD multimorbidity and dementia. First, a generalized linear model was employed to explore the potential correlations between CMD status and inflammation and metabolism-related markers. Next, Cox proportional hazard regression analyses were conducted to evaluate the relationships between these biomarkers and dementia outcomes. Finally, a mediation analysis was performed for the variables that showed a significant association in the aforementioned analyses. In this study, the average direct effect refers to the direct impact of CMDs on dementia. The average causal mediation effect refers to the partial effect mediated by inflammatory or metabolic factors. The proportion of the mediation effect represents to the percentage of indirect effect to the total effect. The covariates of the intermediary model were adjusted according to the covariates of the survival analysis model.
Additionally, we conducted sensitivity analyses to evaluate the stability of the link between CMD status and dementia. In order to minimize the risk of reverse causation, we initially omitted individuals who received a dementia diagnosis within the first 2 years or 5 years after their enrolment. Additionally, sensitivity analysis was conducted after excluding patients with a history of encephalitis, meningitis, multiple sclerosis, motor neuron disease, subdural/subarachnoid hemorrhage, and chronic central nervous system infection. To validate robustness, we excluded participants with missing PRS data and repeated the sensitivity analysis. Furthermore, we employed a competing risk model to address potential mortality bias by treating all-cause mortality as a competing event.
Statistical analyses were conducted in (R version 4.4.1) and SPSS (version 27.0). In all cases, the criterion for statistical significance was set at a two-tailed P-value < 0.05.