Illicitly manufactured fentanyl and its analogs (FAs) have emerged as major drivers of the ongoing opioid overdose crisis.
Since 2013, a sharp increase in overdose deaths has been linked to heroin laced with fentanyl or FAs—often sold as heroin without users’ knowledge. Data from the US Drug Enforcement Administration’s National Forensic Laboratory Information System shows a staggering 300 % rise in fentanyl-related cases.1,2
Beyond the extreme potency of fentanyl and many of its analogs, law enforcement continues to face the ongoing challenge of identifying new FAs as they rapidly emerge. Illicit drug manufacturers frequently make small structural tweaks to the core fentanyl molecule, creating novel analogs that are both potent and difficult to track using existing compound lists.
Detecting and identifying synthetic opioids requires a range of analytical techniques due to their chemical complexity. The CDC, for example, recommends a two-tiered testing approach: initial screening with enzyme-linked immunosorbent assay (ELISA), followed by confirmation using gas chromatography/mass spectrometry (GC/MS) to detect fentanyl compounds in blood or urine from suspected overdose cases.
Other methods, such as liquid chromatography–mass spectrometry (LC-MS), tandem mass spectrometry (LC-MS/MS), and ion mobility spectrometry (IMS), are also employed to screen and confirm the presence of fentanyl and FAs in forensic samples.3
However, accurately distinguishing between certain fentanyl analogs—particularly isomers—remains a significant challenge. Many FA isomers share identical accurate masses and exhibit highly similar electron impact (EI) and electrospray ionization (ESI) fragmentation patterns, along with nearly indistinguishable retention times in both gas and liquid chromatography.1
Previous studies have demonstrated that FT-Raman spectroscopy offers a safe, fast, and complementary approach for identifying powders and other seized materials, including fentanyl.4
This technique requires little to no sample preparation and allows for direct measurement through glass containers or evidence bags, minimizing the risk of accidental exposure to highly potent opioids for laboratory personnel. Its non-destructive nature also helps preserve the chain of custody from seizure to evidence documentation.4
This article presents two examples of FA isomer differentiation using FT-Raman spectroscopy. A pair of constitutional isomers (butyryl fentanyl and isobutyryl fentanyl) and a pair of geometric isomers (cis- and trans-3-methyl fentanyl) were analyzed. In both cases, FT-Raman spectroscopy successfully distinguished the isomers based not only on the fingerprint region but also on low-frequency Raman peaks (250–400 cm-1), specifically those linked to δ(C–C) aliphatic chain vibrations.
Materials and methods
Fentanyl and fentanyl analog (FA) standards were obtained from Cayman Chemical (Ann Arbor, Michigan) and analyzed without further modification. All testing involving fentanyl and other regulated substances was conducted at the Albuquerque Police Department Crime Laboratory, following Schedule I chemical handling protocols.
Samples were analyzed either through double-layered evidence bags or glass vials to ensure safety and prevent direct exposure.
All Raman analyses were performed using a Nicolet iS50 FTIR Spectrometer, configured with a calcium fluoride beam splitter and the Nicolet iS50 Raman module. A 1064 nm laser, operating at 0.5 W, served as the excitation source. For each spectrum, 128 scans were collected at a resolution of 4 cm-1, resulting in a total acquisition time of approximately 130 seconds. Spectral analysis was carried out using OMNIC Software.
Results and discussion
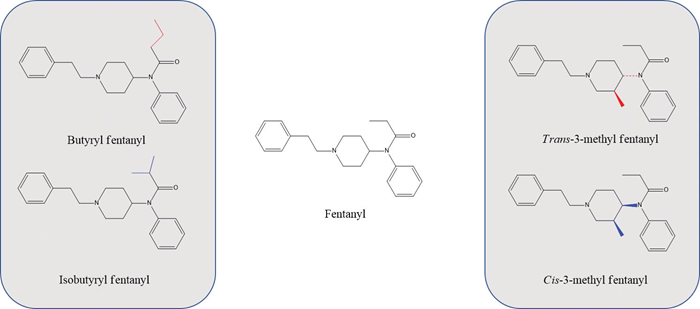
Fentanyl and FAs belong to the phenylpiperidine class of synthetic opioids. Fentanyl, specifically, has a phenyl propanamide group attached to the phenylpiperidine (Figure 1). Its FT-Raman spectrum is depicted in Figure 2, with the major peaks annotated according to their corresponding wavenumbers.
Comprehensive Raman peak assignments of fentanyl based on density function theory (DFT) calculation were reported by Leonard et al.5 In the fingerprint region (400–1600 cm-1), most spectral features (e.g., 622, 743, 829, 1001, 1075, 1160, 1455, 1585, 1598 cm-1) originate from the vibrations of the two terminal benzene rings.
While these peaks are strong in intensity, they do not provide clear differentiation between the fentanyl analog isomers examined in this study. Notably, δ(C-C) aliphatic chains generate strong Raman signals in the spectral region of 250–400 cm-1 (e.g. 267 cm-1 and 308 cm-1 in Figure 2).
Figure 1. Structures of fentanyl and two pairs of FA isomers in this study. Image Credit: Thermo Fisher Scientific Inc.
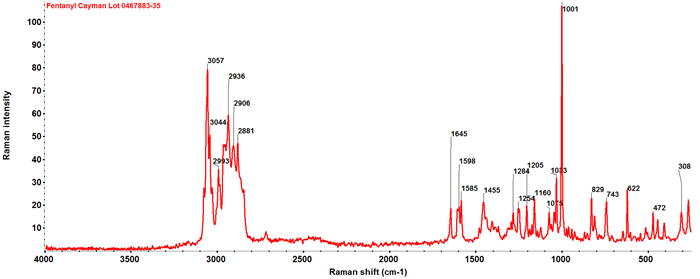
Figure 2. FT Raman spectrum of fentanyl. Image Credit: Thermo Fisher Scientific Inc.
Butyryl fentanyl and isobutyryl fentanyl are a pair of constitutional isomers differing in the terminal groups attached to the amide moiety of the fentanyl scaffold (Figure 1). As short-acting FAs, these compounds are about 30 times less potent than fentanyl.
Nonetheless, the US DEA has reported at least 40 confirmed overdose fatalities related to butyryl fentanyl abuse.1 Butyryl fentanyl and isobutyryl fentanyl were designated as Schedule I narcotics in 2016 and 2018, respectively. Their FT-Raman spectra are displayed in Figure 3.
The peak observed at 735 cm-1, resulting from the C-H symmetric bend, is unique to isobutyryl fentanyl. Due to the different terminal groups attached to the carbonyl carbon, the carbonyl C-O stretch peak positions are different between the isomers: 1655 cm-1 for isobutyryl fentanyl and 1646 cm-1 for butyryl fentanyl.
In the low frequency region (250–400 cm-1), isobutyryl fentanyl exhibits unique peaks at 323 and 372 cm-1, whereas butyryl fentanyl shows a distinct peak at 282 cm-1. While the precise assignments of these low-frequency peaks are uncertain, the Raman spectra of butyryl fentanyl and isobutyryl fentanyl display sufficient variance for distinguishing this pair of constitutional isomers.
3-methylfentanyl (3-MF), a Schedule I narcotic, first appeared in 1984 in Allegheny County, Pennsylvania, and was linked to 16 fatal overdose incidents.2 It exists as a diastereomeric species: (±)‐cis‐3‐MF and (±)‐trans‐3‐MF. The cis- and trans-isomers differ in the orientation of the methyl group attached to the piperidine ring (Figure 1).
The two isomeric species display notably different potencies: (±)‐trans‐3‐MF exhibits potency comparable to that of fentanyl, whereas (±)‐cis‐3‐MF is eight times more potent than fentanyl.6 The FT-Raman spectra of cis-3-MF and trans-3-MF within the 250–1800 cm-1 spectral range are presented in Figure 4.
Although subtle differences exist between the isomers in the 1200–1300 cm-1 spectral region—where the peaks are primarily from the C-N stretch and C-H twist of piperidine—more prominent differences appear in the 250–500 cm-1 low frequency region. While cis-3-MF exhibits a group of distinct peaks (265, 307, 409, 478 cm-1), they are markedly absent for trans-3-MF.
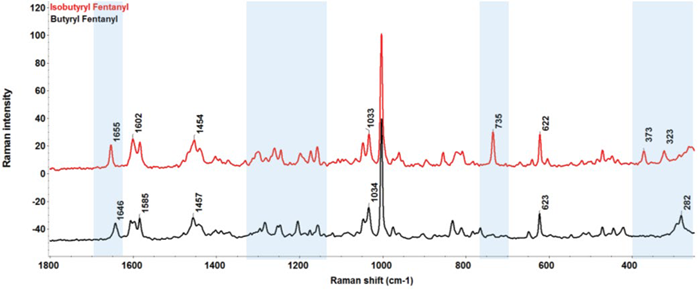
Figure 3. Raman spectra of butryl fentanyl and isobutryl fentanyl in the spectral range of 250–1800 cm-1. The shaded region in blue color highlights the spectral difference between the two compounds. Image Credit: Thermo Fisher Scientific Inc.
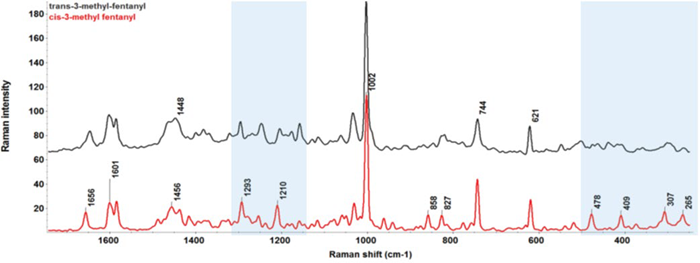
Figure 4. Raman spectra of cis-3-MF and trans-3-MF in the spectral range of 250–1800 cm-1. The shaded region in blue color highlights the spectral difference between the two compounds. Image Credit: Thermo Fisher Scientific Inc.
Raman spectra for fentanyl and the isomeric pairs were searched against a fentanyl library containing fentanyl and 13 FAs. Details of this library will be reported in a separate publication. The search outcomes are outlined in Table 1. As anticipated, each compound was correctly identified. Notably, the second-best match for each isomer was not its isomeric counterpart.
For instance, cyclopentyl fentanyl was the second-best match for both butyryl fentanyl and isobutyryl fentanyl. These findings indicate that although the structural difference between isomers is small, the spectral difference is substantial enough to enable effective isomer discrimination.
Conclusions
In this article, FT-Raman spectroscopy was used to analyze fentanyl along with two isomeric pairs of fentanyl analogs (FAs): the constitutional isomers butyryl and isobutyryl fentanyl, and the geometric isomers cis- and trans-3-methyl fentanyl.
As expected, the fingerprint region of the Raman spectra is largely dominated by vibrational features of the two terminal benzene rings. However, these peaks offer limited utility in distinguishing between isomers due to their similarity across compounds.
In contrast, the low-frequency region (250–400 cm-1), corresponding to δ(C–C) vibrations in the aliphatic chains, proved to be much more informative. These features served as the primary differentiators between the isomeric forms.
Library searches against a fentanyl spectral database confirmed strong matches for each compound. Notably, in every case, the second-best match in the library was not the compound’s isomeric counterpart—underscoring the sensitivity of FT-Raman to even minor structural differences. These subtle variations produced meaningful shifts in the Raman spectra, enabling confident identification and clear discrimination between isomers.
Overall, FT-Raman spectroscopy demonstrates itself to be a safe, rapid, and highly selective analytical technique for detecting and identifying fentanyl and its analogs.
Image Credit: Thermo Fisher Scientific Inc.
Table 1. Search results against the fentanyl library. Source: Thermo Fisher Scientific Inc.
| Compound | Top match | 2nd best match |
|---|---|---|
| Butyryl fentanyl | Butyryl fentanyl | Cyclopentyl fentanyl |
| Isobutyryl fentanyl | Isobutyryl fentanyl | Cyclopentyl fentanyl |
| Trans-3-methyl fentanyl | Trans-3-methyl fentanyl | Butyryl fentanyl |
| Cis-3-methyl fentanyl | Cis-3-methyl fentanyl | Fentanyl |
| Fentanyl | Fentanyl | Acetyl fentanyl |
Acknowledgments
Produced from materials originally authored by Shea A Schleman, Manuel Gomez, Suja Sukumaran and Rui Chen.
References
- Jannetto, P.J., et al. (2019). The Fentanyl Epidemic and Evolution of Fentanyl Analogs in the United States and the European Union. Clinical Chemistry, 65(2), pp.242–253. https://doi.org/10.1373/clinchem.2017.281626.
- Armenian, P., et al. (2018). Fentanyl, fentanyl analogs and novel synthetic opioids: A comprehensive review. Neuropharmacology, (online) 134(Part A), pp.121–132. https://doi.org/10.1016/j.neuropharm.2017.10.016.
- Sisco, E., et al. (2017). Rapid detection of fentanyl, fentanyl analogues, and opioids for on-site or laboratory based drug seizure screening using thermal desorption DART-MS and ion mobility spectrometry. Forensic Chemistry, 4, pp.108–115. https://doi.org/10.1016/j.forc.2017.04.001.
- Sukumaran, S. et al. FT-Raman: an invaluable addition to the forensic arsenal to combat the opioid epidemic, APPLICATION NOTE AN52304. report. https://assets.thermofisher.com/TFS-Assets/CAD/Application-Notes/an-52304-ft-ir-fentanyl-an52304-en.pdf.
- Leonard, J., et al. (2017). SERS , Raman , and DFT analyses of fentanyl and carfentanil: Toward detection of trace samples. Journal of Raman Spectroscopy, 48(10), pp.1323–1329. https://doi.org/10.1002/jrs.5220.
- Fogarty, M.F., Papsun, D.M. and Logan, B.K. (2018). Analysis of cis and trans 3‐methylfentanyl by liquid chromatography–high resolution mass spectrometry and findings in forensic toxicology casework. Drug Testing and Analysis, 10(9), pp.1474–1482. https://doi.org/10.1002/dta.2414.
About Thermo Fisher Scientific Inc.
Thermo Fisher Scientific is the world leader in serving science. The company enables its customers to make the world healthier, cleaner and safer by providing analytical instruments, equipment, reagents and consumables, software and services for research, analysis, discovery and diagnostics.
Thermo Scientific represents a broad range of high-end analytical instruments, chemistry and consumable supplies, laboratory equipment, software and services that enable integrated laboratory workflow solutions. Thermo Scientific is the new name for a trusted brand – Thermo Electron – that the world’s most renowned researchers, clinicians and scientists already count on to solve their analytical challenges. The brand is strengthened by the addition of equipment, consumables and reagents acquired from Fisher Scientific.
Fisher Scientific represents a family of global product and service brands comprising a complete portfolio of laboratory equipment, chemicals, supplies and services used in healthcare, scientific research, safety and education. Fisher Scientific brings these solutions to general research customers worldwide, and through Fisher HealthCare, Fisher Safety and Fisher Science Education it delivers the specialty equipment, supplies and services that customers want, when and how they want them. In addition to these two premier brands, Thermo Fisher Scientific also markets a range of specialty products, featuring well-known industry names such as Nalgene, Nunc and Remel. Offerings include consumables such as disposable laboratory glassware, plastic-ware and environmental sample containers ranging from vials, tubes and pipettes to microscope slides and syringes. These products are primarily sold through Fisher Scientific and our valued partners worldwide.
Sponsored Content Policy: News-Medical.net publishes articles and related content that may be derived from sources where we have existing commercial relationships, provided such content adds value to the core editorial ethos of News-Medical.Net which is to educate and inform site visitors interested in medical research, science, medical devices and treatments.