Patient’s demographic and clinical characteristics
A total of 442 CHC patients (mean age = 48.26 ± 14.67 years, 272 males and 170 female) were included in this study, including 242 CHC patients (the CHC group) and 200 CHC patients combined with T2DM (the CHC + T2DM group). As shown in Table 1, several baseline characteristics were significantly different from between the two groups. Compared to the CHC group, the CHC + T2DM group had significantly higher age (P < 0.001), BMI (P = 0.001), fasting blood glucose (P < 0.001), fasting insulin (P = 0.015), HOMA-IR (Homeostasis Model Assessment-Insulin Resistance) index (P < 0.001), transaminases alanine transaminase (ALT) (P < 0.001) and aspartate transaminase (AST) (P < 0.001), total bilirubin (P < 0.001), γ-Glutamyl Transferase (GGT) (P < 0.001), and cirrhosis prevalence (P < 0.001). In addition, the types of hepatitis diagnoses were also significantly different between groups (P < 0.001). The CHC + T2DM group had more moderate, severe hepatitis, cirrhosis, and even hepatic carcinoma as compared with the CHC group.
Independent variables associated with T2DM
To investigate independent variables associated with T2DM in CHC patients, the univariate and multivariate logistic regression analysis was performed using the CHC group as a reference outcome (Table 2). The associated factors significant in both univariate and multivariate models included age (univariate models OR: 1.09, 95% CI: 1.07–1.53, P < 0.001, multivariate models OR: 1.09, 95% CI: 1.05–1.13, P < 0.001), fasting blood glucose (univariate models OR: 6.64, 95% CI: 4.46–9.88, P < 0.001, multivariate models OR: 16.20, 95% CI: 6.67–39.38, P < 0.001), fasting insulin (univariate models OR: 1.04, 95% CI: 1.01–1.06, P = 0.002, multivariate models OR: 1.23, 95% CI: 1.03–1.46, P = 0.021), HOMA-IR (univariate models OR: 1.53, 95% CI: 1.37–1.70, P < 0.001, multivariate models OR: 0.48, 95% CI: 0.25–0.92, P = 0.027), and GGT (univariate models OR: 1.01 95% CI: 1.01–1.02, P < 0.001, multivariate models OR: 1.01, 95% CI: 1.00-1.02, P = 0.011). It seemed that higher age, fasting blood glucose, fasting insulin, and GGT were risk factors of T2DM in CHC patients. In addition, cirrhosis (univariate models OR: 9.24, 95% CI: 4.25–20.07, P < 0.001, multivariate models OR: 15.32, 95% CI: 4.82–48.73, P < 0.001) and hypertension (univariate models OR: 19.50, 95% CI: 7.64–49.76, P < 0.001, multivariate models OR: 31.00, 95% CI: 7.34-130.96, P < 0.001) also increase the risk of T2DM in CHC patients.
Diagnostic efficacy of continuous associated factors
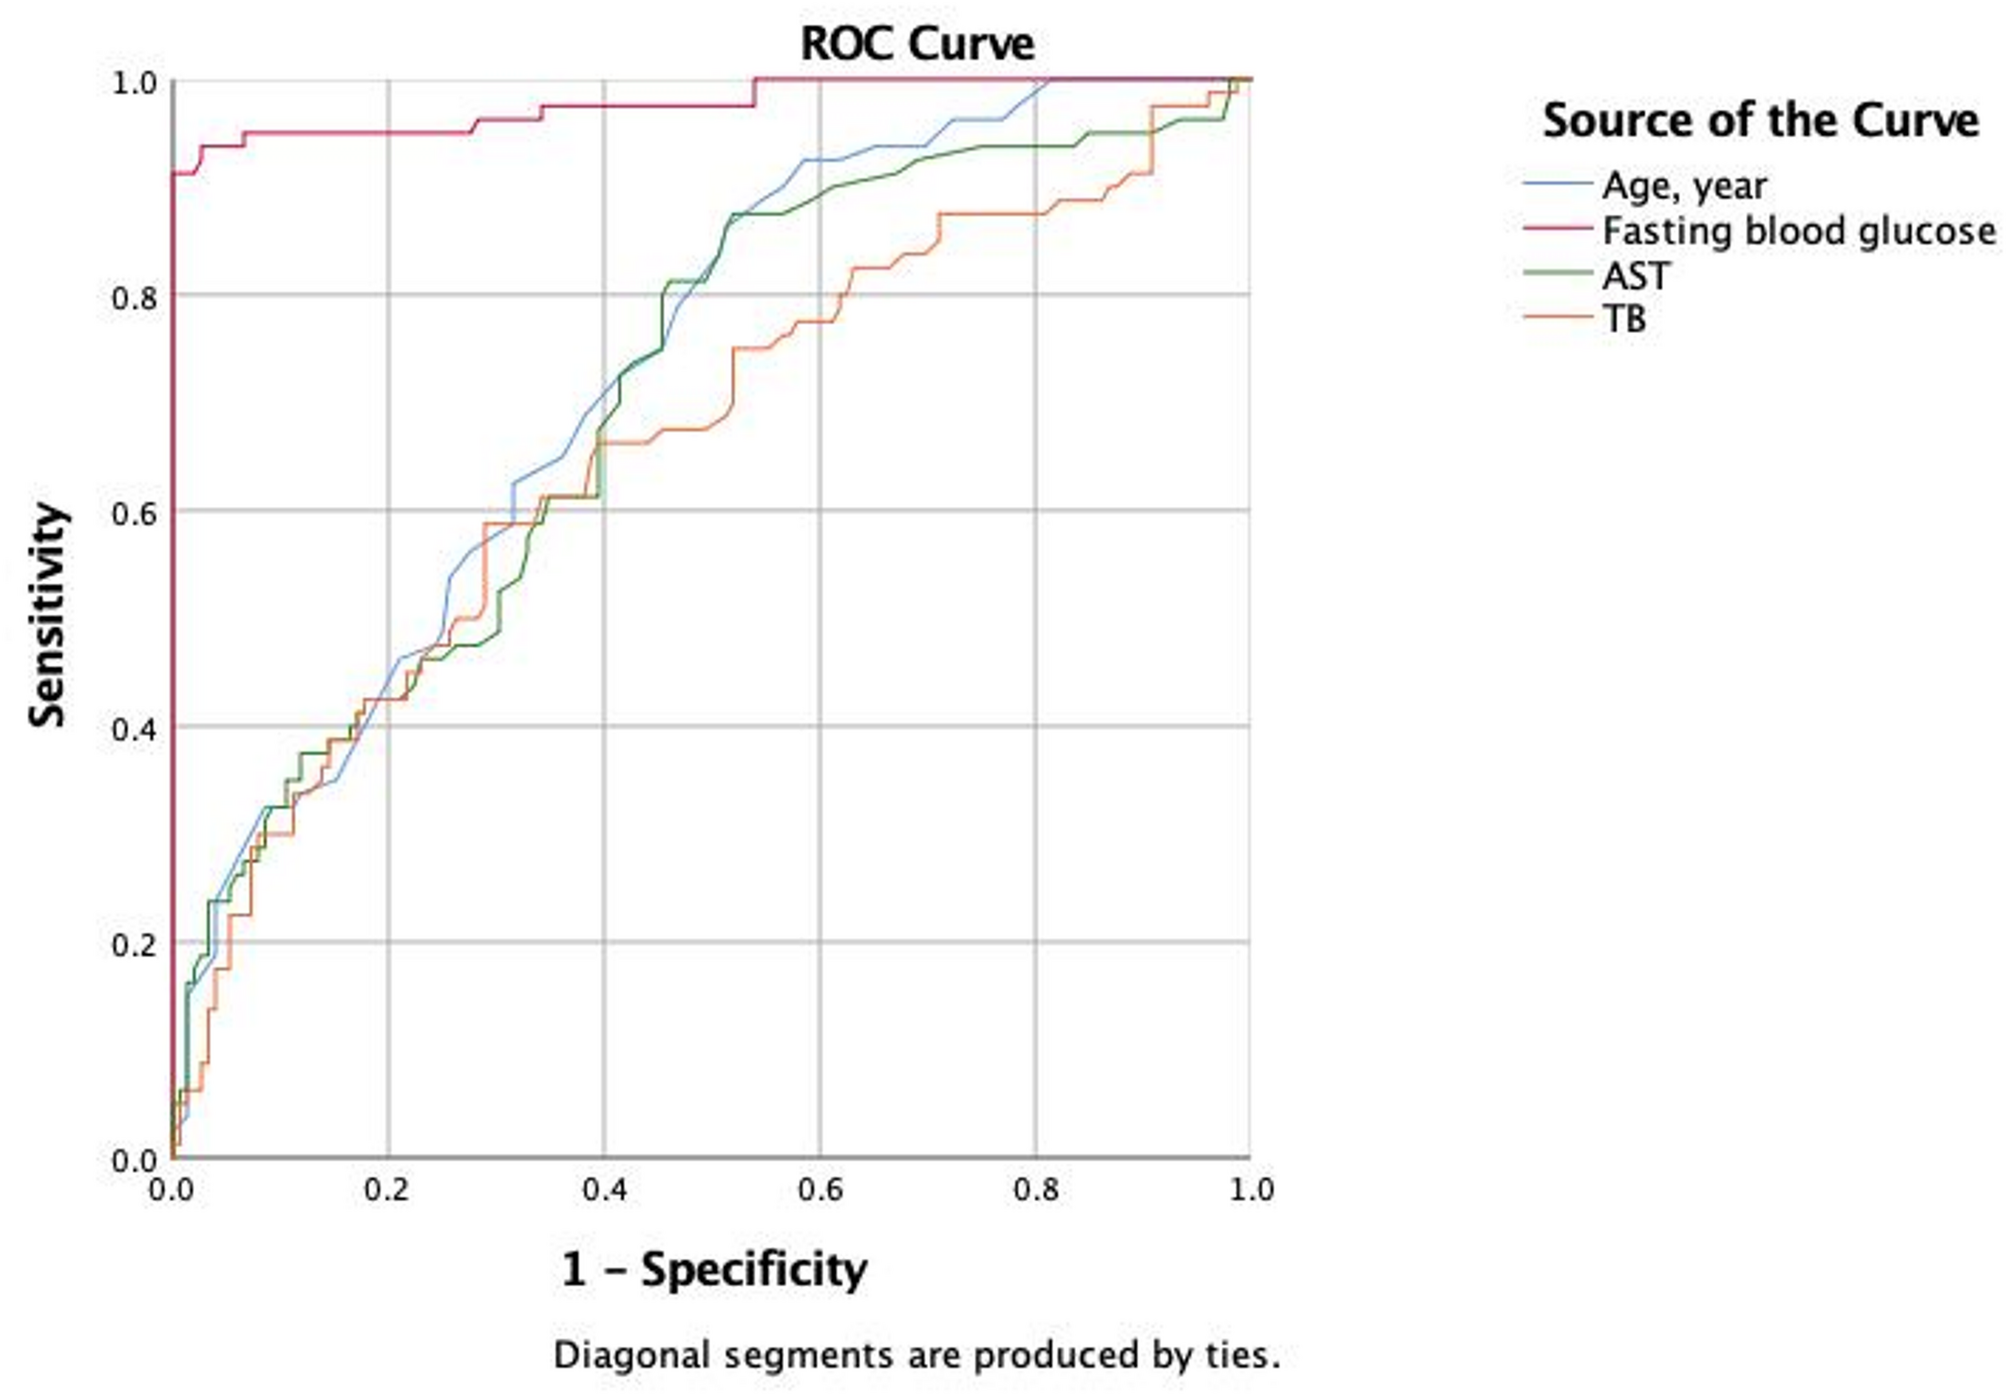
To further evaluate the diagnostic efficacy of the independent variables associated with T2DM, ROC analysis was conducted. In Table 3, significant AUCs were found in all factors, including age (0.783), fasting blood glucose (0.904), fasting insulin (0.569), HOMA-IR (0.749), and GGT (0.715) (all P < 0.05). As shown in Fig. 1, a higher associated factor predicted a higher risk of T2DM. Fasting blood glucose had the best AUC (0.904), with a sensitivity of 0.81 and specificity of 0.94. The cut-off was 5.94 mmol/l was suggested by comparatively maximum Youden’s index (0.74). These results indicate that fasting blood glucose was a good factor in discriminating against the CHC group and CHC + T2DM group.
The ROC results of all significantly continuous associated factors to DM, including age, fasting blood glucose, fasting insulin, HOMA-IR, and GGT
The clinical characteristics of CHC patients combined with T2DM by genotypes
HCV Genotyping was performed in 286 CHC outpatients, including 242 cases in the CHC group and 44 in the CHC + T2DM groups (Table 4). The distribution of HCV genotypes was significantly different between the two groups (P = 0.008). Specifically, the CHC group had a higher proportion of genotype 1b (140/242, 57.85%) and other genotypes (14/242, 5.79%), while the CHC + T2DM group had a higher proportion of genotypes 2a (7/44, 15.91%), 3a (5/44, 11.36%), and 6a (12/44, 27.27%). Notably, genotype 3a was significantly more prevalent in the CHC + T2DM group compared to the CHC group (5/242, 2.07% vs. 5/44, 11.36%, P = 0.032).
Subgroup analysis stratified by HCV genotypes was performed in the 44 CHC + T2DM outpatients. As shown in Table 5, BMI was the only significant variable among the four genotypes subgroups (P = 0.011).