Study setting and data collection
Participants were recruited from the regions Boeny (16°06′50″S 46°45′24″E), Atsinanana (19°19′49″S 48°58′49″E), and Haute Matsiatra (21°26′38″S 47°05′16″E). Eligibility criteria for all studies were informed consent, willingness to comply with the protocol, and age ≥ 18 years for Boeny and Haute Matsiatra, or ≥ 5 years for Atsinanana. A general exclusion criterion was the history of epilepsy or convulsive episodes. For Boeny, the additional exclusion criteria of fever (temporary exclusion), a history of transfusion or congenital anaemia were applied; for Atsinanana and Haute Matsiatra, a history of bleeding/haemorrhage, current pregnancy as well as current suspected and/or confirmed coronavirus disease 2019 (COVID-19) infection and COVID-19 vaccination within the past two weeks before recruitment. For the regions Boeny [22] and Atsinanana [23], recruitment was previously described in detail. Participants were recruited from a primary healthcare centre in Ankazomborona in the Boeny region (March 2020–January 2021) and through home-based surveys in Vatomandry in the Atsinanana region (July–October 2022). From each participant 9 ml of venous blood was collected, and serum aliquots were stored at −80 ℃. In Haute Matsiatra (July 2022–March 2023), participants with different degrees of hepatosplenic schistosomiasis [schistosome-negative (Sneg), schistosome-positive (Spos) without liver fibrosis (Spos-NF), Spos with moderate liver fibrosis (Spos-MF), and Spos with severe liver fibrosis (Spos-SF)] were recruited at the main hospital [Centre Hospitalier Universitaire(CHU) Tambohobe Fianarantsoa], with pre-recruitment conducted at the primary level of healthcare and subsequent referral to CHU. A urine sample was taken and a rapid point-of-care circulating cathodic antigen test (POC-CCA) was performed to screen for schistosome infections. Disease severity in infected participants was assessed by staging the degree of liver fibrosis via ultrasound and segregating participants into the four corresponding groups. From each participant 5 ml of venous blood was collected to obtain an aliquot of serum, and 9 ml of venous blood was collected to obtain an aliquot of plasma, which were stored at −80 °C. All the samples were shipped on dry ice to the Bernhard Nocht Institute for Tropical Medicine (BNITM), Hamburg, Germany, where they were stored at −80 °C until further use. Background characteristics such as socio-demographic information, clinical history, and personal habits were provided in a pseudonymised format and later merged with the test results.
At all the study sites, data were collected through case report forms (CRFs), which were administered via face-to-face interviews, either directly through eCRFs or by double data entry, according to data quality standards. The CRF data were managed using REDCap® electronic data capture tools version 15.0.33 (Vanderbilt University, Nashville, USA) hosted at the BNITM. The questionnaire was developed ad-hoc for the studies in collaboration with all the implementing partners. After finalisation, a pilot test was run during the training sessions, and additional adaptations were included if needed.
Sample size considerations
Sample size calculations were based on the premise that this study represents a secondary analysis of data originally collected for other objectives.
For the seroprevalence analysis, on the basis of previously available data from Madagascar, we assumed a DENV seroprevalence of 10%. To detect a 5% difference in the prevalence of DENV between subgroups with 80% power, we estimated the minimum required sample size to be 864 participants. Given the availability of overall 1478 participants, we included this total number.
To analyse the average reduction in plaque counts, the minimum required sample size was estimated using the non-parametric Guenther method for the Mann–Whitney test [24], as we anticipated a skewed distribution of plaque counts. To achieve 80% power for detecting small (Cohen’s d = 0.2), medium (d = 0.5), and large (d = 0.8) effect sizes, a minimum of 412, 67, and 27 participants per group, respectively, were required. Sample size calculations were conducted using the “pwrss” package in R software version 4.4.2 (R Core Team, Vienna, Austria).
Laboratory testing
Different methodologies have been applied to detect the presence of schistosomes and previous DENV infections (diagnostic assays), whereas experimental in vitro assays have been established to assess the influence of schistosome infections on DENV infections (experimental assays).
Diagnostic assays
Schistosome PCR testing. DNA extraction and PCR were performed as previously described [22]. Briefly, DNA was extracted from 1 ml serum using the QIAamp MinElute ccfDNA Mini Kit, following the manufacturer’s instructions (Qiagen, Hilden, Germany). The extracted DNA was stored at −20 °C until further use. Semi-quantitative PCR (qPCR), which is based on a previously published protocol [25], was performed to simultaneously detect S. mansoni and S. haematobium infections. The readout resulted from the RotorGene 6000 Software v.7.87 (Qiagen, Hilden, Germany). Results with a clean sigmoid curve were considered positive.
POC-CCA testing. POC-CCA was performed on site according to the manufacturer’s instructions (Rapid Medical Diagnostics, Pretoria, South Africa) to detect schistosome infections. Two drops (100 µl) of urine were transferred to the POC-CCA test cassette and the results were read after 20 min.
Pan-DENV IgG ELISA. Sera were screened with the pan-DENV (NS1) IgG ELISA (Panadea Diagnostics, Hamburg, Germany) to identify samples with antibodies targeting DENV NS1. Afterwards, samples that tested positive in the screening were subjected to the pan-DENV (NS1) IgG SE ELISA (Panadea Diagnostics, Hamburg, Germany). The specificity enhancer in this kit suppresses signals from cross-reactive orthoflavivirus antibodies against DENV NS1, leaving only dengue-type-specific signals. Sera were diluted 1∶51 and incubated overnight at 4 °C in a sealed, moist environment with horseradish peroxidase (HRP)-labelled recombinant DENV NS1 antigen (serotypes 1–4), following the manufacturer’s instructions. The optical density (OD) was assessed at 450/620 nm, and the difference in the OD450–OD620 was calculated for each sample. The positivity threshold for samples from Boeny was manually defined as OD > 0.14 and as OD > 0.175 for samples from Atsinanana. All samples that tested positive with the pan-DENV (NS1) IgG ELISA were subjected to the pan-DENV (NS1) IgG SE ELISA. Samples that tested positive according to the pan-DENV (NS1) IgG SE ELISA were ultimately considered positive for dengue-type-specific antibodies. Samples that tested positive according to the pan-DENV (NS1) IgG ELISA but negative according to the pan-DENV (NS1) IgG SE ELISA were considered as being positive for DENV NS1 cross-reactive antibodies.
Experimental assays
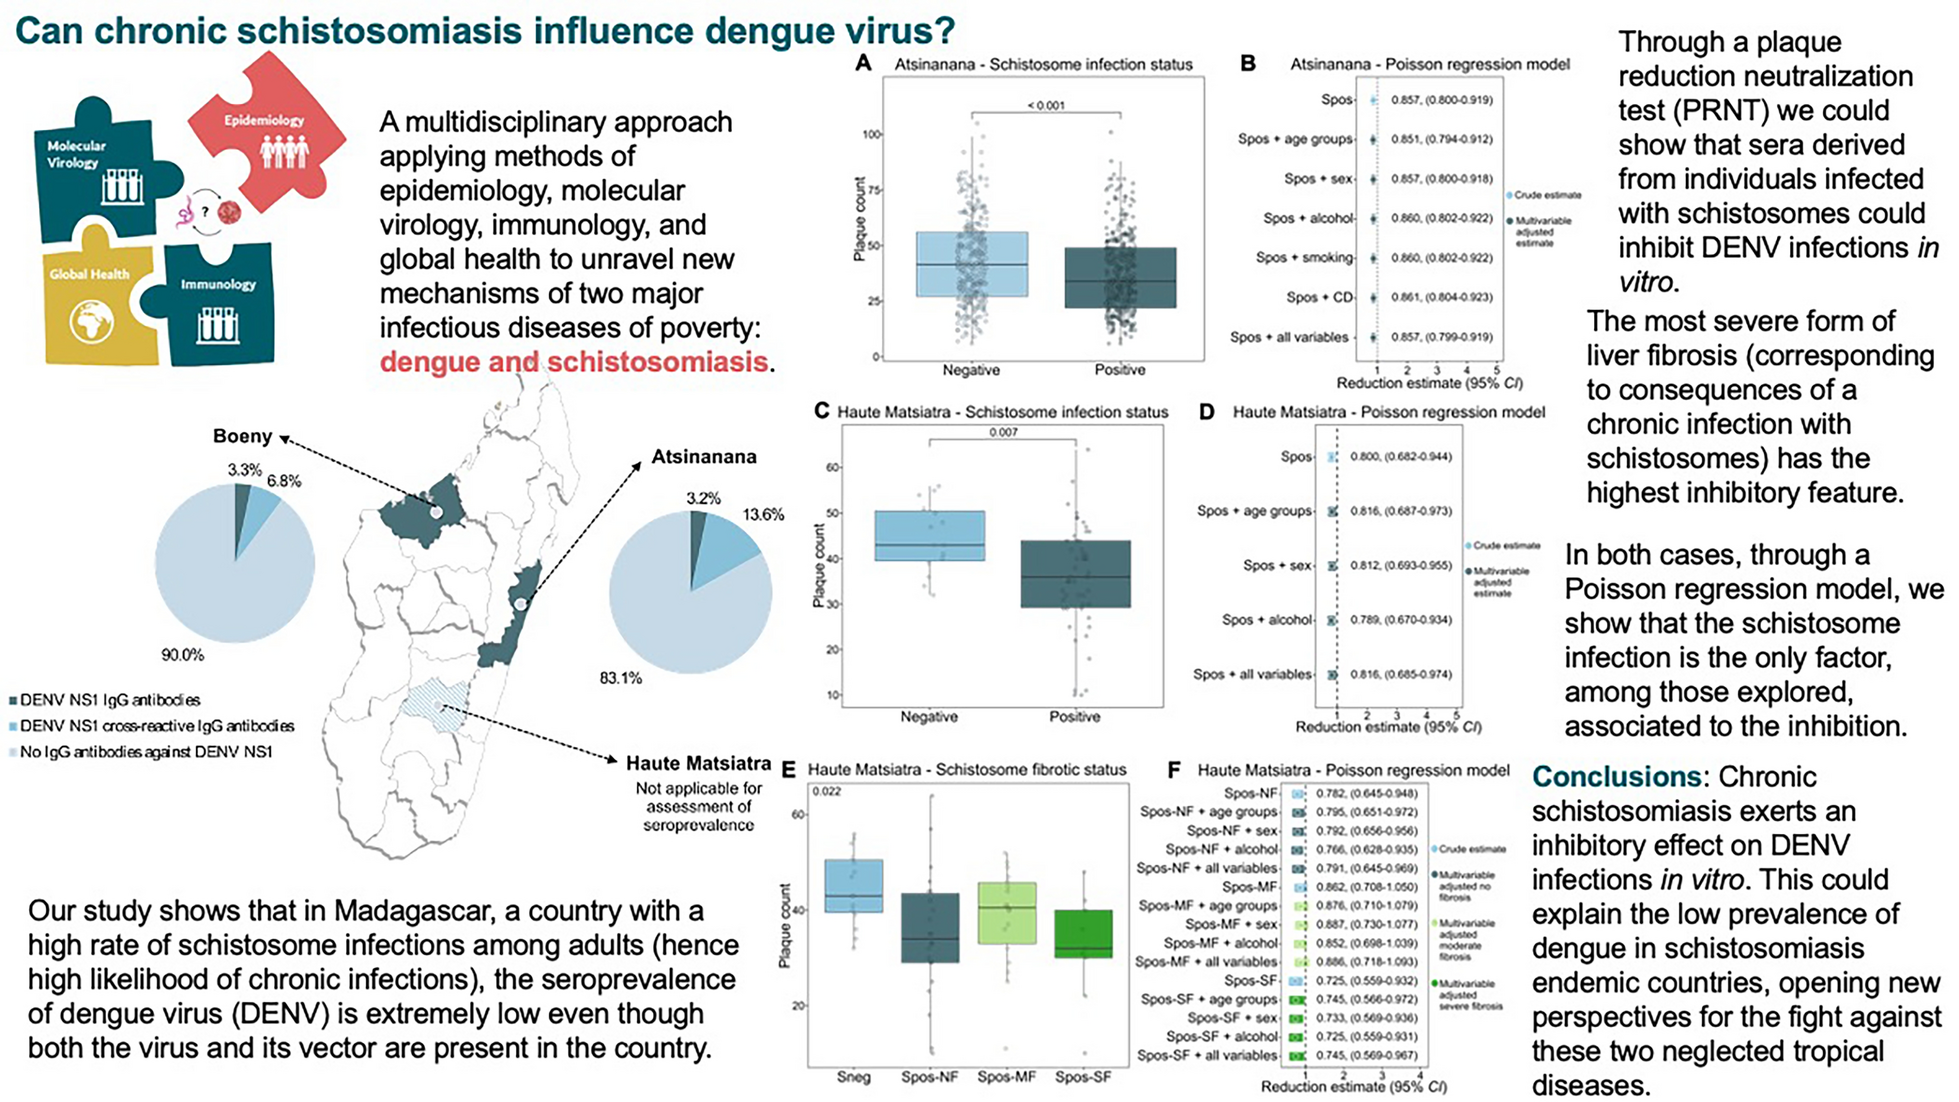
Plaque reduction neutralization test (PRNT). Non-heat-inactivated serum was diluted 1∶8 with Dulbecco’s Modified Eagle Medium, mixed with an equal volume of DENV2 (strain UVE/DENV-2/2018/RE/47099) and incubated for 1 h at 37 °C. The virus concentration used was adjusted to a range of 10–100 plaque forming units (PFU)/well, with 10 being the minimum plaque count when the DENV complex-reactive mouse monoclonal antibody D1-11(3) (IgG2a; GeneTex, Irvine, USA) was used as a positive neutralization control (final concentration: 1 µg/ml). The virus-serum mixture was transferred onto a Vero E6 monolayer (2.5 × 10⁵ cells/24-well) to allow infection for 1 h at 37 °C. The mixture was aspirated, and the cells were overlaid with 1.5% carboxymethyl cellulose in Minimum Essential Medium supplemented with 2% fetal bovine serum and incubated for six days at 37 °C in 5% CO2. Afterwards, the cells were fixed with 10% formaldehyde and stained with 1% crystal violet solution as previously described [26]. The plaque count for each sample was assessed and used for further analysis.
Cytokine profiling. Sera were subjected, in duplicate, to fluorescent bead measurement of cytokines and chemokines using the Human T Helper Cytokine Panel V02 (Cat # 741028), the Human Anti-Virus Response Panel (Cat # 740390), and the Human Anti-Virus Response Panel V02 (Cat # 741270), following the manufacturer’s instructions (BioLegend, San Diego, USA). The standard curves were optimized automatically by the software LEGENDplex Data Analysis Software Suite version 2025-05-01 (Qognit, San Carlos, USA) and verified manually.
IgE ELISA. The plasma samples were subjected to the Human IgE ELISA (Invitrogen, Waltham, USA), following the manufacturer’s instructions. Sample duplicates were bound to antibodies absorbed onto the microwells, before the addition of HRP-conjugated anti-human IgE antibodies. A colourful signal was measured at OD450. Sample IgE concentrations were determined via a standard curve for reference.
Statistical analysis
For numerical variables, medians and interquartile ranges (IQRs) are reported. For categorical variables, absolute and relative frequencies are reported. Seroprevalence rates with 95% confidence intervals (CIs) and crude prevalence odds ratios (cPORs) with 95% CIs were estimated using the R package epiR. Chi-square or Fisher’s exact tests were used to compare estimates between subgroups. The CIs of the median of cytokine concentrations were computed using the R package DescTools.
Comparisons of plaque counts, cytokine and IgE concentrations between groups were made via non-parametric Mann-Whitney-Wilcoxon or Kruskal-Wallis tests when applicable. Non-parametric tests were applied to provide more robust results accounting for small sample sizes and skewed distributions of outcome variables. Boxplots were used for graphical representation of plaque counts and IgE concentrations.
A multivariable Poisson regression model with correction for overdispersion was used to assess the effect of schistosome positivity on plaque counts and the influence of other covariables on this estimate. The percentage of reduction in the plaque count was calculated as (1–RR) × 100%. All analyses were performed using R software version 4.4.2 (R Core Team, Vienna, Austria).