Data source and study participants
To examine the trend in death rate from DCIS among women, we used the SEER 8 incidence-based mortality database (Atlanta [Metropolitan], Connecticut, Hawaii, Iowa, New Mexico, San Francisco-Oakland, Seattle-Puget Sound, and Utah), covering 8.3% of the U.S. population [4]. The SEER 8 incidence-based mortality database includes information on cases diagnosed since 1975, with their records linked to death certificate data. This historic database allows for secular trend analyses of cancer death rates by various tumor characteristics over the longest period in the United States. To enable assessment by race and Hispanic ethnicity, we also used the SEER 12 incidence-based mortality database that includes cases diagnosed since 1992 and race and ethnicity information [5]. Expanding on SEER 8, SEER 12 adds Alaska, Los Angeles, Rural Georgia, and San Jose-Monterey, covering 12.2% of the U.S. population.
From both SEER 8 and SEER12, we identified women diagnosed with DCIS as their primary incident cancer and who died from breast cancer (age at death, 40 + years). DCIS was defined per the International Classification of Disease for Oncology, 3rd Edition (ICD-O-3) (topography, C500-C509; histology 8201, 8230, 8500–8507, 8523; behavior, 2) [6] and the cause of death was derived from death certificates in the mortality database from the National Center for Health Statistics. DCIS-related deaths included breast cancer deaths among women diagnosed with DCIS as either first or higher-order primary cancer (e.g., second primary DCIS diagnosis following first primary lung cancer). To account for a favorable prognosis of DCIS and minimize differential influence of follow-back time across death years, we considered a 25-year follow-back (i.e., burn-in) period of incidence before each death year (incidence, 1975–2021 and mortality, 2000–2021 for SEER 8; incidence, 1992–2021 and mortality, 2017–2021 for SEER 12) [7]. Using a shorter burn-in period, such as 20 years, allowed for a longer trend analysis of death rates (starting from 1995 instead of 2000 for SEER 8), but resulted in fewer deaths captured (potential underestimation; Supplementary Fig. 1). In contrast, extending the burn-in period to 30 years did not substantially increase the number of deaths, yet it shortened the timeframe for trend analysis (starting from 2005). Therefore, a 25-year burn-in period was selected as a balanced approach (Supplementary Fig. 1). Similarly, women diagnosed with primary incident invasive breast cancer (topography, C500-C509; histology, all histologies excluding 9050–9055, 9140, 9590–9993; behavior, malignant, 4) and who died from breast cancer (age at death, 40 + years) were identified, incorporating the same 25-year follow-back period. Multiple primary invasive breast cancers were included, except for higher-order invasive breast cancers that were preceded by a DCIS diagnosis. We excluded autopsy or death certificate-only cases from the analysis.
Statistical analysis
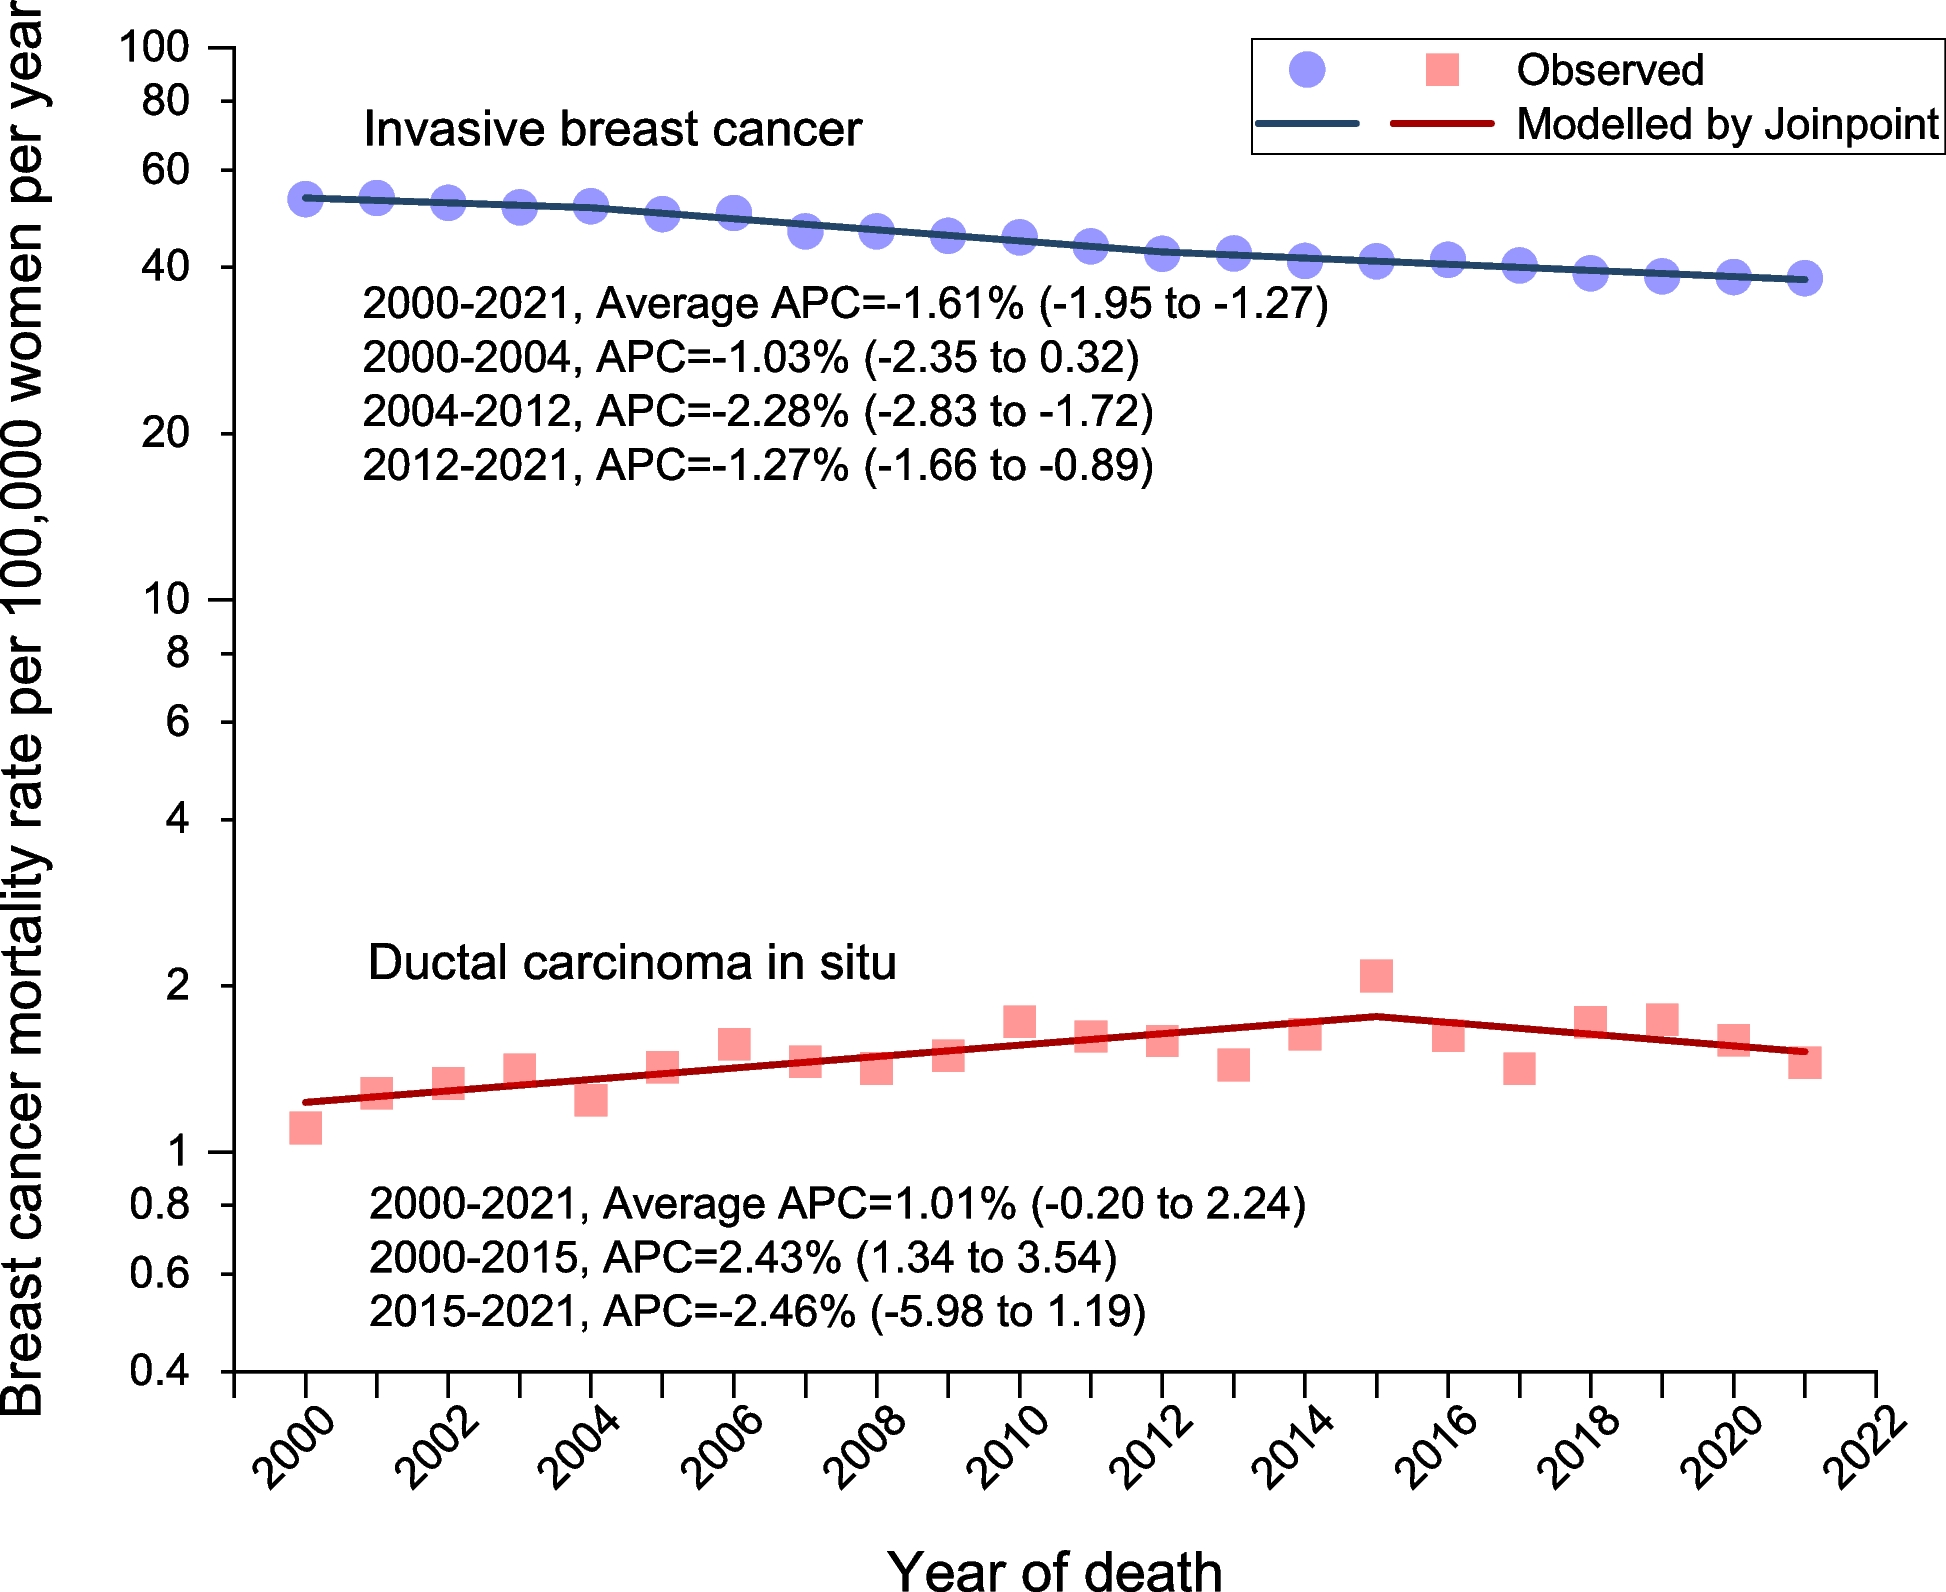
Based on the SEER 8, long-term trends in age-standardized death rates were quantified between 2000 and 2021 for DCIS and invasive breast cancer, separately, using Joinpoint regression. Joinpoint uses a segmented line regression model to fit a series of straight lines on a logarithmic scale and estimates annual percent changes (APCs) and corresponding 95% confidence intervals (CIs) (Supplementary Method). Average APCs were also calculated to summarize the trend throughout the study period. Using the SEER 12, racial and ethnic differences in death rates were measured from 2017 to 2021 by calculating rate ratios with corresponding CIs determined by the Tiwari method [8]. Calculations of annual age-standardized death rates and rate ratios were performed using SEER*Stat 8.4.4. A two-sided P-value of < 0.05 was considered statistically significant.