Study selection
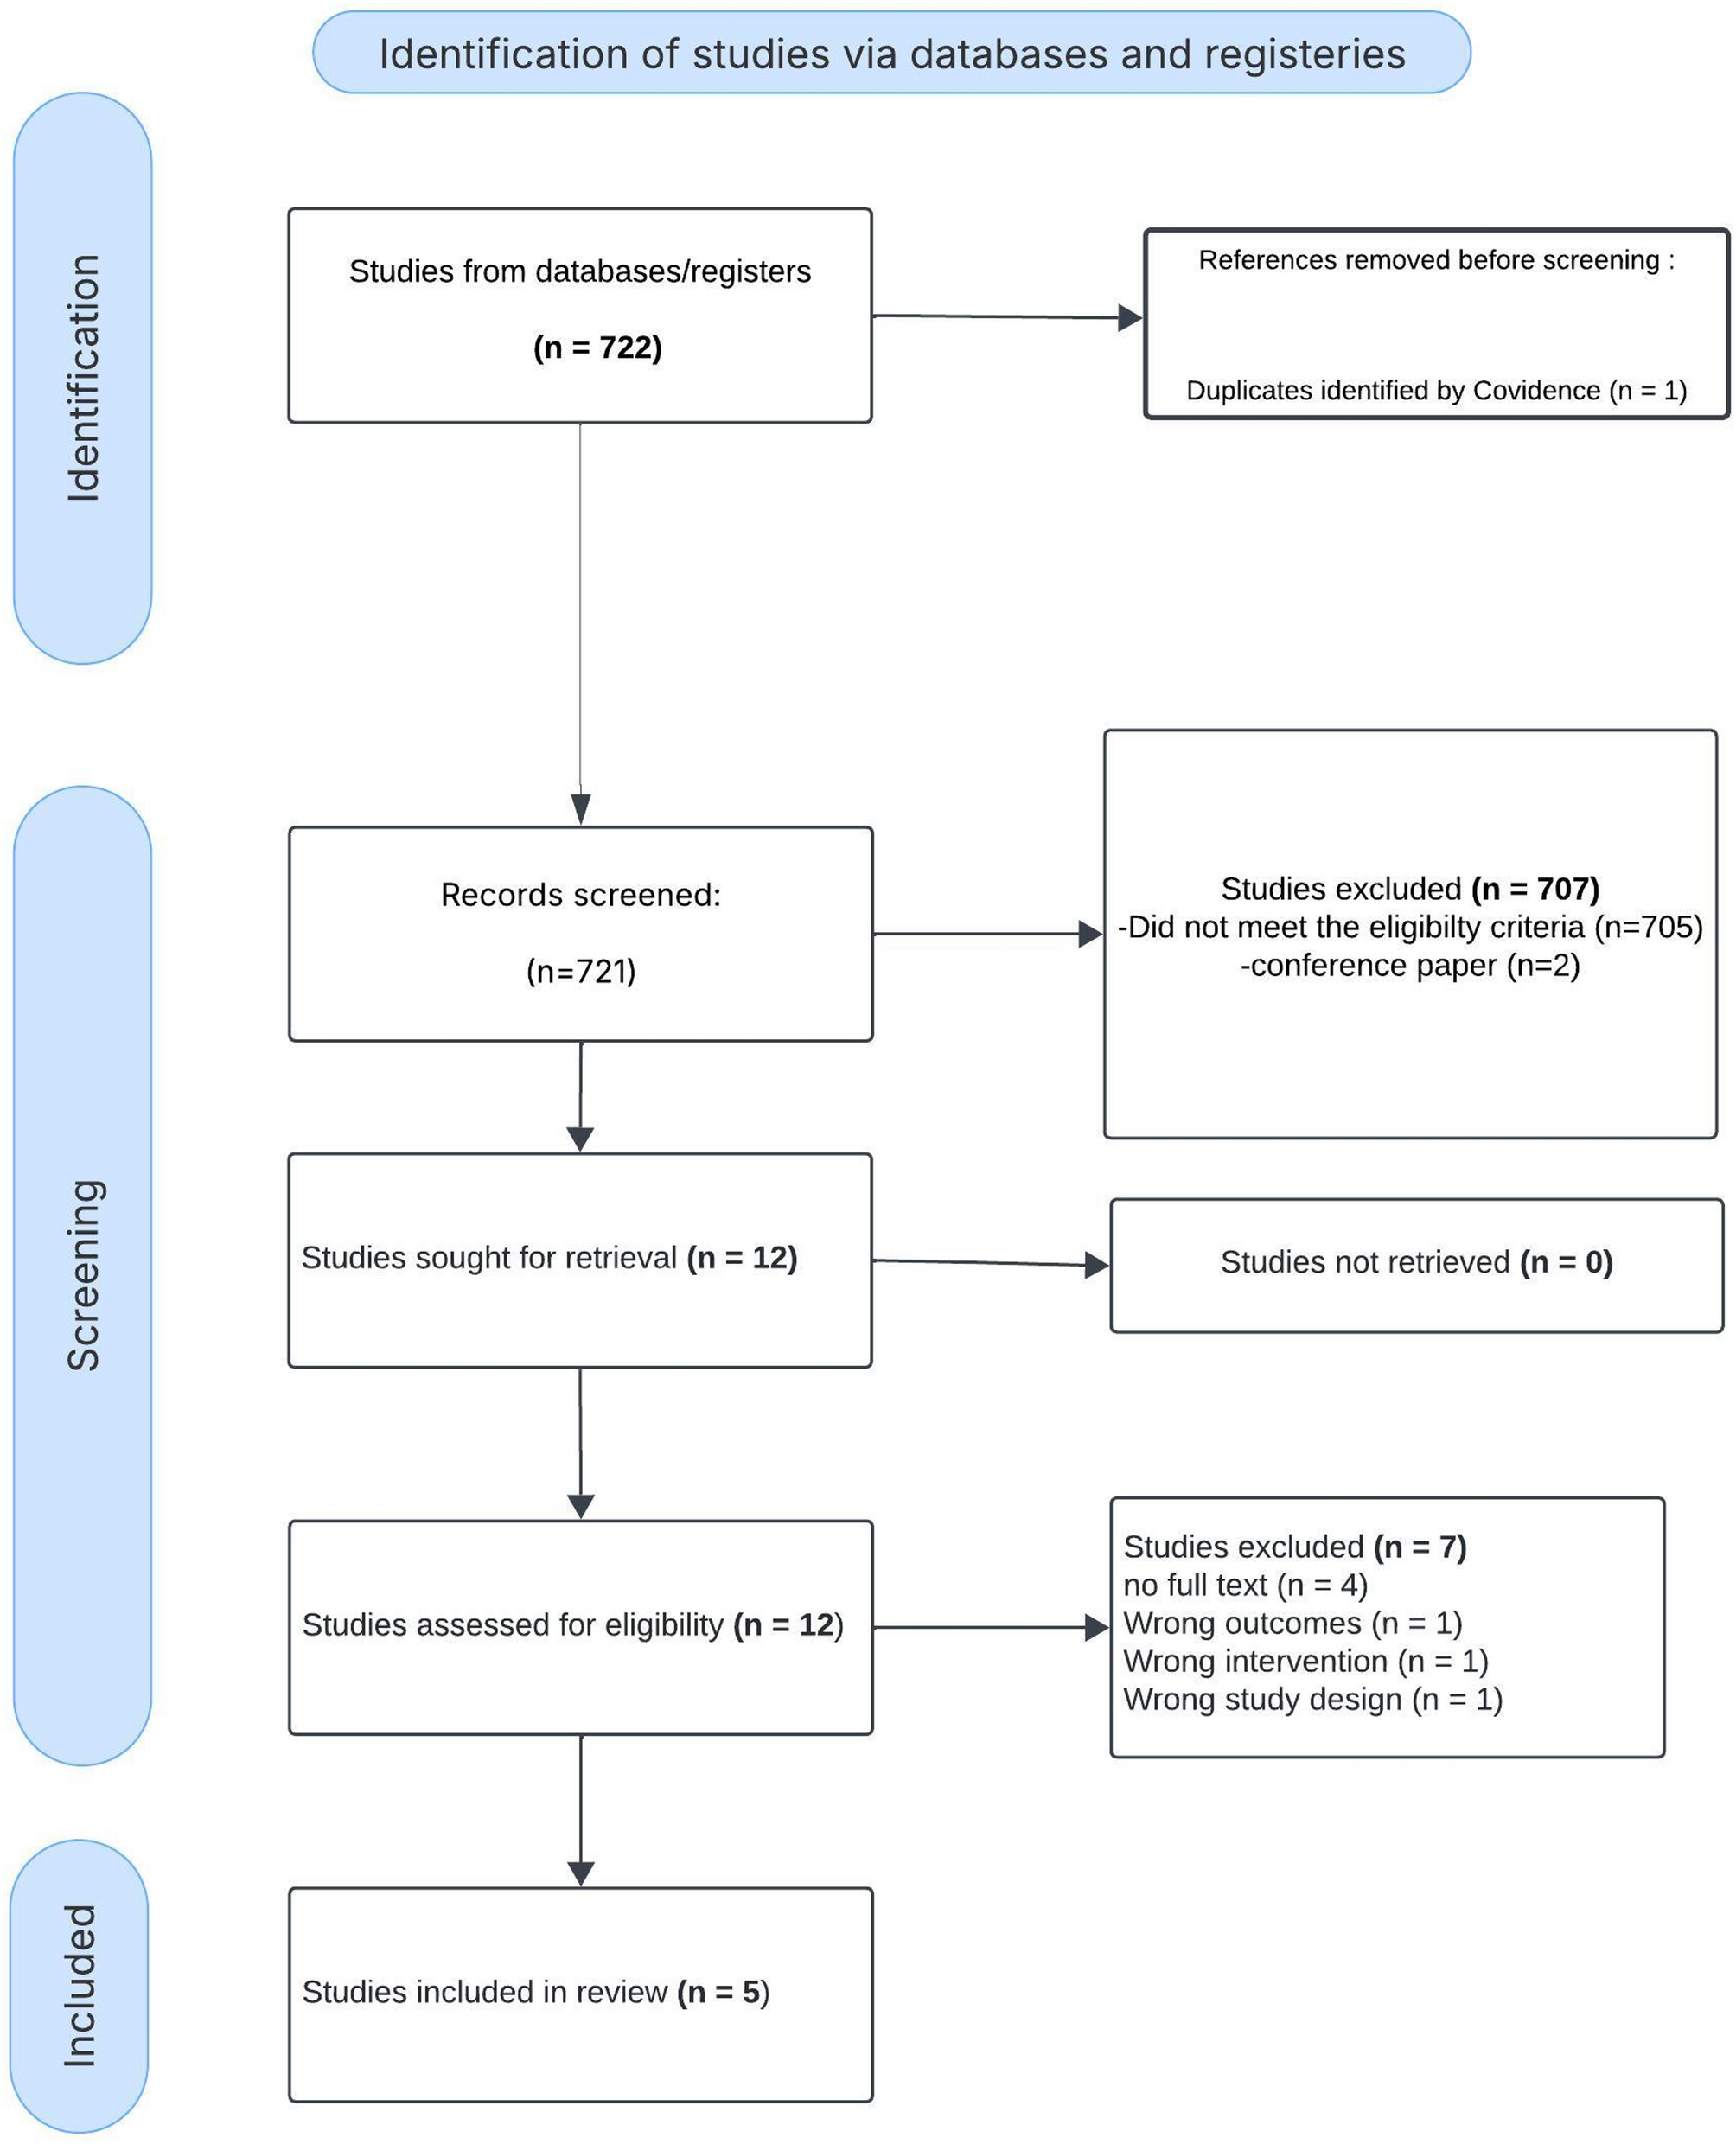
Among 722 identified studies, 12 articles underwent full-text review, and 5 studies met all eligibility criteria and were included in the final analysis. Studies were excluded if they were non-original, did not compare chloride levels or did not report mortality or AKI. During the full-text screening process, 7 studies were excluded. four were removed due to the unavailability of full-text access, while the remaining three were excluded because their outcomes and result data did not align with the requirements of our subject or data needs. (Fig. 1). The inter-rater agreement for study inclusion was substantial, (κ = 0.83).
PRISMA Flow Diagram for Study Selection in the Systematic Review. This PRISMA flow diagram illustrates the study selection process. Out of 722 identified records, 721 were screened, with 707 excluded. After full-text assessment of 12 studies, 5 were included in the final review, while 7 were excluded due to ineligibility
Study characteristics
The five included studies evaluated 3,537 adults with cirrhosis. Among them, three were single-center retrospective cohort [19, 22, 26], one was a single-center prospective observational study [27], and one utilized the Medical Information Mart for Intensive Care III (MIMIC-III) database [20].
Regarding the definition of hypochloremia, three studies defined it as a serum chloride < 99 mEq/L [19, 20, 26], while one study used < 107.35 mmol/L [22]. The remaining study did not report specify an exact cutoff for hypochloremia but categorized patients into 2 groups: hypochloremia and normochloremia [27].
The etiology of cirrhosis varied across the included studies, reflecting a wide range of underlying causes. In Maiwall 2021 [27], alcohol-related liver disease was the leading cause, accounting for 61.5% of cases, followed by hepatitis B (7.9%), hepatitis C (8.9%), non-alcoholic steatohepatitis (NASH) (11.7%), cryptogenic causes (8.6%), and other etiologies (1.4%). Similarly, in J. Cheng 2023, hepatitis B virus was the predominant cause, responsible for 59.9% of cases, with hepatitis C virus contributing to 7.7%, alcohol-related liver disease to 8.8%, autoimmune liver disease to 4.4%, and other causes to 19.2%.
In Semmler 2023’s [26] ACLD cohort, alcohol-related liver disease accounted for 40% of cases, viral hepatitis for 35%, non-alcoholic fatty liver disease (NAFLD) for 7%, and other causes for 17%. Within the ICU cohort of Semmler 2023, alcohol-related liver disease remained the predominant etiology at 64%, followed by viral hepatitis (19%) and other causes (17%). Similarly, Sumarsono 2020 [19], identified alcohol-related liver as the most common etiology, contributing to 63% of cases, followed by viral hepatitis (39%), NASH (12%), and autoimmune liver disease (3%). Finally, in Yun Ji & Libin Li 2021, cirrhosis was attributed to alcohol-related causes in 48.8% of cases and non-alcoholic causes in 51.2%.
The reported comorbidities among patients with cirrhosis varied across the included studies. In Maiwall 2021 [27], 21.3% of patients had diabetes mellitus, 13.4% had arterial hypertension, and 75.2% had prior decompensation. Additionally, 79.4% experiencing at least one extrahepatic organ failure, 31.6% had two organ failures, and 13.4% having three organ failures. J. Cheng 2023 did not report specific comorbidities, focusing instead on hepatitis-related factors. In Semmler 2023’s [26] ACLD cohort, 72% of patients had varices, 62% had a history of or current decompensation, and 21% had a history of variceal bleeding. However, comorbidity data were not reported for Semmler 2023’s ICU cohort [26], Yun Ji & Libin Li 2021 [20], or Sumarsono 2020 [19].
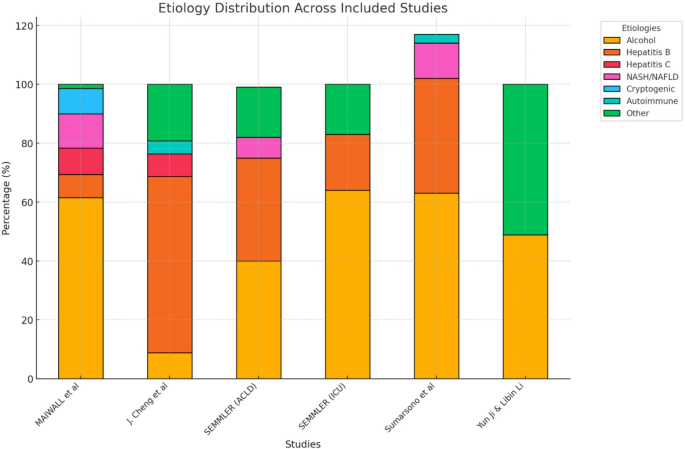
Etiology Distribution of Cirrhosis Across Included Studies. This bar chart illustrates the etiology distribution of cirrhosis across the included studies. The different colors represent various causes of cirrhosis, including alcohol-related liver disease, viral hepatitis (Hepatitis B and C), non-alcoholic steatohepatitis (NASH), cryptogenic causes, autoimmune liver disease, and other etiologies. The proportion of each etiology varies among studies, with alcohol being the predominant cause in most cohorts
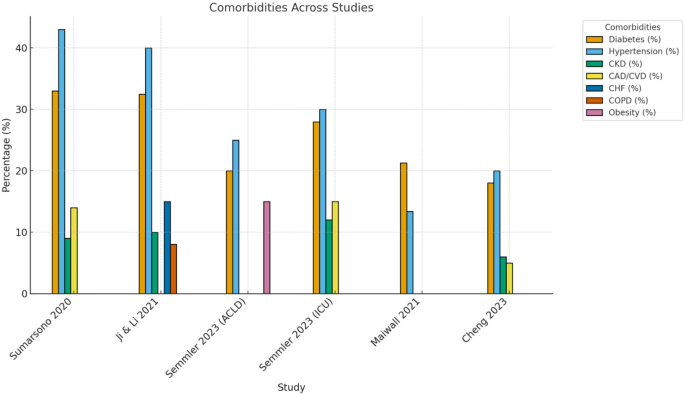
Reported Comorbidities in Patients with Cirrhosis Across Included Studies. Values represent the percentage of patients with reported cirrhosis-related complications in each study. Missing bars indicate that the variable was not reported. Semmler et al. presented separate ACLD and ICU cohorts, which are shown individually for clarity
Association of hypochloremia with mortality risk
Among the included studies, four assessed the association between hypochloremia and all-cause mortality, encompassing a total of 2,601 patients, with 589 in the hypochloremia group and 2,012 in the normochloremia group. Our pooled analysis revealed a significant association between hypochloremia and increased all-cause mortality, with a combined odds ratio (OR) of 2.52 (95% CI: 1.88–3.39; I² = 36%, p < 0.0001;). Mortality rates in the hypochloremia group ranged from 16.8 to 53.8%, compared to 1.1–15.8% in the normochloremia group (Fig. 4).
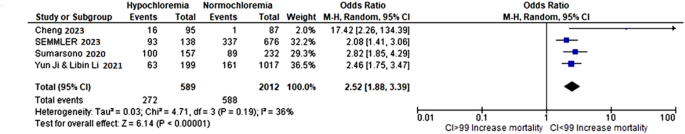
Forest Plot of the Association Between Hypochloremia and Mortality in Cirrhotic Patients. This forest plot shows the association between hypochloremia and mortality in cirrhotic patients, with an overall odds ratio (OR) of 2.52 [1.88, 3.39], indicating more than 2.5 times higher mortality risk in hypochloremic individuals. The pooled estimate (black diamond) is statistically significant (p < 0.00001), and heterogeneity is moderate (I² = 36%), suggesting consistency across studies
Correlation of chloride levels with creatinine and sodium
Among the included studies, the relationship between hypochloremia and creatinine levels was variably reported. Sumarsono 2020 [19] found that hypochloremia was associated with higher creatinine levels, reflecting worse renal function, with hypochloremic patients having significantly higher mean creatinine levels compared to those with normal chloride levels (1.7 mg/dL vs. 1.0 mg/dL, p < 0.01). Similarly, Ji and Li 2021 [20] observed significantly higher median creatinine levels in hypochloremic patients compared to those with normal chloride levels (1.4 mg/dL vs. 0.9 mg/dL, p < 0.001), further linking hypochloremia to impaired renal function. Cheng 2023 [22]. and Semmler 2023 [26]. did not report a direct relationship between chloride and creatinine levels. However, findings from Semmler 2023 change that change. suggest an indirect link between hypochloremia and renal dysfunction based on its overall impact on clinical outcomes.
Regarding the correlation between chloride and sodium levels, multiple studies consistently demonstrated a strong positive association. Cheng 2023 [22] reported a significant correlation between serum chloride and sodium levels (Spearman correlation coefficient: r = 0.451, p < 0.001). Sumarsono 2020 [19] identified a stronger correlation (r = 0.71, p < 0.0001), noting that hypochloremia frequently co-occurred with hyponatremia. Ji and Li found a similarly strong correlation (r = 0.771, p < 0.001) and highlighted that hypochloremia often coincided with hyponatremia (serum sodium < 135 mmol/L). Lastly, Semmler 2023 [26] reported significant positive correlations between sodium and chloride levels, with correlation coefficients of r = 0.634 in the ACLD cohort and r = 0.816 in the ICU cohort, underscoring the interdependence of these electrolytes in cirrhosis populations.